INTRODUCTION
Gaucher disease (GD) is the most common of the lysosomal storage diseases[1]. It results from accumulation of undegraded glucosylceramide in lysosomes within macrophages of the reticuloendothelial cell system due to a deficiency of the enzyme glucocerebrosidase. Consequently these macrophages, enlarged with a buildup of glycolipids, are called Gaucher cells and are most abundant in the bone marrow, spleen and liver. GD is inherited in an autosomal recessive manner[2].
Three clinical subtypes of GD have been described[3]. Type 1 does not have any involvement of the central nervous system and is the most common. It formerly was referred to as the “adult type”. However, this is a misnomer since type 1 can occur at any age and is currently know as the non-neuronopathic type. Although it is most common in the Ashkenazi Jewish population it can occur in all ethnic groups. Type 2 was formerly referred to as the “infantile type”. This type manifests with grave involvement of the central nervous system. It is rapidly progressive usually leading to death within 2 years. It is now known as the acute neuronopathic type. Type 3 also has central nervous system involvement but is less severe and is more indolent than type 2 leading to the current terminology, subacute neuronopathic type.
The clinical manifestations of GD are due to the accumulation of Gaucher cells in the reticuloendothelial system of the bone marrow, spleen and liver. There can be marked variability in the severity of symptoms and the course of the disease. This is particularly true for type 1 where some patients can remain asymptomatic through life. Although the visceral changes can be dramatic, the more debilitating symptoms arise from infiltration of the bone marrow and bone changes. Since type 1 is the most common and widely studied variant of Gaucher disease it will be the primary focus of this review.
GENETICS
Gaucher disease is inherited in an autosomal recessive manner. The diagnosis of GD is made by the demonstration of decreased glucocerebrosidase enzymatic activity in peripheral blood leukocytes or fibroblasts cultured from a skin biopsy. Generally there is a 70%-90% reduction in the enzyme activity when compared to normal[4].
Molecular testing by targeted mutation analysis is used for confirmation of diagnosis and may be helpful for genotype-phenotype correlations. There are more than 300 mutations in the glucocerebrosidase gene that cause Gaucher disease[2]. However, four common mutations - N370S, IVS2(+1), 84GG, L444P - account for approximately 96.5% of disease in Ashkenazi Jewish population in the western hemisphere and approximately 50%-60% in non-Jewish populations[5].
Genotyping is helpful to test at risk family members, for genetic counseling as well as for prognosis. However, genotype-phenotype correlations are limited due to the clinical heterogeneity of the disease. Moreover, the majority of the work on genotype-phenotype correlation was based on a heavily Ashkenazi Jewish population which could skew the results since many affected individuals with the N370S/N370S homozygous genotype may remain asymptomatic and not come to medical attention[2]. Never the less a few generalities can be made: (1) the presence of at least one N370S allele precludes development of neuronopathic disease; and (2) the presence of the L444P allele is strongly (but not exclusively) associated with neuronopathic involvement. In general, those homozygous for the N370S allele tend to have less severe manifestations of disease and compound heterozygotes with one copy of N370S and a second mutation being L444P, 84GG or IVS 2 + 1 tend to have more severe disease. In fact, adults homozygous for L444P mutation (L444P/L444P genotype) typically have the type 3 neuronopathic disease. However, these rules are not hard and fast due to the limited genotype-phenotype correlation. Some patients with the N370S/N370S genotype have profound symptomatic disease whereas a type 1 patient with N370S/L444P genotype may have mild symptoms.
VISCERAL MANIFESTATIONS
The viscera most commonly involved with accumulation of Gaucher cells are the liver and spleen. The pulmonary system can be involved as well; although it is very rare. Current recommendation for evaluating and monitoring visceral involvement is volumetric MRI (preferred due to lack of ionizing radiation) or CT every 12 to 24 mo[6].
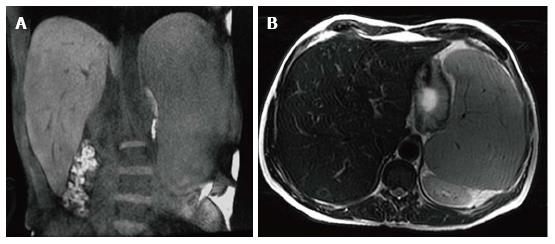
Gaucher cells accumulate in the Kupfer cells of the liver leading to hepatomegaly (Figure 1). Liver volumes in type 1 patients are typically approximately 2 times normal[8]. It is notable that glycolipid does not accumulate in the hepatocytes[8,9]. The Gaucher cells can conglomerate into nodules that can be seen with sonography or MRI. These nodules may be hypoechoic, hyperechoic, or mixed on sonography[10,11]. On MRI the nodules typically appear isointense or low signal intensity (SI) on T1 weighted imaging (WI) and high SI on T2 WI. Focal areas of extra-medullary hematopoiesis can have a similar appearance and can also be seen due the accompanying anemia. Hepatic infiltration can also lead to fibrosis and cirrhosis[12].
Figure 1 Hepatosplenomegaly.
Coronal T1 WI (A) and axial T2 WI (B) images in a male type 1 GD patient with N370S/N370S genotype demonstrate marked hepatosplenomegaly. The liver volume measured 3235 cc. The spleen volume measured 2923 cc.
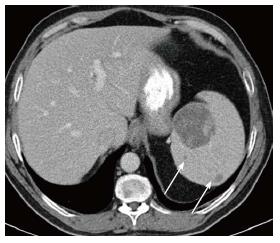
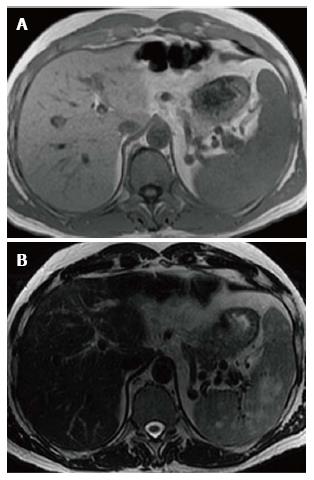
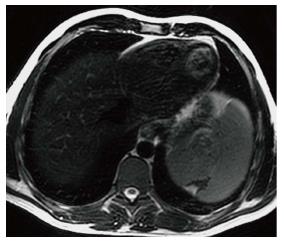
Splenomegaly results from accumulation of Gaucher cells within the spleen (Figure 1). Spleen volumes in type 1 GD are typically 5-15 times normal but the spleen size can be significantly enlarged in some cases and may be over 50 times normal[13]. Focal splenic masses are common and may represent clusters of Gaucher cells or extra-medullary hematopoiesis. They may be detected with sonography, CT or MRI. Similar to the liver, Gaucher masses in the spleen may be hypoechoic, hyperechoic, or mixed echogenicity[11,14]. On CT the masses are low density[15] and occasionally peripherally calcified (Figure 2). These masses are most commonly imaged with MRI. They typically are low SI or isointense on T1 WI and high SI on T2 WI[16] (Figure 3). Low SI on gradient recalled echo imaging in these masses is thought to be secondary to iron contained in the Gaucher cells[17]. Splenic infarcts can occur as well due to massive splenomegaly and can be detected with imaging as well (Figure 4).
Figure 2 Splenic mass on computed tomography.
Axial computed tomography image shows a large low density mass with patchy foci of soft tissue density within it in the medial aspect of the spleen. Additional smaller low density masses are present as well (arrows).
Figure 3 Splenic mass on magnetic resonance.
Axial T1WI (A) image shows no apparent abnormality within the spleen consistent with isointense signal intensity (SI) masses. Axial T2WI (B) image at the same level reveals multiple masses in the spleen to be high SI.
Figure 4 Splenic infarct.
Axial T2 WI image demonstrates a wedge shaped defect in a subcapsular region of the spleen in its superior aspect. The defect has low signal intensity (SI) along the edges indicating fibrous tissue. In addition, high SI fat has filled the area left by the retracted capsule.
An infrequent manifestation of GD is pulmonary involvement which is more commonly seen in type 1 patients who have undergone splenectomy and those with type 3[18]. The lung findings are thought to be secondary to direct infiltration by Gaucher cells into the interstitial spaces, alveolar spaces and capillaries[19] as well as indirect causes secondary to hepatopulmonary syndrome related to the liver manifestations and/or aspiration associated with neurologic manifestations. Chest radiographs generally are normal or demonstrate a reticulo-nodular pattern. The findings are best imaged by high resolution CT and include interstitial thickening (both interlobular and intralobular), ground glass opacity, consolidation and bronchial wall thickening[20,21]. Pulmonary hypertension can be the result of lung involvement[22-24]. Symptomatic pulmonary involvement is generally seen in patients with more striking visceral and skeletal findings.
SKELETAL MANIFESTATIONS
The skeletal manifestations of GD lead to the most debilitating complications of the disease and significant morbidity. Gaucher cells infiltrate and accumulate in the bone marrow. The pathophysiology of how the infiltration leads to the bone changes is not well understood. Proposed mechanisms include altered bone formation and resorption, as well as increased intra-osseous pressure due to the infiltration leading to vascular occlusion[3,25].
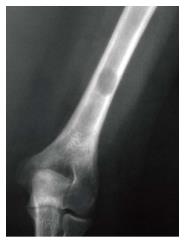
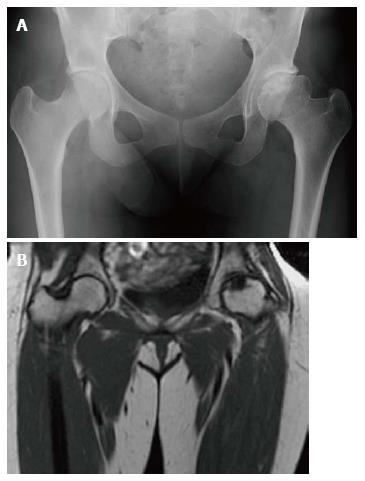
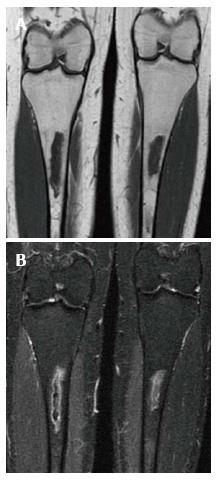
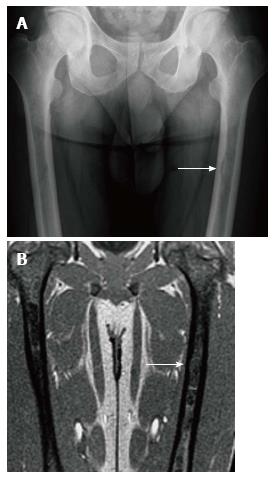
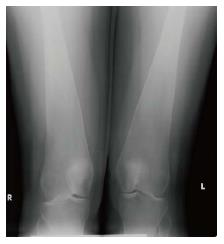
An array of bone findings are seen in GD, including growth retardation in children, osteopenia, lytic lesions (Figure 5), pathologic fractures, bone pain, osteonecrosis (Figure 6), cortical and medullary infarcts (Figure 7) and evidence of bone crises[3,26]. The severity of bone findings in GD depend on the extent of medullary cavity substitution. Marrow replacement with Gaucher cells can lead to expansion of the medullary cavity with thinning of the cortex and endosteal scalloping (Figure 8) and consequent diffuse osteopenia. In addition, the medullary expansion leads to a failure of remodeling in the distal femurs resulting in the so called Erlenmeyer flask deformity (Figure 9). These manifestations can be imaged using a variety of modalities including radiography, MRI, dual energy X-ray absortiometry (DEXA) and radionuclide imaging. However, the mainstay of skeletal imaging in GD involves MRI.
Figure 5 Lytic lesion.
Frontal radiograph of the distal right humerus demonstrates a well demarcated lytic lesion that does not show sclerotic borders, endosteal erosion or associated expansion of the humeral shaft.
Figure 6 Osteonecrosis.
Frontal radiograph of the pelvis (A) shows avascular necrosis of the left femoral head. The femoral head has a flattened contour with sclerosis in the subcapsular areas. Note that the joint space is maintained. Coronal T1 WI (B) in the same patient again demonstrated an abnormal shape of the left femoral head with flattening superiorly. In the same area there is a focus of low SI indicating the devasularized bone.
Figure 7 Medullary infarction.
Coronal T1 WI (A) image shows irregularly bordered areas of low SI within the medullary cavity of both tibiae. The same areas show peripheral serpigenous high SI on the coronal short tau inversion recovery (STIR) (B) image. The appearance is typical of an infarct.
Figure 8 Endosteal scalloping.
Frontal radiograph (A) of the femurs shows an area of rounded thinning of the medial cortex of the left femur (arrow). Coronal out of phase image of the femurs in the same patient (B) shows low signal intensity in that same area due to expansion of the medullary cavity due to infiltration. The thinning of the cortex is less apparent on magnetic resonance than on radiography.
Figure 9 Erlenmeyer flask deformity.
Frontal radiograph of the distal femurs demonstrates flaring of the bone and thinning of the cortex due to under-tubulation of the metadiaphysis.
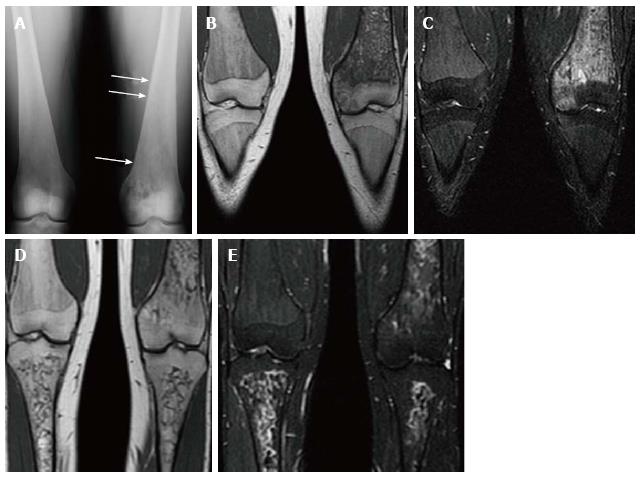
Bone crises are most common in childhood and adolescence presenting as episodes of severe bone pain associated with fever and leucocytosis. The signs and symptoms are indistinguishable from osteomyelitis, however no infection exists. The terms “pseudo-osteomyelitis” and “aseptic osteomyelitis” have been historically used to characterize this condition[3,27] (Figure 10).
Figure 10 Psuedo-osteomyelitis.
Frontal radiograph of both distal femurs in 2009 (A) demonstrates an irregular area of patchy lucency in the medial condyle of the left femur. There is periosteal reaction in this area as well as more superiorly (arrows). Coronal T1 WI (B) image at the same time in 2009 demonstrate low SI in the medial condyle of the femur extending into the medial epiphysis. There is high SI in these areas on coronal STIR (C) image which extends into the adjacent soft tissues where the periosteal reaction is seen on the radiograph. There is no joint effusion. The patient presented with left knee pain and the imaging was suspicious for osteomyelitis involving the medial distal femur. However, the patient has no fever and cultures were negative. Coronal T1 WI (D) of the same area in 2011 shows resolution of the low SI in the medial condyle and epiphysis. The corresponding high SI on the STIR image (E) has resolved as well.
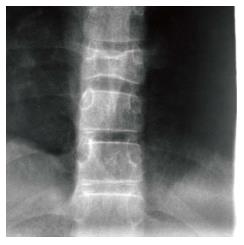
Osteonecrosis, otherwise known as avascular necrosis, is due to lack of blood supply and consequent bone death. It is most commonly seen in the femoral heads (Figure 6), proximal humeri and vertebral bodies. The vertebral body can “cave in” leading to the “H-shaped” vertebra, i.e., Reynolds phenomenon, similar to sickle cell disease (Figure 11). While the end result is similar in both diseases the mechanism of formation is different. In GD the entire vertebral body collapses followed by peripheral regrowth while in sickle cell disease the deformity is secondary to central growth arrest[28]. The necrotic bone crumples and leads to malformation and/or fracture, sometimes requiring treatment with a bone prosthesis or joint replacement.
Figure 11 H-shaped vertebra.
Cone down frontal radiograph of the lower thoracic spine demonstrates collapse of a lower thoracic vertebral body with bi-concave upper and lower end plates giving the Reynolds phenomenon of Gaucher disease.
Radiography is used primarily to image cortical bone. It can detect lytic (Figure 5) or sclerotic lesions within bones. Fractures, both traumatic and pathologic, are readily detected on radiographs. In addition, endosteal scalloping (Figure 8) and the Erlenmeyer flask deformity (Figure 9) due to marrow expansion are also detected with radiography. Although changes in cortical bone secondary to marrow infiltration can be detected with this modality, the marrow space itself is cannot be evaluated by radiography.
Osteopenia is near universal in GD as a representation of decreased bone mineral density. A significant decrease in bone density must occur before osteopenia is perceived on radiography leading to its poor sensitivity for detecting this abnormality. DEXA is the current modality of choice for evaluation of osteopenia and bone mineral density. However, care must be taken to avoid areas of osteonecrosis during DEXA evaluations.
The bone marrow itself is best assessed with MRI. Normal yellow (fatty) marrow is seen as high signal on T1 WI and T2 WI. The infiltration of the marrow by Gaucher cells replaces the normal yellow marrow. Marrow infiltration generally follows the distribution of cellular read marrow progressing from the axial to the peripheral skeleton and from the proximal to the distal aspects of the long bones with a tendency to spare the epiphyses[29].This is recognized as a change to low SI on both T1 and T2 WI[29,30] (Figure 12). On short tau inversion recovery (STIR) images the infiltration appears slightly high SI[31]. High SI within the marrow on T2 or STIR images suggests edema within the marrow and the presence of an “active” process such as a bone crisis or infection[32]. Evaluation of bone marrow infiltration in children is complicated by the fact that normal red marrow which is seen in this age group manifests with low SI on both T1 and T2 WI.
Figure 12 Bone marrow infiltration.
Coronal T1 WI (A) of the distal femora and proximal tibiae in a type 1 gaucher disease patient shows low signal intensity (SI) in the bone marrow which spares the epiphyses that demonstrate the normal fatty marrow SI. Coronal short tau inversion recover (STIR) (B) image demonstrates that the low SI on T1 becomes slightly high SI on STIR.
Radionuclide imaging is useful for evaluating bone changes in GD. Bone scintigraphy utilizing Technicium 99m-methylene diphosphonate (99mTc-MDP) can be used to evaluate for fractures that are not readily apparent on radiography. In addition, this tracer can be used to help differentiate a bone crisis (aseptic infarction) from osteomyelitis. In a bone crisis bone scintigraphy performed within 1-3 d of the onset of pain will demonstrate decreased tracer uptake at the involved site unlike infection that shows increased uptake[33,34]. The same agent can be used to help evaluate for complication related to joint prostheses such as loosening[31]. Scintigraphy using leucocytes labeled with Indium-111 is commonly used to image areas of suspected infection including osteomyelitis and around joint prostheses.
Prior to the advent of MRI, radionuclide imaging was also used for evaluation of the bone marrow. Technicium 99m sulfur colloid (99mTC-SC) accumulates in normal bone marrow. Therefore in marrow infiltrated and replaced by Gaucher cells there will be decreased uptake or an abnormal pattern of uptake compared to normal[34]. This gives an indirect sign of infiltration. Another tracer, Technicium 99m sestamibi, has the advantage of being accumulated in areas of Gaucher cell deposition[35,36]. Mariani et al[35] imaged 74 Italian patients with Gaucher disease using technetium 99m sestamibi and showed 71 of 74 demonstrated uptake predominantly in the distal femur. An undisclosed number of these patients had MR imaging performed at the same approximate time revealing low SI in the same regions. Therefore it is a method of direct visualization of infiltration. Bone marrow sestamibi imaging can be advantageous when imaging children and trying to differentiate Gaucher infiltration from normal red marrow in children. Positron emission tomography has become widely available in recent years. Imaging with the most common radiotracer, fluoride-18 fluorodeoxyglucose, has not proven beneficial for detecting marrow involvement in GD. However, a newer tracer, fluoride-18 L-thymidine, shows promise for imaging bone marrow[37]. Since it is not yet FDA approved its use is limited to clinical trials and its role if any in GD has not been established. Therefore, MRI remains the modality of choice for imaging bone marrow due the poor spatial resolution of scintigraphy as well as the associated radiation dose of radionuclide imaging.
An essential problem of imaging is that it only gives a qualitative assessment of bone marrow infiltration. An MRI shows decreased SI on T1 WI but there is no way to measure the “amount” of signal. A visual assessment of improvement or worsening can be made on the basis of the MR image but that is qualitative and not very useful to clinicians. One way of directly measuring bone marrow disease has been developed, Dixon’s quantitative chemical shift imaging[38]. Chemical shift imaging leverages the difference in resonance frequencies between water and fat molecules thereby defining the amount of fat or fat fraction within bone marrow. The fat fraction of normal marrow decreases as the amount of infiltration replaces the triglyceride rich fat cells of normal marrow. Studies have shown a low marrow fat fraction as measured by quantitative chemical sift imaging to correspond to worse clinical disease and more bone complications[39-42]. However, the technique is complex and not widely used outside academic centers. To overcome this problem several semi-quantitative methods have been developed including the Rosenthal staging system[29], the Dusseldorf score[43], the Terk classification[44] and the bone marrow burden (BMB) score[45]. All use conventional MR imaging technology and assign points based on changes in marrow signal intensity at different anatomic locations.
The BMB score is the most widely used and validated[45,46]. The BMB score[45] incorporates both the visual interpretation of SI and the geographic location of the disease on conventional MR images of the lumbar spine and femora. The SI of the bone marrow in the femora is compared to the subcutaneous fat on both T1 and T2 WI sequences. The SI of the bone marrow in the lumbar spine is compared to a non-diseased intervertebral disc on both T1 and T2 WI sequences. The SI is scored as hyper-intense, slightly hyper-intense, iso-intense, slightly hypo-intense, and hypo-intense. A numeric value ranging from 0-2 is assigned based on the SI. Point values are also assigned based on the location/distribution of the marrow infiltration. In the femora, sites of involvement including the diaphysis, proximal epiphysis/apophysis and distal epiphysis are evaluated. In the lumbar spine, the distribution of infiltration is evaluated as patchy or diffuse with special attention given to absence of fat in basivertebral vein region. The score for the femora (0-8) and the lumbar spine (0-8) are added together for a total score which can range from 0 to 16. A higher score indicates more severe the bone marrow involvement. In their study of 12 patients with Gaucher disease[45], Maas et al[45] demonstrated good correlation of the BMB score with fat fraction determination by the Dixon technique. That study also showed a decrease in the BMB score in patients on enzyme replacement therapy (ERT), however, it was less sensitive for detection of marrow improvement than Dixon method.
TREATMENT
Only supportive treatment or surgical intervention including splenectomy and joint replacement was available for patients with Gaucher disease into the early 1990s. In 1991 ERT with placentally derived enzyme alglucerase (Ceredase®, Genzyme Corporation, Cambridge, Mass.) came into existence. Following this, in 1994, recombinant mannose-terminated human glucocerebrosidase (Cerezyme®, Genzyme Corporation) received FDA approval. The goal of ERT is to treat the symptoms of the disease as well as to prevent complications particularly the skeletal complications[6].
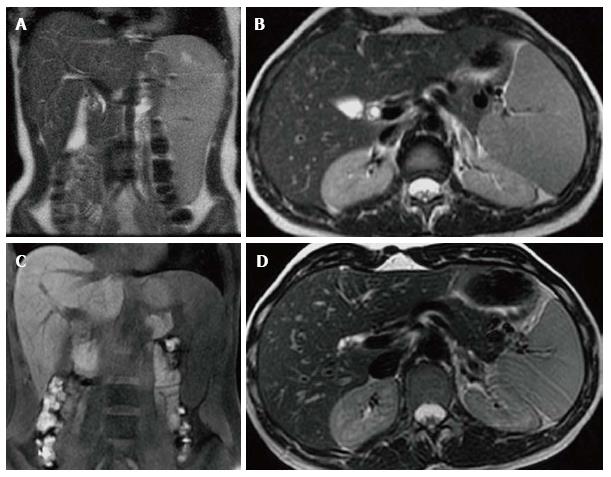
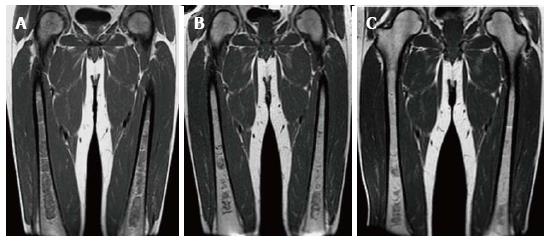
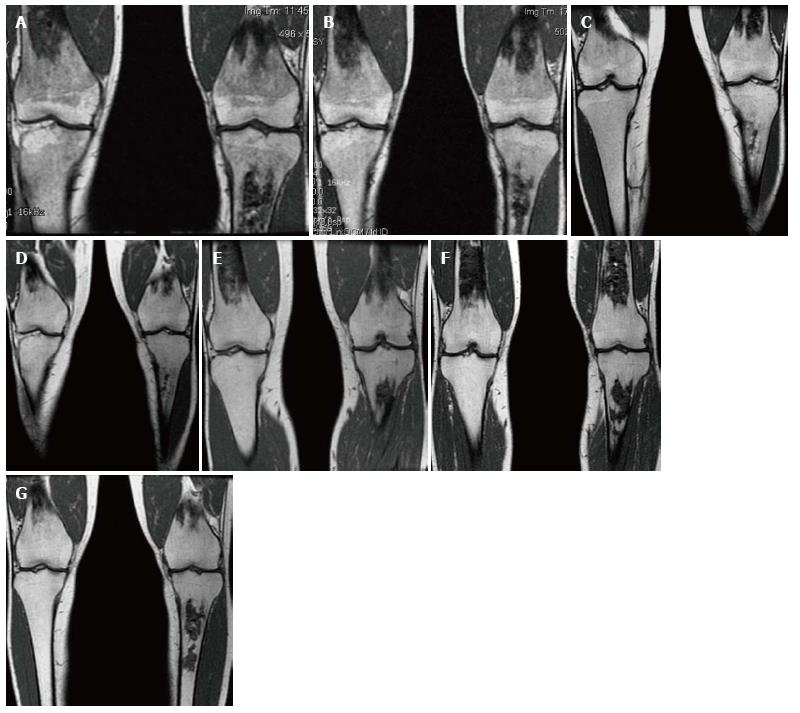
The visceral and hematologic manifestations of GD respond relatively quickly to ERT[47,48] (Figure 13). The anemia and thrombocytopenia can improve within 6 mo to one year of initialing ERT. The liver and spleen volumes generally can decrease by approximately 50% within the first 2 years but rarely ever return to a normal volume even with long term treatment. Although some improvement in pulmonary involvement has been reported with ERT, response is generally slow, and sometimes no improvement is seen[23,49]. The marrow infiltration responds to ERT as well but takes much longer to be seen[50,51] (Figures 14 and 15). Some skeletal manifestations, such as osteonecrosis, osteosclerosis and vertebral body collapse, remain irreversible. The neurologic manifestations of GD do not respond to ERT since it does not cross the blood-brain barrier[52].
Figure 13 Visceral improvement on enzyme replacement therapy.
Female type 3 Gaucher disease patient who began enzyme replacement therapy (ERT) in 2007. Initial evaluation in 2007 before starting ERT shows that the spleen extends down to the iliac crest on the T2 WI coronal image (A). On the axial T2 WI (B) the left lobe of the liver extends across the midline posterior to the lateral aspect of the left rectus abdominus muscle and anterior to the stomach. At that time the liver volume measured 1702 cc and the spleen volume measured 769 cc. After 6 years on treatment, repeat imaging in 2013 reveals the inferior edge of the spleen is now above the iliac crest on the coronal T1 WI (C) and the left lobe of the liver now extends only slightly across the midline to end posterior to the medial aspect of the rectus abdominus muscle and the stomach is now lateral to the liver on the axial T2 WI (D). In 2013, the liver volume measured 1163 cc and the spleen volume measured368 cc.
Figure 14 Bone marrow improvement on enzyme replacement therapy.
Type 1 GD male patient with N370S/N370S genotype who began enzyme replacement therapy (ERT) in October of 2007 shows relatively rapid improvement of the bone marrow infiltration. Initial coronal T1 WI of the femora (A) demonstrates diffuse low SI throughout the medullary cavity consistent with marked infiltration. Coronal T1 WI in 2009 (B) after only 2 years of treatment shows significant improvement in the infiltration manifest by decreased low SI in the medullary cavity. In 2011, coronal T1 WI (C) shows continued slight decrease in the amount of low SI in the bone marrow.
Figure 15 Bone marrow improvement.
Gaucher Type 1 patient with N370S/N370S genotype who started enzyme replacement therapy (ERT) in 1997. Coronal T1 WI of the distal femora and proximal tibiae in 1998 (A), 1999 (B), 2002 (C), 2003 (D), 2006 (E), 2008 (F) and 2011 (G). Medullary infarcts are partially seen in both distal femurs and the left tibia. The low T1 SI significantly improves between 1998 and 2002 with near normal marrow signal seen in the noninfarcted areas in 2008 and years later. Although this patient has the same genotype as the patient in Figure 14, there is a longer time to improvement indicating the limited genotype/phenotype correlation.
An alternative to ERT for treatment of GD is substrate reduction therapy. Whereas ERT works by replacing the deficient enzyme, substrate reduction works by decreasing the production of the substrate glucosylceramide. Since most type 1 GD patients have some residual enzyme activity, reducing the amount of substrate may allow the native enzyme to succeed. The first medication of this kind was N-butyldeoxynojirimycin (miglustat) approved by the FDA in 2003. It is an oral medication for use in mild to moderate type 1 GD patients who cannot tolerate ERT. Studies have shown improvement of anemia, platelet count, liver volume and spleen volume alone or in combination with ERT[53-55]. One study also showed improvement of bone disease on miglustat[56,57]. However, side effects particularly diarrhea, weight loss and tremors were significant[52] and its use is limited in the United States Unlike ERT miglustat can cross the blood-brain barrier[52] and has shown promising results in treating neurologic manifestations in combination with ERT[58,59]. A study also shows improvement of pulmonary manifestations with single drug treatment[60]. Currently there is a newer oral substrate reduction therapy agent, eliglustat tartrate, which has demonstrated efficacy in GD type 1 patients with a more favorable side effect profile[61]. It is currently undergoing phase III trials.
Both ERT and substrate reduction therapy can lead to improvement in the signs and symptoms of GD. However, there is a significant cost to the treatment ranging from US$100000 to $250000 per year[62]. Thus judicious use is warranted. Imaging plays a significant role in determining which patients need treatment and in surveillance of those on treatment. Current recommendations call for abdominal MRI for determination of liver and spleen volume, MRI of the bilateral femora, radiography of the spine and DEXA of the hips and lumbar spine in the initial assessment[6]. For those patients not on treatment being followed and those on treatment, the same imaging protocol is recommended every 12-24 mo or at the time of a dosage change or significant clinical complication[6].


