INTRODUCTION
Diffusion is the constant and uninhibited random Brownian motion of water molecules. Diffusion of water at the molecular level in biological tissues is modified and limited by interactions with cell membranes and macromolecules[1,2]. Magnetic resonance imaging (MRI) diffusion-weighted imaging (DWI) uses the differences in the motion (diffusion) of water molecules in extracellular and intracellular fluid and vascular fluids to produce image contrast, with no need for exogenous contrast materials. This imaging technique provides both qualitative and quantitative information at the cellular level with regards to tissue cellularity and cell membrane integrity and is hence considered a form of functional imaging[1,3,4]. DWI has been predominantly used in the brain in the evaluation of stroke and can help diagnose ischemic changes before signal alterations of other pulse sequences and morphological abnormalities become apparent. Over the past decade, there has been increasing interest in the use of DWI for the evaluation of extracranial conditions due to a variety of technical advances, such as development of high amplitude gradients, multichannel surface coils and parallel imaging[1].
Diffusion is inversely related to cellularity, cell membrane integrity and lipophilicity[1-3]. Restricted (or impeded) diffusion is observed in tissues with high cellularity, e.g., tumors, abscesses, fibrosis and cytotoxic edema. Relatively free or unimpeded diffusion is found in tissues with low cellularity or disrupted cell membranes, such as cysts and necrotic tissues[1-3,5,6]. Intravascular water molecules have a larger diffusion distance and contribute more to the DWI signal than water molecules in the extracellular and intracellular spaces. Hence, tumors with high vascularity have higher DWI signals[1,3].
TECHNIQUE
DWI is based on T2-weighted imaging. For most clinical uses, a symmetrical pair of diffusion-sensitizing (bipolar) gradients is applied around the 180° refocusing pulse of a standard T2-weighted sequence. The phase shift induced by the first diffusion gradient in static water molecules is subsequently rephased by the second diffusion gradient. Hence, in static tissue, there is no significant change in measured signal intensity. In contrast, moving water molecules are not rephased by the second gradient (due to motion), resulting in signal loss. Thus, motion and signal loss are proportional and motion of water molecules is detected as a reduction in measured signal intensity[1,3].
Free breathing and breath-hold imaging techniques have been used for abdominal DWI. The breath hold (e.g., single-shot fast-spin EPI with parallel imaging) sequences are commonly used in clinical practice and result in fewer motion artifacts and better anatomic detailing[1,3]. Hence, this technique is useful for detecting small lesions. Disadvantages include poor signal-to-noise ratio (SNR), artifacts due to pulsatility and susceptibility, and only a limited number of b values can be obtained per breath hold. Non-breath hold DWI techniques provide improved SNR and contrast-to-noise ratios, allowing for higher spatial resolution and the possibility of multiplanar reformatting. Multiple b values can also be easily obtained but this technique is prone to partial volume averaging artifact and can be time consuming[1,3]. Respiratory motion compensation techniques can be used to reduce motion artifacts.
With all DWI techniques, TR should be maintained long enough to minimize T1 saturation effects. The sensitivity of DWI to water motion is determined by the b value (mm2/s), which reflects the influence of the diffusion sensitizing gradients and can be altered by changing gradient amplitude, gradient duration and time interval between the paired gradients[1,3]. For a meaningful interpretation, DWI needs to be performed using at least two b values: b = 0 mm2/s and b = 100 to 1000 mm2/s[1,3]. DWI performed with b = 0 mm2/s is a T2-weighted sequence. At lower b values (200 mm2/s or less), the calculated apparent diffusion coefficient (ADC) is influenced by tissue perfusion and water diffusivity. Increasing the b value over 200 mm2/s reduces the effect of perfusion.
QUALITATIVE ASSESSMENT OF DWI
DWI images can be qualitatively assessed by visual inspection. Water molecules with a large degree of motion (e.g., in blood vessels) have less signal attenuation (remain hyperintense or bright) at small b values (e.g., b = 50-100 mm2/s) and greater signal attenuation (become hypointense or dark) at large b values. Water molecules with slow and restricted (or impeded) motion (e.g., in certain tumors) have less signal attenuation (remain hyperintense or bright) at large b values (e.g., b = 500-1000 mm2/s). Overall, the higher the b value, the more sensitive the sequence is to diffusion effects. Higher b values (e.g., b = 1000) are also optimum for background signal suppression[1,3].
The relative change in DWI signal intensity at different b values can be used to characterize tissues on the basis of differences in water diffusion. For example, the cystic or necrotic fraction of a heterogeneous tumor will show greater signal attenuation (low signal intensity) on high b-value imaging than solid portions (high signal intensity). Thus, subjective visual assessment of the relative tissue signal changes on DWI using multiple b values may be useful for tumor detection, tumor characterization and assessment of treatment response[1]. However, observed DWI signal intensity depends not only on water diffusion, but also on T2 relaxation time (so-called “T2 shine-through” effect). “T2 shine-through” effect can result in high signal intensity on high b value DWI images without impeded diffusion. This may result in image interpretation errors, particularly if the ADC maps are not examined. ADC maps, which are actually a quantitative measure of tissue diffusivity, can also be visually inspected. Tissues with impeded diffusion appear hypointense on ADC maps/images, while they remain hyperintense on DWI. However, “T2 shine through” effect will result in a hyperintense signal in a tissue on both DWI as well as ADC maps. T2 shine through errors can also be reduced using a short TE and large b value, in addition to inspecting the ADC map[1].
CLINICAL APPLICATIONS
Computed tomography (CT) and conventional MRI are relatively insensitive to early treatment changes in the setting of malignancy. Common imaging biomarkers that suggest response to therapy, such as decreased tumor size and change in Hounsfield unit attenuation, often take weeks to months to become evident. DWI has been shown to be sensitive to the microenvironmental changes in tumors at the molecular level that result from treatment and, thus, may be able to predict early tumor response to chemotherapy or radiotherapy[3]. Specifically, this technique may be able to detect disintegration of the cell membrane with tumor lysis and increased extracellular space, resulting in increased diffusion of water and increased ADC values compared to pre-treatment values[1,7,8]. However, increased vascularity with associated increased perfusion, which may be significant in some tumors, also affects the DWI characteristics[1,9]. Therapies directed against the tumor vasculature may result in reduced ADC values, especially when DWI is performed using low b values, which are sensitive to vascular perfusion effects[1,10]. Within the first 24 h after initiating treatment, treatment effects may be observed due to cell swelling, with a resulting transient decrease in ADC value[1,10]. Tumors with low pretreatment ADC values have a tendency to respond better to chemotherapy and radiation therapy (e.g., colorectal carcinoma liver metastases[11] and rectal carcinoma[12,13]. Tumors with high pretreatment ADC values are likely to be more necrotic than those with low ADC values and these have diminished sensitivity to chemotherapy and radiation therapy as they are often poorly perfused and contain hypoxic and acidotic areas[1,11-13]. Increased ADC values (within 1 wk post-therapy) have been shown to precede the reduced tumor size[1,11-13].
DWI has also demonstrated the ability to detect recurrent disease earlier than conventional MRI and CT imaging[3]. DWI appears to be a useful adjunct for the detection of metastatic sites of neoplasm, including otherwise subtle and difficult to detect lesions on routine abdomen MRI examinations, both at the time of initial diagnosis and at follow-up after treatment as mentioned below in a separate section[3].
Liver
Regarding DWI of the liver, b values of 0-500 are usually adequate. Susceptibility artifact from gas within the stomach and colon and cardiac and respiratory motion artifacts are potential challenges to be overcome.
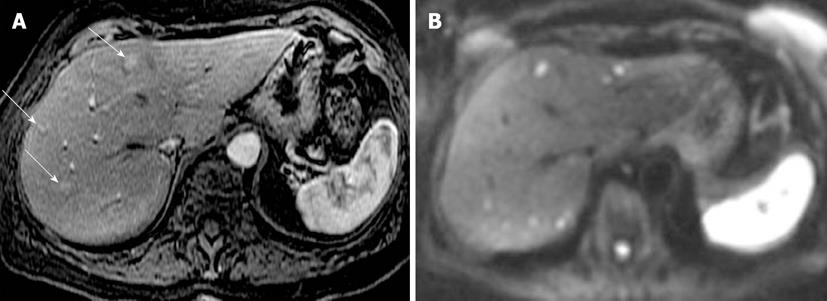
Tumors may impede diffusion because they are frequently hypercellular compared with the surrounding tissue from which they originate, making them appear relatively hyperintense on DWI. Thus, DWI can be useful for detecting liver metastases (Figure 1). In the liver, low b-value images (b≤ 150) suppress high signal from blood flow in hepatic vessels, resulting in “black blood” images that are useful for detecting lesions. Low-b-value DWI has been shown to be superior to both fat-suppressed T2-weighted and short tau inversion recovery (STIR) images in detecting focal liver lesions; this is especially true for metastatic lesions < 1 cm in size[4]. Nasu et al[14] found DWI to be more accurate than superparamagnetic iron oxide-enhanced MRI for detecting liver metastases. In fact, no significant difference existed in the performance of DWI compared with that of gadolinium-enhanced T1-weighted images on a per-lesion basis[4,14]. Many times, DWI actually increases the conspicuity of the lesions and may detect more lesions than seen on other pulse sequences (Figure 2). Hence, DWI may be a useful alternative sequence in patients with a contraindication to gadolinium.
Figure 1 Leiomyosarcoma metastasis to liver.
A: Axial fat-suppressed, T2-weighted (T2W) Fast Spin-Echo image; B: Post contrast T1-weighted gradient recalled-echo image; C: Diffusion-weighted imaging; D: Apparent diffusion coefficient (ADC) map. The T2W hyperintense and rim-enhancing lesion is a pathologically established metastasis (arrow) with an ADC value of 0.9 × 10⁻³ mm2/s, indicating impeded diffusion likely due to its highly cellular nature.
Figure 2 Neuroendocrine metastases to liver.
A: Axial arterial phase post contrast T1-weighted (T1W) gradient recalled-echo; B: Diffusion-weighted image (DWI). Only 3 enhancing metastatic lesions are seen on the post contrast T1W image. DWI increases conspicuity of these lesions and also shows many more bilobar high signal metastatic lesions with impeded diffusion.
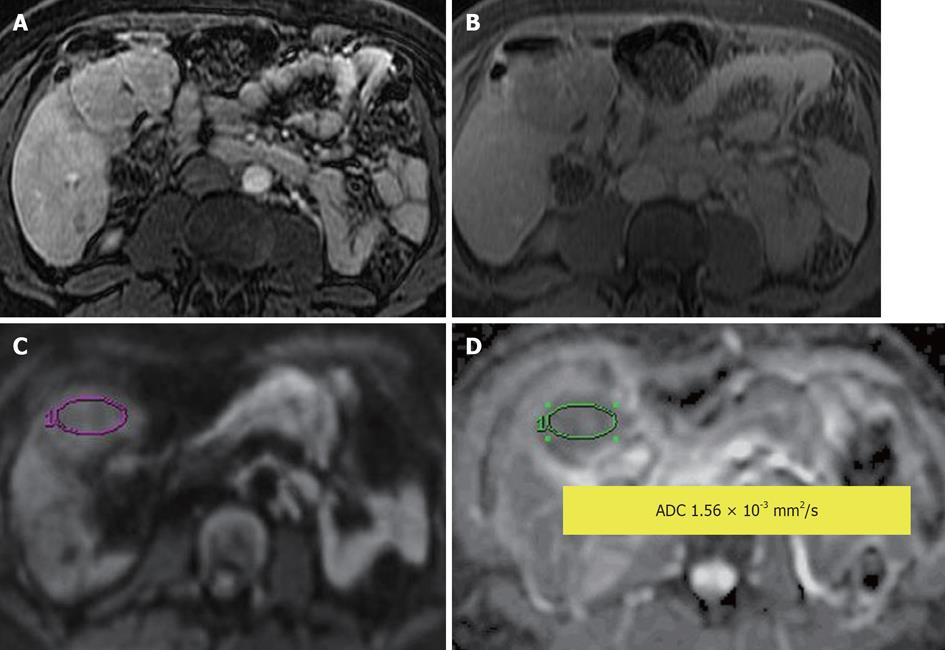
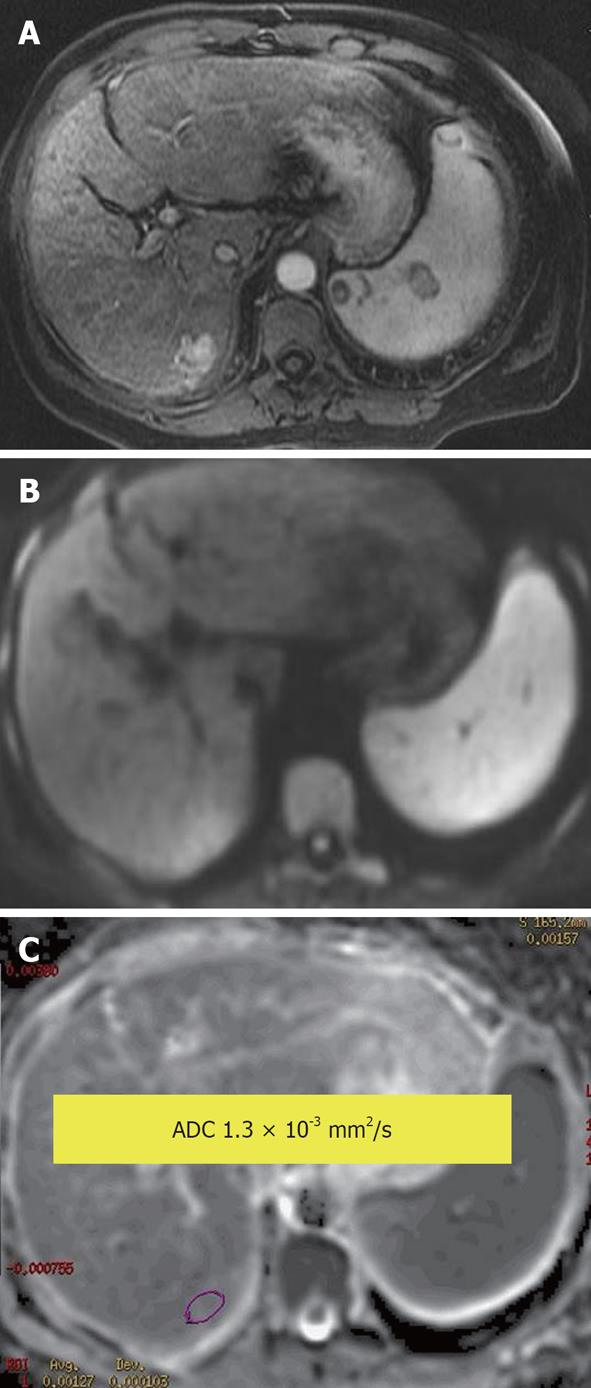
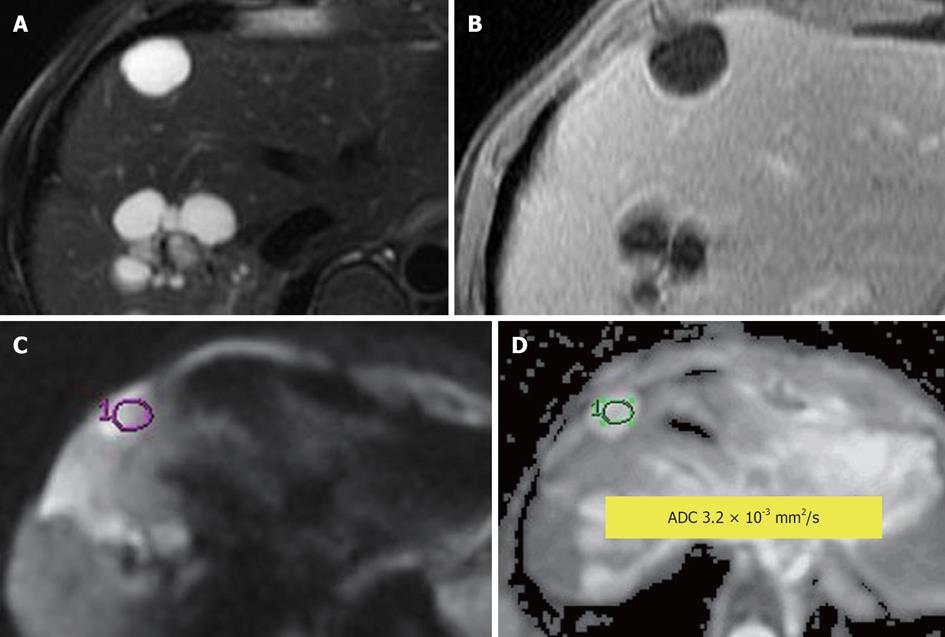
A qualitative (visual) assessment can distinguish between solid and cystic liver tumors but cannot differentiate among different types of solid lesions (Figures 1-7). Quantitative assessment of ADC values can differentiate some benign lesions (e.g., cysts and most hemangiomas) which have high ADC values (Figures 6 and 7) from certain malignant lesions [e.g., hepatocellular carcinoma (HCC) and metastases] which have low ADC values (Figures 1 and 4)[15].
Figure 3 Hepatocellular adenoma.
A: Contrast-enhanced T1-weighted gradient recalled-echo in arterial phase; B: Delayed post contrast phase; C: Diffusion-weighted image; D: Apparent diffusion coefficient (ADC) map. An arterial enhancing lesion with delayed wash out is visible; it demonstrates impeded diffusion with ADC = 1.56 × 10⁻³ mm2/s.
Figure 4 Hepatocellular carcinoma.
A: Enhanced arterial phase T1-weighted gradient recalled-echo; B: Diffusion-weighted image; C: Apparent diffusion coefficient (ADC) map. An arterial enhancing lesion with impeded diffusion and ADC = 1.3 × 10⁻³ mm2/s is visible.
Figure 5 Focal nodular hyperplasia.
A: Enhanced arterial phase; B: Venous phase T1-weighted gradient recalled-echo; C: Diffusion-weighted image; D: Apparent diffusion coefficient map (ADC). An arterial enhancing lesion which becomes isointense to slightly hyperintense to liver on venous phase and shows impeded diffusion with ADC of 1.3 × 10⁻³ mm2/s.
Figure 6 Simple hepatic cyst.
A: Fat-suppressed T2-weighted (T2W) Fast Spin-Echo; B: Enhanced T1-weighted gradient recalled-echo; C: Diffusion-weighted image; D: Apparent diffusion coefficient (ADC) map. A T2W hyperintense non-enhancing lesion consistent with a simple cyst with ADC = 3.2 × 10⁻³ mm2/s. No impeded diffusion is visible.
Figure 7 Cavernous hemangioma in the liver.
A: Fat-suppressed T2-weighted (T2W) Fast Spin-Echo; B: Enhanced (arterial phase) T1-weighted gradient recalled-echo; C: Diffusion-weighted image; D: Apparent diffusion coefficient map (ADC) map. A cavernous hemangioma with a typical T2W hyperintense signal and enhancement (peripheral discontinuous on arterial post contrast phase) characteristics and ADC = 1.6 × 10⁻³ mm2/s.
ADC values in hepatic abscesses are generally lower than those in cystic and necrotic metastases, with reported mean ADC values of 0.67 ± 0.35 × 10⁻³ mm2/s in hepatic abscesses, 2.65 ± 0.49 × 10⁻³ mm2/s in cystic and necrotic tumors, compared to mean ADC value of 1.98 ± 0.37 × 10⁻³ mm2/s in normal liver parenchyma[16]. Consequently, abscesses and some inflammatory lesions may mimic malignancy, based upon low ADC values and/or impeded diffusion (Figure 8).
Figure 8 Liver abscess in a patient with Crohn disease.
A: Axial post contrast T1-weighted gradient recalled-echo; B: Diffusion-weighted image image. Rim enhancing lesion is seen in the right hepatic lobe, with corresponding bright lesion on diffusion weighted image. The apparent diffusion coefficient map (not shown) showed corresponding hypointense lesion suggesting true impeded diffusion. This should not be confused with liver tumors which may also show impeded diffusion. Appropriate clinical settings should suggest the diagnosis. The lesion resolved with antibiotics on follow-up.
Considerable overlap (Figures 1-5 and 7) also exists in the ADC values of solid benign and malignant hepatic lesions. An increasing number of studies have evaluated the use of quantitative ADC measurements in liver lesions, but discrepancies in scan parameters lead to discrepancies in reported ADC values[3,17]. Hence, radiologists must interpret DWI in conjunction with other MRI pulse sequences, especially keeping in mind the pretest probability of an abnormality[3,4,18-20]. Overall, the limitation of the DWI sequence is predominantly lesion characterization rather than lesion detection. Although it has a significantly high overall detection rate for liver metastases, with excellent conspicuity, detection of left lobe lesions may be difficult because of image-degrading cardiac motion artifacts[3,21,22].
Lower pretreatment ADC values have been shown to be predictive of a good response to treatment in cases of liver metastases from colorectal and gastric origins[3,11,13]. High pretreatment ADC values may indicate poorly perfused necrotic regions in tumors, with the resulting poor delivery of chemotherapeutic agents to these areas[1,3,11]. Responding tumors show an increase in ADC values after treatment, whereas non-responding tumors and liver parenchyma show minimal change[3].
DWI may also be useful for assessing treatment response of HCC to locoregional therapies, such as radiofrequency ablation and chemoembolization[3,23]. Suspected areas of residual or recurrent tumor at ablation sites are usually seen as hyperintense foci on DWI, while the necrotic areas appear hypointense[3,23] (Figure 9). Recurrent tumors at the ablation site have been shown to have lower ADCs than the adjacent ablation zone and background normal liver parenchyma[3,23]. On the other hand, wide variability has been observed in ADC values (although higher than pretreatment value) of tumors after transarterial chemoembolization (TACE)[3,24,25]. After TACE, perilesional inflammation and arterial reperfusion of the perilesional atrophic area may lead to false positive ADCs, suggesting false tumor recurrence and hence affecting the accuracy of conventional MRI[3,24,25]. In cases of HCCs treated with angiogenesis-inhibiting agents, contrary results have been described than those expected, i.e., ADC values decrease rather than increase after treatment. This is likely due to ischemia and hemorrhage in the tumor, which can be associated with these agents[3,23]. In these cases, lower ADC values at 3 mo post-treatment have been shown to correlate well with HCC progression, as expected[3,23].
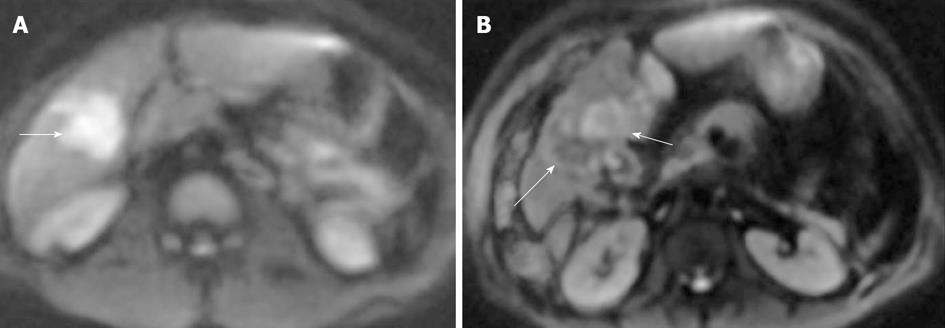
Figure 9 Hepatocellular carcinoma (arrows) on diffusion-weighted image (A) before and (B) after transarterial chemoembolization.
A: Hepatocellular carcinoma (HCC) was hyperintense compared with the cirrhotic liver on diffusion weighted image, with an apparent diffusion coefficient (ADC) = 1.41 × 10⁻³ mm2/s vs 1.08 × 10⁻³ mm2/s for the liver; B: After transarterial chemoembolization, HCC showed a residual area of hyperintense signal (short arrow) with ADC = 1.38 × 10⁻³ mm2/s (residual tumor) and a new area of hypointense signal (long arrow) with ADC = 1.87 × 10⁻³ mm2/s (coagulation necrosis), indicating a partial response. This finding of necrosis was supported by lack of enhancement on gadolinium-enhanced imaging and confirmed on follow-up studies.
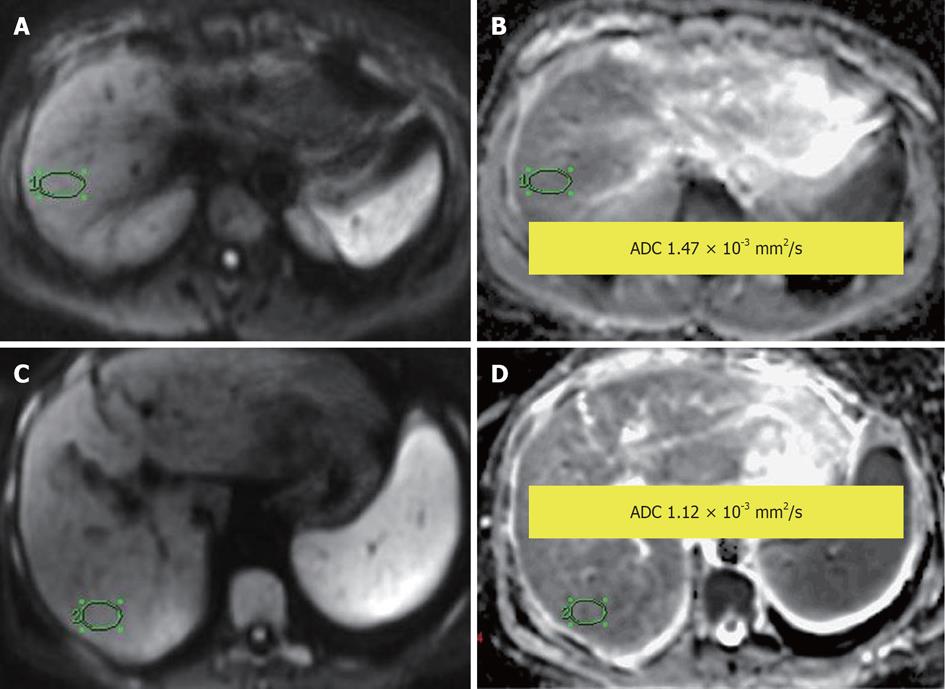
In diffuse hepatic diseases, chronic hepatitis and cirrhosis, lower ADCs are more often found in the liver parenchyma than in healthy livers[4] (Figure 10). In fact, the ADC values of cirrhotic livers can overlap with the ADC values of malignant liver lesions, affecting the reliability of DWI. Low ADC values are also seen in cases of nonalcoholic fatty disease and hepatic fibrosis. ADCs have been shown to be useful for differentiating severe hepatic fibrosis from mild or moderate fibrosis[4]. However, considerable overlap has been observed in ADC values, with varying degrees of fibrosis, inflammation and fatty changes; hence, DWI is still ancillary[4].
Figure 10 Normal liver parenchyma.
A, B: Diffusion-weighted image (DWI) (A) and apparent diffusion coefficient (ADC) map (B), showing ADC = 1.47 × 10⁻³ mm2/s; Liver cirrhosis: (C) DWI and (D) ADC map, showing ADC = 1.12 × 10⁻³ mm2/s.
Biliary tree
Gallbladder and biliary ducts have similar DWI features and ADCs to those of simple cysts because of their content. Few studies have been performed of DWI of the biliary tree. Sugita et al[26] found lower ADC values in gallbladder carcinoma, with a mean of 1.28 ± 0.41 × 10⁻³ mm2/s, than in control lesions, such as chronic cholecystitis, adenomyomatosis and polyps, which have a mean ADC of 1.92 ± 0.21 × 10⁻³ mm2/s. Cui et al[27] found that DWI has high diagnostic accuracy for detecting extrahepatic cholangiocarcinoma and DWI helped correctly diagnose cases of cholangitis and biliary stones from extrahepatic cholangiocarcinoma in their study[4,26,27]. For bile duct stones, ADC was 0.48 ± 0.22 × 10⁻³ mm2/s in contrast to ADC of 1.31 ± 0.29 × 10⁻³ mm2/s in cholangiocarcinoma[27]. Linear hyperintensity can be seen along the intrahepatic portal vein branches in cases of ascending cholangitis, with occasional abscesses also appearing hyperintense. High b value DWI may help to differentiate cholangitis which will lose signal, becoming relatively isointense to liver, vs the abscesses which will remain hyperintense, when compared to low b value DWI[4,26,27].
Pancreas
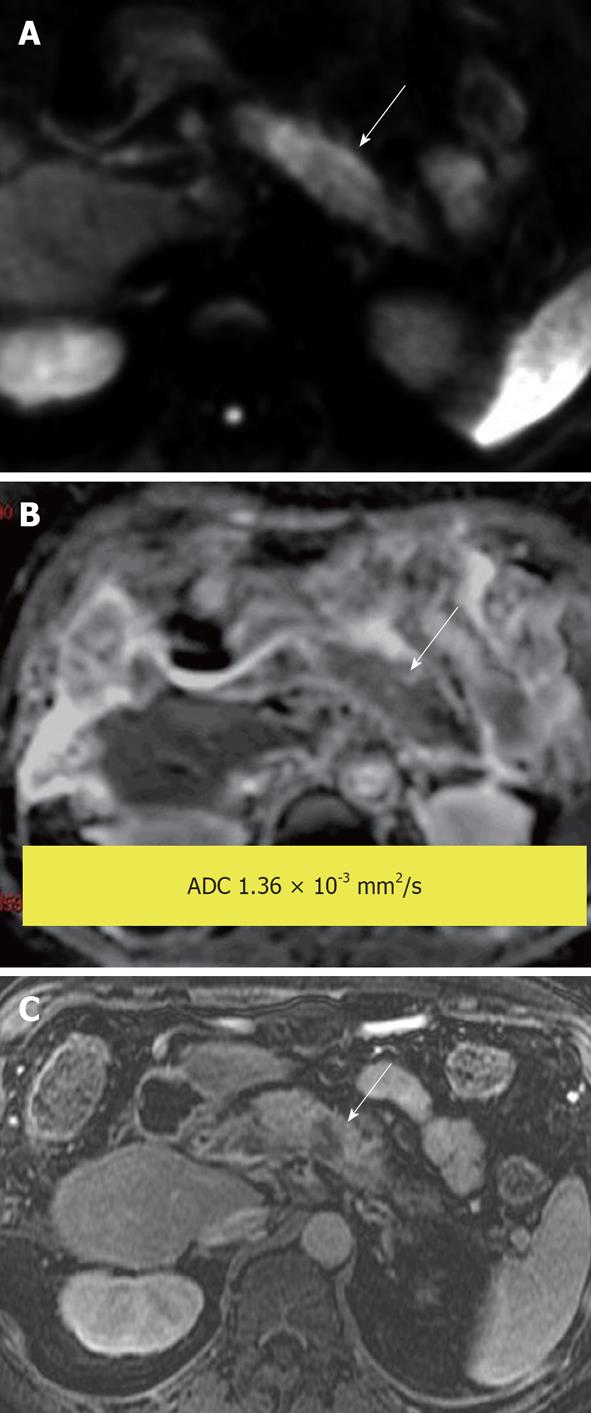
Normally, the head and body of the pancreas have higher ADC values than the tail. ADC measurements in pancreatic adenocarcinoma (Figure 11) are lower compared to normal pancreas[28-34], with a reported cut-off value of 1.4 × 10⁻³ mm2/s. ADC values have been shown to be useful for differentiating pancreatic malignancies from normal pancreatic tissue but not for differentiating malignancy from other benign or inflammatory lesions[4,28,29,33]. ADC values have also been used to differentiate between pancreatic adenocarcinoma and mass-forming pancreatitis. Mass-forming pancreatitis has either lower or higher ADC values than that in pancreatic carcinoma, but these follow the ADC values of remaining pancreatic parenchyma. On the contrary, ADC values in a focal pancreatic cancer are invariably lower than that of the rest of the pancreatic parenchyma[33,35]. DWI has been found to be comparable to conventional MRI for detection of neuroendocrine tumors and is particularly superior for detecting small (0.5-1 cm) and non-hypervascular lesions[4,36].
Figure 11 Pancreatic ductal adenocarcinoma.
Hyperintense mass demonstrated on (A) diffusion-weighted image due to impeded diffusion, confirmed by a hypointense signal on (B) apparent diffusion coefficient map. Findings are supported by a (C) post-gadolinium T1-weighted image that shows the tumor to be hypo enhancing compared with the enhancing pancreatic parenchyma.
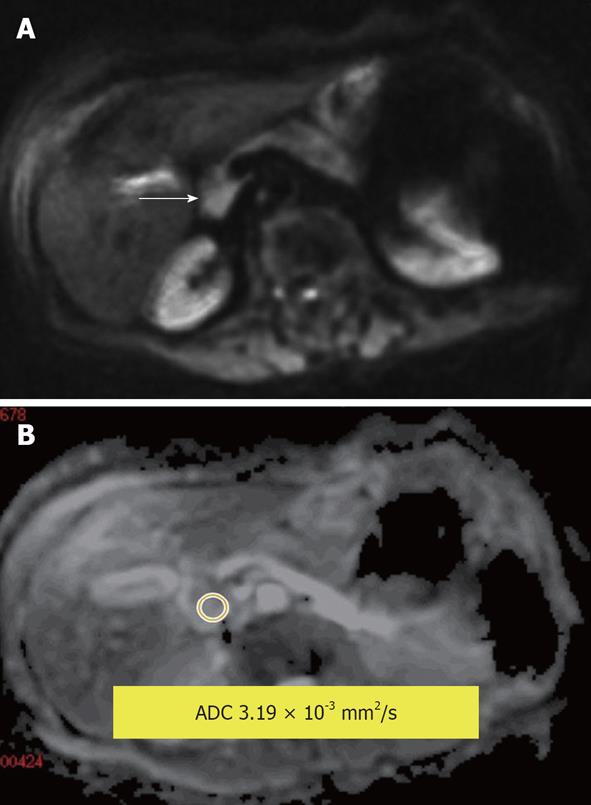
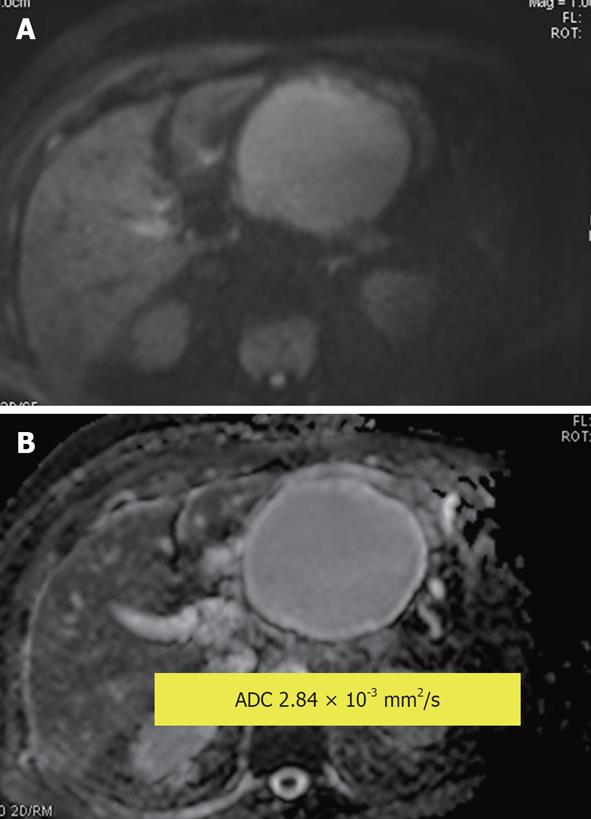
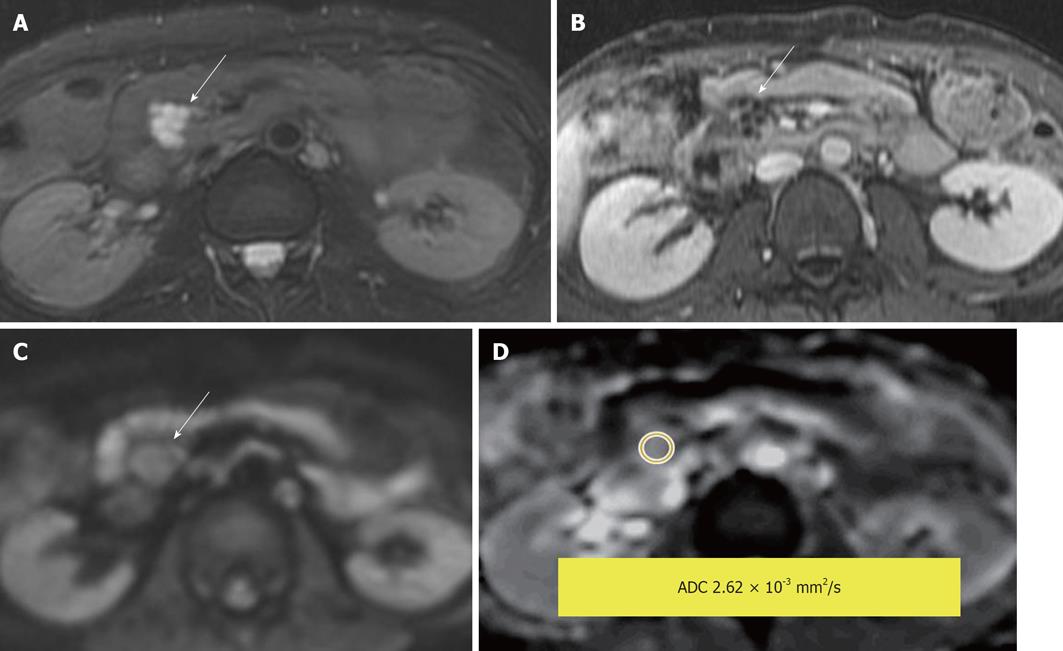
The few studies that have been performed to differentiate among cystic lesions of the pancreas (Figures 12-14) have shown controversial results, with overlapping ADC values between pseudocysts and mucinous neoplasms[4]. Acute pancreatitis has higher ADCs than normal parenchyma because of the increased diffusion of water that results from increased vascular permeability and edema[37]. Chronic pancreatitis has lower ADC values because of fibrosis and reduced exocrine function[37]. Autoimmune pancreatitis has lower ADCs than acute or chronic pancreatitis. These values can also be monitored to assess treatment response during corticosteroid therapy[4,38].
Figure 12 Serous cystadenoma in the pancreatic head.
A: Diffusion-weighted image; B: Apparent diffusion coefficient (ADC) map. Measured lesion ADC = 3.19 × 10⁻³ mm2/s. The internal reference can be used; the reference for the fluid in this study (cerebrospinal fluid) was ADC = 3.78 × 10⁻³ mm2/s.
Figure 13 Pancreatic pseudocyst.
A: Diffusion-weighted image (DWI); B: Apparent diffusion coefficient (ADC) map. Hyperintensity of the cyst on DWI is due to the T2 shine through effect. Measured lesion ADC = 2.84 × 10⁻³ mm2/s. The reference for the fluid in this study (cerebrospinal fluid) was ADC = 4.06 × 10⁻³ mm2/s.
Figure 14 Side branch intraductal papillary mucinous neoplasms.
A: Fat-saturated T2-weighted (T2W) Fast Spin-Echo; B: Post contrast T1-weighted gradient recalled-echo; C: Diffusion-weighted image; D: Apparent diffusion coefficient (ADC) map. A lobulated T2W hyperintense lesion with enhancement of the rim and internal septae. The measured lesion ADC = 2.62 × 10⁻³ mm2/s. The reference for fluid in this study (cerebrospinal fluid) was ADC = 3.36 × 10⁻³ mm2/s.
Kidneys
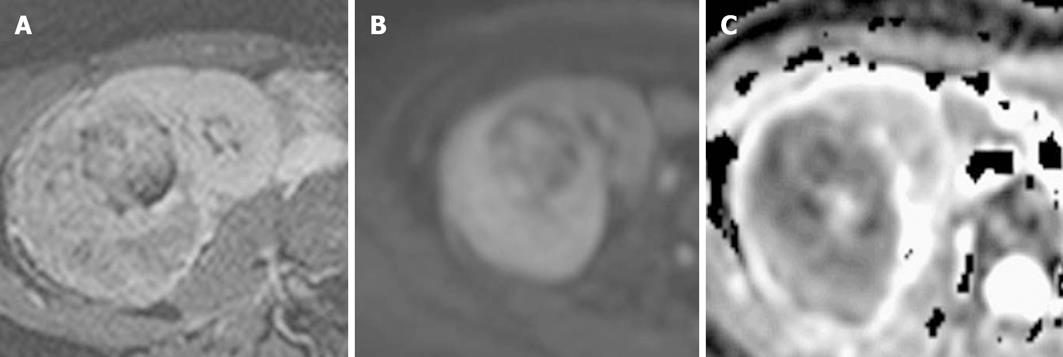
The normal renal cortex has higher ADC values than the medulla. DWI has been found to be useful in assessing diffuse as well as focal renal diseases, including evaluation of renal masses. Solid renal cell carcinomas (RCCs) have significantly lower ADC values (Figure 15) than simple or mildly complex cysts and oncocytomas[39,40]. Taouli et al[39] were able to differentiate between oncocytomas and RCC using an ADC cut-off of 1.66 × 10⁻³ mm2/s. Renal cysts have considerably higher ADCs than solid renal masses[39,40]. ADC values of renal cysts vary with internal cyst contents. For example, proteinaceous or hemorrhagic contents may have lower ADC values than simple cysts[4]. Cystic RCCs and benign hemorrhagic cysts may have overlapping ADC values and thus may not be differentiated. However, the ADC values in the solid portion of necrotic or cystic RCCs are usually lower. Abscesses show markedly impeded diffusion and decreased ADC values, as expected[39,40]. Non-clear cell RCCs usually have lower ADC values than clear cell RCCs[41]. This may be due to decreased perfusion in papillary (non-clear cell) RCCs, which are typically hypovascular compared with clear cell carcinomas. Angiomyolipomas have been shown to have lower ADC values than other renal masses, possibly because the muscle and fat components restrict diffusion[39,40].
Figure 15 Renal cell carcinoma.
(A) Heterogeneously enhancing mass on post contrast T1-weighted gradient recalled-echo image, demonstrating a high signal on (B) diffusion-weighted image and a low signal on (C) apparent diffusion coefficient, indicating impeded diffusion.
ADC values may also be useful for functionally assessing the kidneys, as reported in several studies. Lower ADC values of the renal parenchyma have been observed in acute and chronic renal failure, with the lowest ADC values in patients with chronic renal failure[42,43]. A relationship between ADC value and serum creatinine values was found in these cases. However, no relationship has been observed between ADCs and glomerular filtration rate. Low ADC values due to impeded diffusion have also been found in the affected portions of kidneys in pyelonephritis[4] and significantly lower ADC values s have been found in the kidneys of patients with renal arterial stenosis than in those of patients with normal renal arteries[44]. Similarly, significantly lower ADC values have been observed in the renal collecting systems of individuals with pyonephrosis when compared to uncomplicated hydronephrosis[45,46]. Hydronephrotic kidneys with moderate and severe decrease in renal function have much lower ADCs than hydronephrotic kidneys with normal function[45,46].
Adrenal glands
Normal adrenal glands have a high signal (hyperintense) on DWI with non-pathological impeded diffusion. Although pheochromocytomas have relatively higher ADC values than adrenocortical adenomas and malignancies[47], no diagnostic utility has been found for DWI/ADC values in differentiating between lipid-rich and lipid-poor adenomas and between benign and malignant nodules (or masses) (Figure 16). Cysts have higher ADC values than almost all other adrenal lesions, as generally expected[47,48].
Figure 16 Diffusion-weighted image and apparent diffusion coefficient map.
A: An adrenal mass with impeded diffusion and apparent diffusion coefficient (ADC) = 1.84 × 10⁻³ mm2/s; B: An adrenal mass with impeded diffusion and ADC = 1.47 × 10⁻³ mm2/s.
Spleen
Normal spleen, as well as accessory spleens and splenules, have the greatest degree of nonpathological impeded diffusion of all solid abdominal organs. Significantly elevated splenic ADC values may be observed in individuals with cirrhosis[4]. Ertan et al[49] suggested that higher ADC values in an enhancing splenic lesion indicates a vascular etiology. To our knowledge, no other data exist regarding DWI of splenic lesions[4,49].
Vascular thrombosis
Deep venous thrombosis is a relatively common and potentially life-threatening condition that accounts for almost all cases of pulmonary thromboembolism. Deep venous thrombosis has a multitude of causes, although most episodes relate to abnormal veins and venous stasis (e.g., due to varicose veins and associated venous insufficiency). Acute-subacute deep venous thrombi may demonstrate abnormal signal hyperintensity, similar to that observed in cerebral venous thrombosis[50].
Whole-body DWI
STIR EPI DWI with a b value of 1000 mm2/s can be useful for evaluating lymphadenopathy in patients with lymphoma and other cancers as highly cellular lymph nodes can be seen well as foci of hyperintense signal on DWI. However, because DWI detects abnormalities on the basis of tissue cellularity, not all detected abnormalities are necessarily malignant as normal lymph nodes or some benign lesions are also cellular, impeding diffusion[1,51]. Small and otherwise difficult to visualize abdominopelvic tumors involving peritoneal, omental and mesenteric surfaces may also be well visualized on DWI because of impeded diffusion, resulting in high signal on DWI against suppressed background signal (Figure 17)[1,51]. Whole-body DWI may also be useful for staging a variety of malignant tumors[52]. It is possible that whole-body DWI could perform similarly to positron emission tomography imaging, although further research is needed to determine its utility.
Figure 17 Peritoneal metastases on diffusion-weighted image.
A: Due to ascites, peritoneal nodules are not well seen on b = 0 sequence of diffusion-weighted image; B: But, on b = 500, all the ascites is suppressed and peritoneal nodules/metastases become conspicious (arrows).


