Published online Mar 28, 2018. doi: 10.4329/wjr.v10.i3.24
Peer-review started: February 10, 2018
First decision: March 12, 2018
Revised: March 14, 2018
Accepted: March 19, 2018
Article in press: March 20, 2018
Published online: March 28, 2018
Processing time: 46 Days and 14.3 Hours
To examine effects of computed tomography (CT) image acquisition/reconstruction parameters on clot volume quantification in vitro for research method validation purposes.
This study was performed in conformance with HIPAA and IRB Regulations (March 2015-November 2016). A ten blood clot phantom was designed and scanned on a dual-energy CT scanner (SOMATOM Force, Siemens Healthcare GmBH, Erlangen, Germany) with varying pitch, iterative reconstruction, energy level and slice thickness. A range of clot and tube sizes were used in an attempt to replicate in vivo emboli found within central and segmental branches of the pulmonary arteries in patients with pulmonary emboli. Clot volume was the measured parameter and was analyzed by a single image analyst using a semi-automated region growing algorithm implemented in the FDA-approved Siemens syngo.via image analysis platform. Mixed model analysis was performed on the data.
On the acquisition side, the continuous factor of energy showed no statistically significant effect on absolute clot volume quantification (P = 0.9898). On the other hand, when considering the fixed factor of pitch, there were statistically significant differences in clot volume quantification (P < 0.0001). On the reconstruction side, with the continuous factor of reconstruction slice thickness no statistically significant effect on absolute clot volume quantification was demonstrated (P = 0.4500). Also on the reconstruction side, with the fixed factor of using iterative reconstructions there was also no statistically significant effect on absolute clot volume quantification (P = 0.3011). In addition, there was excellent R2 correlation between the scale-measured mass of the clots both with respect to the CT measured volumes and with respect to volumes measure by the water displacement method.
Aside from varying pitch, changing CT acquisition parameters and using iterative reconstructions had no significant impact on clot volume quantification with a semi-automated region growing algorithm.
Core tip: This in vitro study showed that with the exception of pitch, varying the computed tomography pulmonary angiography image acquisition parameters and using iterative reconstructions had no significant impact on clot volume quantification when using a semi-automated region growing algorithm. This finding is applicable to validating core lab analysis in multicenter clinical trials with imaging endpoints, where a wide range of acquisition and reconstruction parameters are used.
- Citation: Kaufman AE, Pruzan AN, Hsu C, Ramachandran S, Jacobi A, Fayad ZA, Mani V. Effect of varying computed tomography acquisition and reconstruction parameters on semi-automated clot volume quantification. World J Radiol 2018; 10(3): 24-29
- URL: https://www.wjgnet.com/1949-8470/full/v10/i3/24.htm
- DOI: https://dx.doi.org/10.4329/wjr.v10.i3.24
Pulmonary embolism (PE) occurs in greater than one third of patients with deep venous thrombosis, and together the two disease states are termed venous thromboembolism[1]. In the United States, venous thromboembolism occurs with an average annual incidence of greater than 275000 among white people of predominantly European ancestry and African Americans combined[2]. With its high mortality rate, PE represents the most significant sequela of deep venous thrombosis[3,4].
In clinical practice, computed tomography (CT) Pulmonary Angiography (CTPA) is commonly performed as it has been shown to help with risk stratification of PE[5-7] . Clot burden is not used as a diagnostic or prognostic tool in clinical practice. However, quantification of clot burden is used in research to assess the efficacy, potency and optimal duration of pharmaceuticals such as thrombolytics[8].
In vivo quantification of clot burden can be performed using CTPA and segmenting the non-enhanced thrombus using semi-automated region growing algorithms[9]. The effects of various imaging parameters both on the CT acquisition side (energy, pitch) as well as reconstruction side (slice thickness, iterative reconstruction) on the quantification of pulmonary embolism measurements have not been studied extensively. Thus, the purpose of this study is to examine the effects of varying CT image acquisition and reconstruction parameters on the quantification of clot volumes in vitro with the goal of solidifying this method as a means of measuring in vivo thrombus volume in PE. This study has not been performed for clinical diagnostic or primary therapeutic purposes, but rather the sole intention of this study is for research purposes where clot burden and its change over time are utilized as endpoints in clinical drug trials. There is value in determining this because in multicenter clinical trials involving imaging endpoints there can be great variability in methods of acquisition and reconstruction. The overall objective is to confirm viability of this method in multicenter clinical pharmaceutical trials where site-to-site variability in parameters is common.
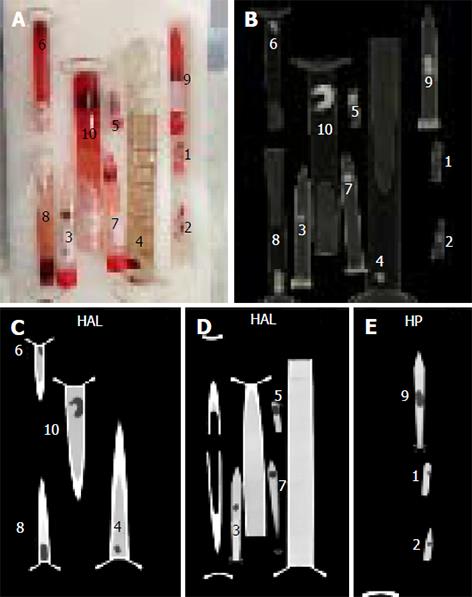
Ten clots of varying sizes were created in test tubes by allowing venous blood to coagulate by exposure to air. The purpose of making ten clots was to replicate various sized emboli found in vivo. Each clot was weighed on a laboratory precision scale and assessed for volume using the water displacement method and graduated cylinders. The clots were imaged in Falcon tubes and test tubes of varying diameters filled with a diluted solution of Isovue 370 (1:25 volume in saline to simulate typical Hounsfield units of blood in pulmonary arteries after injection of iodinated contrast in a CTPA scan). All 10 clots in the tubes were scanned simultaneously on a Siemens Force dual energy CT scanner (SOMATOM Force, Siemens Healthcare GmBH, Erlangen, Germany) using various image acquisition and reconstruction parameters. Figure 1 shows an image of the clots in the tubes and corresponding sample CT and Table 1 demonstrates details of the acquisition and reconstruction parameters.
| Energy (kVp) | Pitch | Slice thickness (mm) | Recon kernel | ADMIRE |
| 80 | 0.6 | 0.6 | Bv36 | On |
| 90 | 0.9 | 1 | Off | |
| 100 | 1.2 | 1.5 | ||
| 110 | 2 | |||
| 120 |
Analyst 1 (AEK, a board certified diagnostic radiologist with six years clinical experience) identified the 10 individual clots within their respective tubes within each of the 120 acquisitions. The clot volume was the measured parameter. Each clot was analyzed using a semi-automated region growing algorithm implemented in the FDA approved Siemens syngo.via image analysis platform. This region growing algorithm is similar to what has been used in previous studies for quantification of PE clot volume[9] and is also based on the methods shown in the following papers[10-12]. A total of 1200 volume measurements were made. The results of the volume water displacement method (with an average of 5 measurements per clot) were used as the gold standard comparison with the CT volume data.
A mixed model statistical method was used to analyze the in vitro data. The discrete factors were pitch (0.6, 0.9, 1.2) and the Siemens Advanced Modeled Iterative Reconstruction known as ADMIRE (Yes/No). The energy level in kVp (80, 90, 100, 110, 120) and slice thickness in millimeters (0.6, 1, 1.5, 2) were set as continuous factors. The volume of the clots themselves was set as a random factor.
Analysis of the in vitro study was performed using SAS/STAT software, Version 9 of the SAS System for Windows. ©2013, SAS Institute Inc. SAS and all other SAS Institute Inc. product or service names are registered trademarks or trademarks of SAS Institute Inc., Cary, NC, United States. All plots were drawn using GraphPad Prism 7 for Mac, GraphPad Software, San Diego California, United States, http://www.graphpad.com.
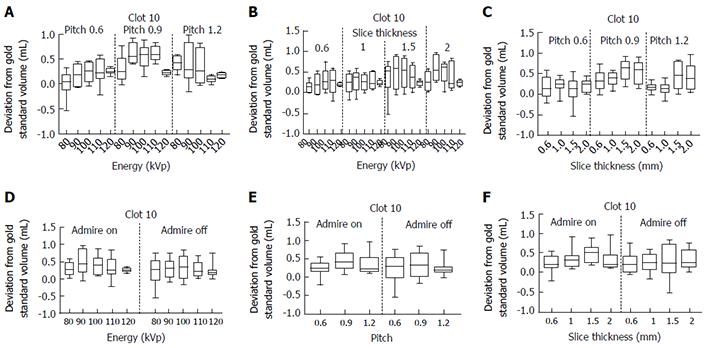
Analysis of Clot 10 is shown as an example in Figure 2 which illustrates the effects of the varying acquisition and reconstruction parameters on quantification of clot volume. In each graph displayed, the y-axis shows the difference between the measured volume and the gold standard volume for Clot 10. The x-axis shows the effect of varying the following: (1) Energy/pitch; (2) energy/slice thickness; (3) slice thickness/pitch; (4) energy/ADMIRE; (5) pitch/ADMIRE; and (6) slice thickness/ADMIRE respectively. The complete analysis of all ten clots is available in supplementary figures 1-6.
Overall statistical analysis of the raw clot volume data revealed no statistical significance among the levels for the fixed factor of ADMIRE (P = 0.3011) nor for the continuous factors of energy (P = 0.9898) and slice thickness (P = 0.4500). There was, however, statistical significance found among the levels for the fixed factor of pitch (P < 0.0001).
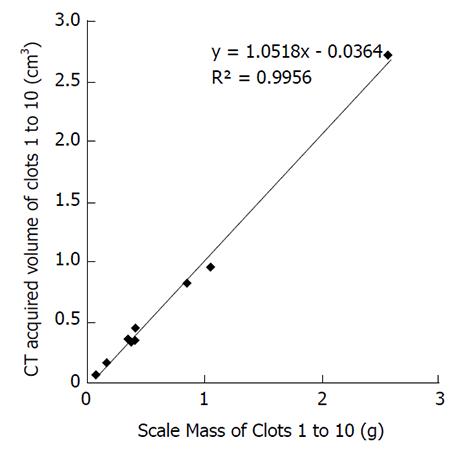
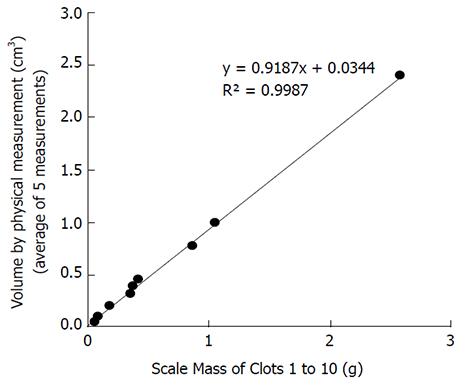
The correlation between the independent measurements of the mass of the clots in grams vs the mean CT acquired volumes in cubic centimeters appears in Figure 3 with an excellent R2 correlation value of 0.9956. Additionally, the correlation between the independent measurements of the mass of the clots in grams vs the volume by physical measurements in cubic centimeters (average of 5 measurements) appears in Figure 4 with an excellent R2 correlation value of 0.9987.
In this in vitro study, we assessed the effect of a variety of image acquisition and reconstruction parameters on volumetric measurements using a phantom of ten separate blood clots. We used a range of clot and tube sizes in an attempt to replicate in vivo emboli found within central and segmental branches of the pulmonary arteries. The results of our in vitro phantom study showed that varying the parameters of slice thickness, energy and ADMIRE caused no statistically significant differences in measured volumes for all clots in the raw data analysis. However, varying the pitch demonstrated statistical significance, specifically that volumes provided higher estimates for pitch = 0.9 compared to pitch = 0.6 or 1.2. Although this may relate to limitations in the accuracy of our gold standard, it is recommended to give protocol guidance to sites to insure accuracy and repeatability in embolus volume measurements.
Radiation dose (tube current-time product in milliampere seconds) is also inversely related to the pitch. This may indicate that changing the tube current and/or using dose modulation may also have an effect on the quantification of thrombus volume. This effect was however not explicitly tested and is one of the limitations of our study[12]. With a thorough search of PubMed (using key words pulmonary; emboli; PE; impact; energy; kV; CT; volume; quantification; measurement; reconstruction; density; iterative; angio; effect; Hounsfield; scan) looking at the impact of scan and reconstruction settings as they relate to pulmonary emboli, there was one study of note performed by Ogden et al[13] which showed that varying the strength of iterative reconstruction causes very little measurable effect on density measurement values for varying concentrations of iodine regardless of beam energy. This is applicable to the present study as the semi-automated region growing algorithm in Siemens syngo.via image analysis platform creates volumetric masks using region growing based on density measurement values.
Aside from the pitch setting, the in vitro study showed no significant impact on clot volume quantification. This result indicates that measurement of clot volumes using semi-automated analysis may be robust across a range of image acquisition and reconstruction parameters that may typically be used at various imaging centers in a multicenter study with adequate control for pitch.
Our study showed reasonable correlation of actual clot weights vs volumes measured using CT derived values with R2 = 0.9956 (Figure 3) and independently using the gold standard with R2 = 0.9987 (Figure 4). It should be noted however that the displacement method for measuring clot volumes in vitro is challenging and subject to errors of measurement. Additionally, we compared the individual clot volumes with the mean of the total CT acquired clot volumes for each clot in supplementary figures 7-12. In this scenario, none of the imaging parameters including pitch showed any significant effect on volumetric quantification further strengthening the possibility that the results for pitch being a factor in volume quantification could be due to inaccurate gold standard clot volume measurements.
Limitations of the study included the failure to use a “human thorax” phantom, which would have introduced a varying degree of scatter radiation that would have possibly affected the images and thus measurement accuracy. An additional limitation involves some degree of imprecision of the water displacement volume analysis of the 10 clots. Also, although we applied multiple variables including energy, pitch and reconstruction methods and used a range of clot sizes, other variables were not included such as additional reconstruction methods.
In conclusion, the in vitro data showed that with the exception of pitch, varying the CTPA image acquisition parameters and using iterative reconstructions had no significant impact on clot volume quantification.
Pulmonary embolism is a common and serious medical problem often evaluated using computed tomography (CT) pulmonary angiography. In the clinical setting the disease course is not followed by embolic volume measurements; however in clinical pharmaceutical trials, measuring embolic load is useful to assess for drug efficacy, potency and optimal duration of treatment. Volume measurements can be made using semi-automated region-growing techniques and the goal of this study was to assess the accuracy of these measurements.
Our Core Research Imaging Lab group specializes in cardiovascular disease. Frequently we analyze data coming from multiple outside radiology centers where imaging protocols often vary from one site to another. To assess the validity of region growing volume measurements in CT pulmonary angiography, we devised this study to assess for significant differences in results with changes in acquisition and reconstruction of images that often occur in multicenter studies such as the ones in which we participate.
The overall goal was to validate the imaging assessment methods used in multicenter clinical trials evaluating treatment options for pulmonary embolism using CT angiography.
In this study ten blood clots were made and each clot was weighed on a laboratory precision scale and assessed for volume (the gold standard) using the water displacement method in graduated cylinders. Volume measurements were made on CT images of the blood clots in test tubes. The CT images were obtained with varying acquisition and reconstruction parameters and the clots were placed in diluted contrast material to simulate pulmonary emboli as they would appear in a CT angiogram. A single image analyst made the measurements using a semi-automated region growing algorithm using FDA-approved Siemens syngo.via image analysis platform. A mixed model statistical analysis was performed on the data.
Overall the study showed that varying the image acquisition parameters and using iterative reconstructions had no significant impact on clot volume measurements with, however, the exception of pitch.
The new findings of this study are that varying the image acquisition parameters and reconstructions did not have a significant impact on clot volume measurements, with the exception of pitch. In terms of pitch, pitch = 0.9 yielded higher volume measurements than with pitch = 0.6 or 1.2. This could be due to limitations in the accuracy of our gold standard, yet it is recommended to give pitch protocol guidance to sites for accuracy and repeatability in volume measurements. The present study confirms and validates research methods currently in use. The study found that using data acquired in the multicenter setting is viable for volume assessment of pulmonary emboli in pharmaceuticals research and thus, has an important impact on the development of therapies for this common and severe medical problem.
Our findings indicate that care must be taken when evaluating data from multiple centers while evaluating thrombus volume in pulmonary embolism and appropriate corrections made for differences in acquisition and reconstruction across the multiple sites. Future research can evaluate more imaging parameters such as tube current used for its role on pulmonary embolism thrombus volume quantification.
Manuscript source: Invited manuscript
Specialty type: Radiology, nuclear medicine and medical imaging
Country of origin: United States
Peer-review report classification
Grade A (Excellent): 0
Grade B (Very good): B
Grade C (Good): 0
Grade D (Fair): 0
Grade E (Poor): 0
P- Reviewer: Said AM S- Editor: Cui LJ L- Editor: A E- Editor: Li D
| 1. | Giordano NJ, Jansson PS, Young MN, Hagan KA, Kabrhel C. Epidemiology, Pathophysiology, Stratification, and Natural History of Pulmonary Embolism. Tech Vasc Interv Radiol. 2017;20:135-140. [RCA] [PubMed] [DOI] [Full Text] [Cited by in Crossref: 54] [Cited by in RCA: 77] [Article Influence: 9.6] [Reference Citation Analysis (0)] |
| 2. | Heit JA. Venous thromboembolism: disease burden, outcomes and risk factors. J Thromb Haemost. 2005;3:1611-1617. [RCA] [PubMed] [DOI] [Full Text] [Cited by in Crossref: 322] [Cited by in RCA: 326] [Article Influence: 16.3] [Reference Citation Analysis (0)] |
| 3. | Laporte S, Mismetti P, Décousus H, Uresandi F, Otero R, Lobo JL, Monreal M; RIETE Investigators. Clinical predictors for fatal pulmonary embolism in 15,520 patients with venous thromboembolism: findings from the Registro Informatizado de la Enfermedad TromboEmbolica venosa (RIETE) Registry. Circulation. 2008;117:1711-1716. [RCA] [PubMed] [DOI] [Full Text] [Cited by in Crossref: 455] [Cited by in RCA: 481] [Article Influence: 28.3] [Reference Citation Analysis (0)] |
| 4. | Heit JA, Silverstein MD, Mohr DN, Petterson TM, O’Fallon WM, Melton LJ 3rd. Predictors of survival after deep vein thrombosis and pulmonary embolism: a population-based, cohort study. Arch Intern Med. 1999;159:445-453. [RCA] [PubMed] [DOI] [Full Text] [Cited by in Crossref: 506] [Cited by in RCA: 488] [Article Influence: 18.8] [Reference Citation Analysis (0)] |
| 5. | Hariharan P, Dudzinski DM, Rosovsky R, Haddad F, MacMahon P, Parry B, Chang Y, Kabrhel C. Relation Among Clot Burden, Right-Sided Heart Strain, and Adverse Events After Acute Pulmonary Embolism. Am J Cardiol. 2016;118:1568-1573. [RCA] [PubMed] [DOI] [Full Text] [Cited by in Crossref: 22] [Cited by in RCA: 28] [Article Influence: 3.1] [Reference Citation Analysis (0)] |
| 6. | Meinel FG, Nance JW Jr, Schoepf UJ, Hoffmann VS, Thierfelder KM, Costello P, Goldhaber SZ, Bamberg F. Predictive Value of Computed Tomography in Acute Pulmonary Embolism: Systematic Review and Meta-analysis. Am J Med. 2015;128:747-59.e2. [RCA] [PubMed] [DOI] [Full Text] [Cited by in Crossref: 162] [Cited by in RCA: 221] [Article Influence: 22.1] [Reference Citation Analysis (0)] |
| 7. | Vedovati MC, Becattini C, Agnelli G, Kamphuisen PW, Masotti L, Pruszczyk P, Casazza F, Salvi A, Grifoni S, Carugati A. Multidetector CT scan for acute pulmonary embolism: embolic burden and clinical outcome. Chest. 2012;142:1417-1424. [RCA] [PubMed] [DOI] [Full Text] [Cited by in Crossref: 68] [Cited by in RCA: 82] [Article Influence: 6.8] [Reference Citation Analysis (0)] |
| 8. | Aghayev A, Furlan A, Patil A, Gumus S, Jeon KN, Park B, Bae KT. The rate of resolution of clot burden measured by pulmonary CT angiography in patients with acute pulmonary embolism. AJR Am J Roentgenol. 2013;200:791-797. [RCA] [PubMed] [DOI] [Full Text] [Cited by in Crossref: 25] [Cited by in RCA: 36] [Article Influence: 3.0] [Reference Citation Analysis (0)] |
| 9. | Furlan A, Patil A, Park B, Chang CC, Roberts MS, Bae KT. Accuracy and reproducibility of blood clot burden quantification with pulmonary CT angiography. AJR Am J Roentgenol. 2011;196:516-523. [RCA] [PubMed] [DOI] [Full Text] [Cited by in Crossref: 16] [Cited by in RCA: 15] [Article Influence: 1.1] [Reference Citation Analysis (0)] |
| 10. | Belongie S, Carson C, Greenspan H, Malik J. Color- and texture-based image segmentation using EM and its application to content-based image retrieval. 1998;675-682. [DOI] [Full Text] |
| 11. | Boser BE, Guyon IM, Vapnik VN. A training algorithm for optimal margin classifiers. In: Proceedings of the fifth annual workshop on Computational learning theory- COLT ’92; 1992; ACM Press; 1992: 144-152. [DOI] [Full Text] |
| 12. | Primak AN, McCollough CH, Bruesewitz MR, Zhang J, Fletcher JG. Relationship between noise, dose, and pitch in cardiac multi-detector row CT. Radiographics. 2006;26:1785-1794. [RCA] [PubMed] [DOI] [Full Text] [Cited by in Crossref: 141] [Cited by in RCA: 124] [Article Influence: 6.5] [Reference Citation Analysis (0)] |
| 13. | Ogden K, Greene-Donnelly K, Vallabhaneni D, Scalzetti E. The Effect of Iterative Reconstruction and CT Tube Voltage on Hounsfield Unit Values of Iodinated Contrast. Med Phys. 2016;43:3658-3658. [RCA] [DOI] [Full Text] [Cited by in Crossref: 1] [Cited by in RCA: 1] [Article Influence: 0.1] [Reference Citation Analysis (0)] |


