Copyright
©The Author(s) 2017.
World J Radiol. Sep 28, 2017; 9(9): 365-370
Published online Sep 28, 2017. doi: 10.4329/wjr.v9.i9.365
Published online Sep 28, 2017. doi: 10.4329/wjr.v9.i9.365
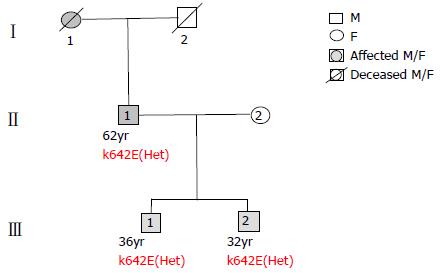
Figure 1 Pedigree of the family shows vertical transmission of KIT exon 13 c.
1924A>G (p.Lys642Glu; p.K642E) mutation. Het: Heterozygous.
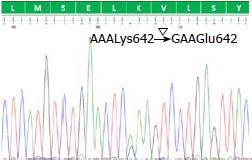
Figure 2 Electropherogram shows exon 13 c.
1924A>G missense mutation leading to a change of lysine at position 642 to glutamine (p.Lys642Glu; p.K642E) (dbSNP: 121913512) of KIT gene at heterozygote state in three affected family members.
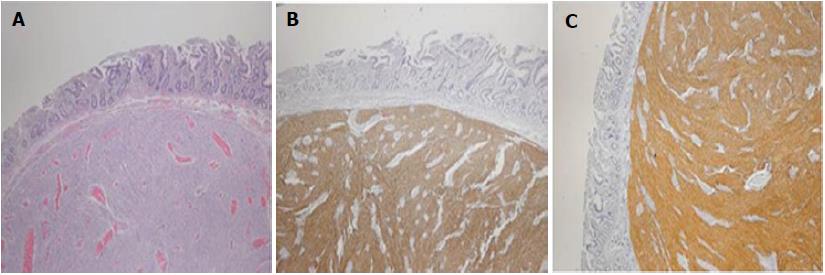
Figure 3 Microscopic findings of gastrointestinal stromal tumor located in the proximal jejunum.
Hematoxylin and Eosin staining revealed spindle cells in small bowel submucosa and wall (A). Immunohistochemistry for DOG1 (B) and c-KIT (C) showed immun activity in the tumor cell (original magnification: A, B and C, 40 ×).
Figure 4 18F-fluorodeoxyglucose positron emission tomography-computerized tomography scans of the gastrointestinal stromal tumors recurrence.
Serial 18F-FDG PET-CT scans showed submucosal, solid lesions in jejunum (SUVmax: 1.68-1.50) (A, B) and ileum (SUVmax: 4.69) (C) with maximum 2 cm in diameter, consisted with GIST recurrence on the follow-up (arrows). 18F-FDG: 18F-fluorodeoxyglucose; PET-CT: Positron emission tomography-computerized tomography; GIST: Gastrointestinal stromal tumors.
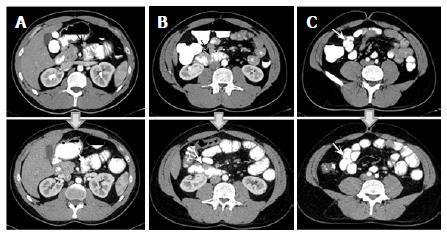
Figure 5 Imatinib response evaluation of the gastrointestinal stromal tumors using contrast-enhanced abdominal computerized tomography.
Pre- and post-treatment CT images are shown on upper and lower series respectively. A partial response is seen in jejunal (A, B) and ileal (C) GISTs in the following 3 mo after imatinib therapy (arrows). CT: Computerized tomography; GIST: Gastrointestinal stromal tumors.
- Citation: Engin G, Eraslan S, Kayserili H, Kapran Y, Akman H, Akyuz A, Aykan NF. Imatinib response of gastrointestinal stromal tumor patients with germline mutation on KIT exon 13: A family report. World J Radiol 2017; 9(9): 365-370
- URL: https://www.wjgnet.com/1949-8470/full/v9/i9/365.htm
- DOI: https://dx.doi.org/10.4329/wjr.v9.i9.365


