Copyright
©The Author(s) 2017.
World J Radiol. Aug 28, 2017; 9(8): 330-338
Published online Aug 28, 2017. doi: 10.4329/wjr.v9.i8.330
Published online Aug 28, 2017. doi: 10.4329/wjr.v9.i8.330
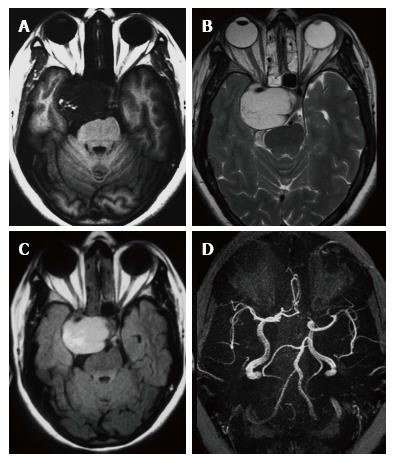
Figure 1 T1 weighted image, T2 weighted image and fluid-attenuated inversion recovery imaging images.
A: Axial MRI image shows well defined lobulated hypointense mass on T1-W sequence image in the right cavernous sinus; B: Homogeneous hyperintensity of the mass is noted in the T2-W axial image; C: T2-W FLAIR axial image demonstrates marked hyperintense signal of the lesion; D: MRA reveals laterally stretched and displaced cavernous carotid segment. T1-W: T1 weighted image; T2-W: T2 weighted image; FLAIR: Fluid attenuated inversion recovery; MRI: Magnetic resonance imaging; MRA: Magnetic resonance angiography.
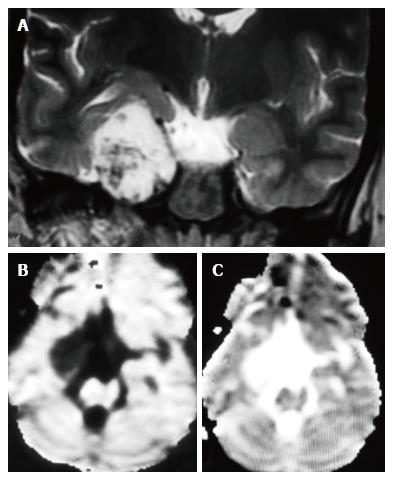
Figure 2 T2 weighted image coronal, diffusion-weighted imaging and apparent diffusion coefficient map images.
A: T2-W coronal image demonstrates multiple flow voids within the CSH in the right cavernous sinus; B: DWI image shows hypointense signal on diffusion-weighted map (B) and corresponding hyperintensity on ADC maps (C) suggestive of facilitated diffusion. T2-W: T2 weighted image; CSH: Cavernous sinus hemangioma; DWI: Diffusion-weighted imaging; ADC: Apparent diffusion coefficient.
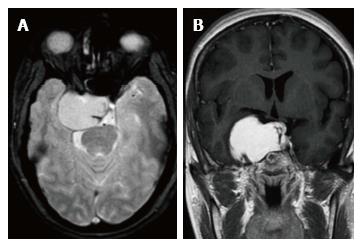
Figure 3 Axial gradient recalled echo and contrast enhanced T1 weighted image axial magnetic resonance images.
A: Axial gradient recalled echo sequence does not show any blooming; B: Contrast enhanced coronal T1 weighted image shows intensely enhancing lesion encasing the internal carotid artery.
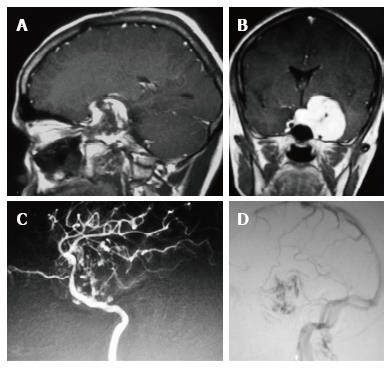
Figure 4 Contrast enhanced sagittal and coronal T1 weighted images and lateral views of digital subtraction angiography arterial and venous phases of left internal carotid angiogram.
A, B: Centripetal filling of the CSH in the left cavernous sinus is demonstrated; C: Arterial phase of DSA shows diffuse irregularity and stretching of C3 to C5 segments; D: Venous phase shows stasis in the venous channels within the CSH. CSH: Cavernous sinus hemangioma; DSA: Digital subtraction angiography.
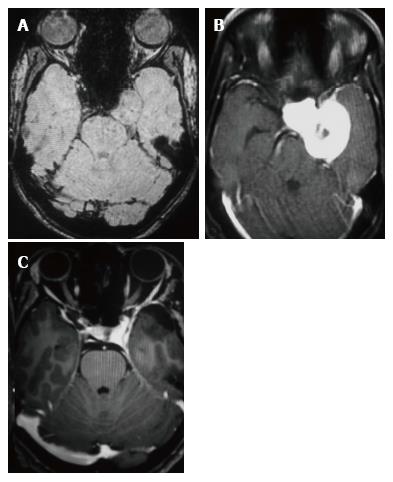
Figure 5 Contrast enhanced axial, susceptibility weighted imaging and 2 years follow up axial CE images.
A: SWI axial image shows isointense signal of the CSH; B: Contrast enhanced axial T1-W image demonstrates the postero-inferior extension of the CSH; C: Two years post-operative surveillance axial contrast enhanced T1-W image shows complete resolution of the lesion. T1-W: T1 weighted image; SWI: Susceptibility weighted image; CSH: Cavernous sinus hemangioma.
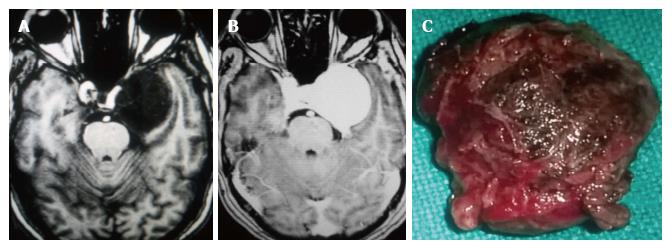
Figure 6 T1 weighted image plain, contrast enhanced axial magnetic resonance images and specimen photograph.
A: Axial plain T1-W image shows large hypointense lesion in the left cavernous sinus; B: Contrast enhancement is intense in the axial T1-W image; C: The surgical specimen shows a well lobulated reddish mass resected entirely. T1-W: T1 weighted image.
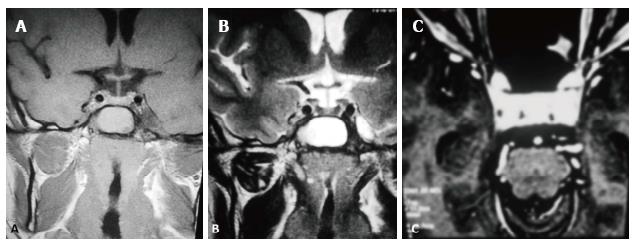
Figure 7 T2 weighted image coronal plain and contrast enhanced T1 weighted images.
A: T1-W coronal unenhanced image shows an isointense to hypointense signal in the left cavernous sinus without affecting the internal carotid artery; B: Coronal T2-W shows small heterogeneous signal intensity in the left cavernous sinus; C: T1-W contrast enhancement shows homogeneous enhancement of the small lesion causing painful ophthalmoplegia. T1-W: T1 weighted image; T2-W: T2 weighted image.
- Citation: Mahajan A, Rao VRK, Anantaram G, Polnaya AM, Desai S, Desai P, Vadapalli R, Panigrahi M. Clinical-radiological-pathological correlation of cavernous sinus hemangioma: Incremental value of diffusion-weighted imaging. World J Radiol 2017; 9(8): 330-338
- URL: https://www.wjgnet.com/1949-8470/full/v9/i8/330.htm
- DOI: https://dx.doi.org/10.4329/wjr.v9.i8.330


