Copyright
©The Author(s) 2017.
World J Radiol. Aug 28, 2017; 9(8): 321-329
Published online Aug 28, 2017. doi: 10.4329/wjr.v9.i8.321
Published online Aug 28, 2017. doi: 10.4329/wjr.v9.i8.321
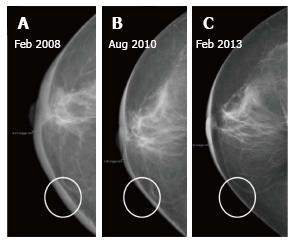
Figure 1 Patient underwent lumpectomy followed by radiation therapy.
A-C: (A) Diffuse increase in skin thickness is seen in first post therapy mammogram which decreased on subsequent mammograms at two (B) and five (C) years respectively.
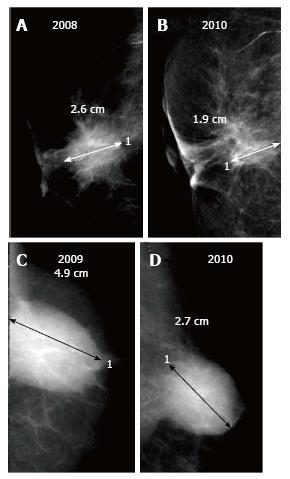
Figure 2 Two different patients post breast conservation.
A and B demonstrate retraction of scar in right breast on follow up while C and D reveal serial decrease in size of a post-operative collection (seroma) in left breast.
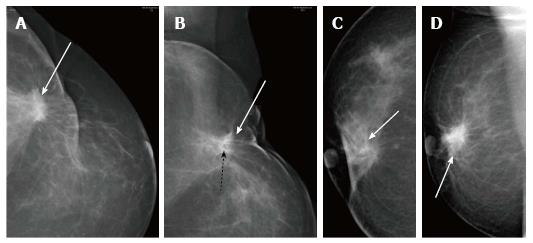
Figure 3 The scar usually decreases in density and/or size on serial imaging.
A and B demonstrate a post-surgical scar in left breast which is contiguous with the skin contour deformity. Fat lucency (black dashed arrow) within the scar is seen on the MLO view in (B); C and D show the post-surgery scar (white arrow) on CC and MLO views having different morphology respectively; it opens up on CC view (C).
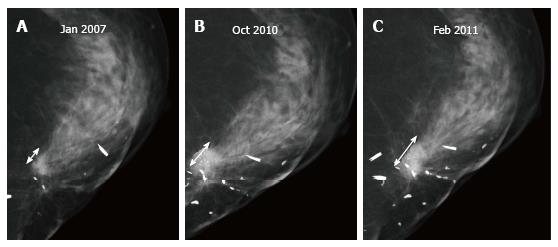
Figure 4 In a patient post breast-conserving therapy, scar (double headed arrow) is seen to increase in size at three (B) and four (C) years as compared to the initial mammogram shown in (A) which suggests recurrence.
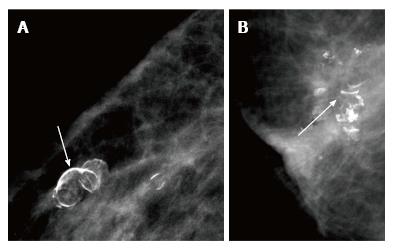
Figure 5 Calcifications associated with fat necrosis demonstrate a typical curvilinear or arc-like (arrows) morphology (A and B).
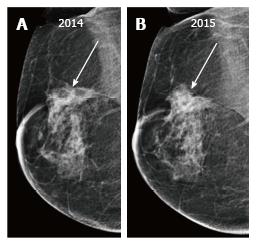
Figure 6 (A) Post breast-conserving therapy scar is seen in the right breast which appears to have increased in size on follow up mammogram after one year seen in (B).
However fat lucencies are still seen within the lesion (which was better appreciated on tomography images). Patient underwent biopsy because of clinical suspicion of recurrence.
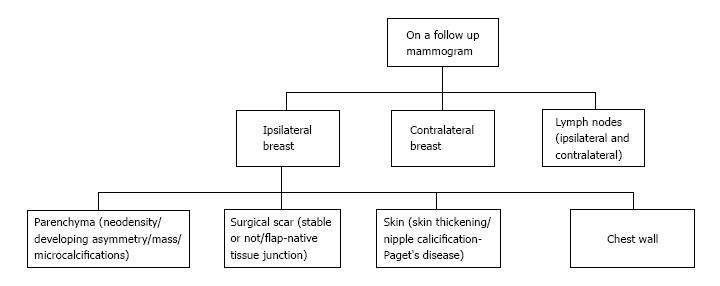
Figure 7 How are recurrences detected on follow up.
Figure 8 Sites for recurrent lesions.
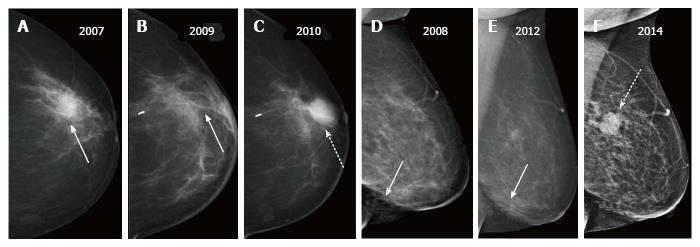
Figure 9 Two patients post breast-conserving therapy with recurrent masses.
A-C show a recurrent mass (dashed arrow in C) appearing at the scar site (solid arrow in A and B) two years after surgery; D-F demonstrate a post-surgical scar in the lower aspect (arrow in D and E) and a recurrent mass (dashed arrow in F) in upper aspect - different quadrant than the primary.
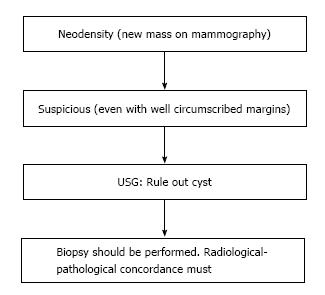
Figure 10 Approach to a neodensity.
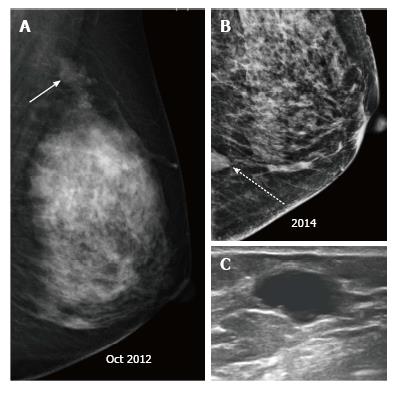
Figure 11 Patient with a left breast mass (arrow), who underwent breast-conserving therapy (A), (B) follow up mammogram at 2 years revealed a neodensity (dashed arrow) which on ultrasound (C) was found to be a cyst.
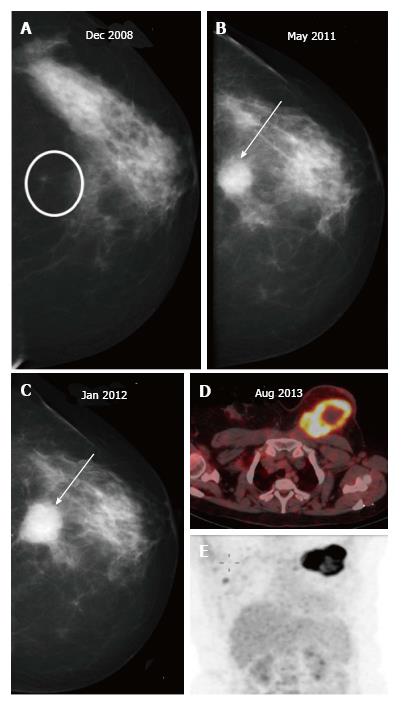
Figure 12 Morphology is the most important criteria, and it is necessary to achieve a radiological-pathological concordance.
A-C: Patient underwent breast-conserving therapy for left breast carcinoma and on follow up imaging was found to have a developing asymmetry (circle in A) progressing to a mass (arrows in B and C). Biopsy and histopathology showed no evidence of malignancy however there was radiological and pathological discordance; D and E: Patient presented a year later with a large necrotic FDG-avid mass in the left breast. FDG: Fluoro-2-deoxyglucose.
Figure 13 Patient with a right breast mass (arrow in A) who underwent breast-conserving therapy shows a normal post therapy mammogram at two years (B) with a post-surgical scar (dashed arrow), follow up imaging demonstrates a developing asymmetry in the retro-areolar region at three (C) years post therapy which subsequently developed into a frank mass (D).
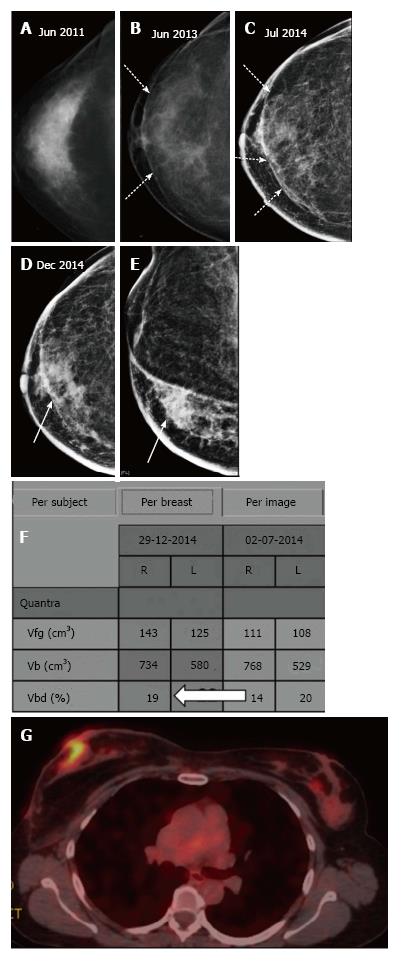
Figure 14 The most common site of tumor recurrence is the contact line, at the junction of the flap with the native tissue.
A-C: Patient post right lumpectomy (A) underwent subcutaneous mastectomy with LD flap (dashed arrows in B and C); D-F: At three year follow up patient presented with a skin nodule which was seen as an asymmetric density at the junction of flap with native breast tissue (arrows in D and E) and an increase in volumetric density of right breast (F); FDG-PET study (G) showed that the nodule was FDG avid. Histology - IDC grade 3. FDG-PET: Fluoro-2-deoxyglucose-positron emission tomography.
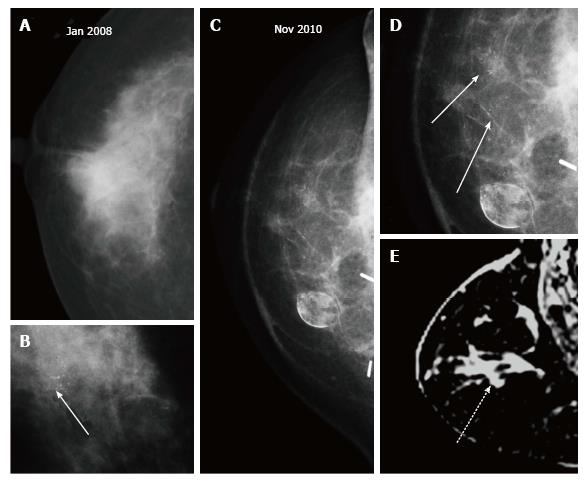
Figure 15 Microcalcifications.
A, B: Patient presented with a right breast mass with microcalcifications (arrow in B) and underwent right breast-conserving therapy with latissimus dorsi flap; C, D: At two years post treatment casting microcalcifications developed similar to the index lesion, better appreciated on magnified view (arrows in D) are seen around the scar site; E: Breast MRI revealed non-mass enhancement (dashed arrow) in the right breast. Histopathology of the recurrence showed DCIS. MRI: Magnetic resonance imaging.
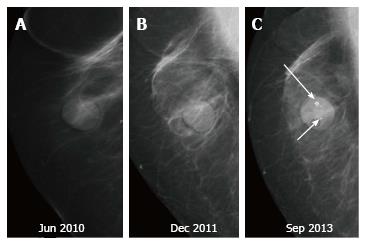
Figure 16 In dystrophic or benign calcifications, fat lucency (circle) is present within as seen in (A) while in calcifications associated with recurrence (arrows), the centre appears dense (circle) as shown in (B), (C) subtracted post contrast MRI image of the patient in (B) shows a seroma cavity (solid arrow) with an enhancing solid component (dashed arrow) in the periphery anteriorly.
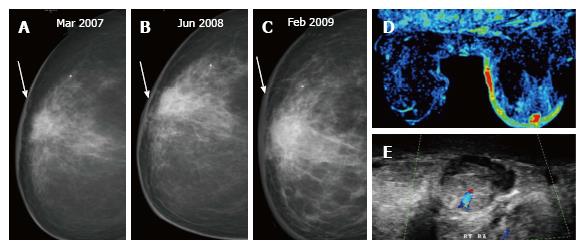
Figure 17 (A) In a post breast-conserving therapy patient, the skin thickness increases at one-year (B) and two-year (C) follow up mammograms; (D) dynamic MR perfusion reveals increased perfusion along the skin of the right breast and an enhancing focus, on ultrasound (E) an oval hypoechoic mass with increased vascularity is seen in the retroareolar region corresponding to the enhancing focus on breast MRI.
Histopathology: Angiosarcoma. MRI: Magnetic resonance imaging.
Figure 18 Microcalcifications in the nipple-areola region may be seen on the mammogram.
A: Three year post breast-conserving therapy mammogram - normal. Patient presented with unilateral yellowish nipple discharge and no clinically palpable abnormality at five year follow up. MMG revealed microcalcification (arrows in C) in the nipple-areola region. Histopathology: Paget’s disease of nipple; B: On retrospective evaluation, a tiny speck of calcification is seen in the nipple-areola region.
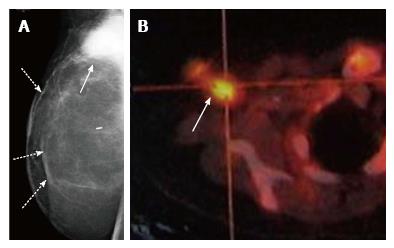
Figure 19 Patient underwent right skin sparing mastectomy with Deep Inferior Epigastric Perforator Flap (dashed arrows in A) and axillary and apical clearance, one year later she presented with right axillary nodes (arrow) on mammogram (A) which were FDG-avid on PET (B).
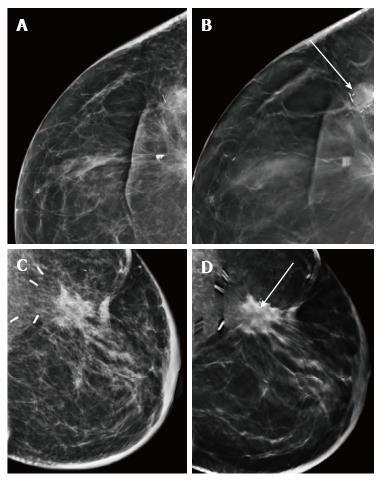
Figure 20 (A) and (B) represent conventional or 2D mammographic (A) and digital breast tomosynthesis (B) views of the scar site recurrence wherein mass density within the lesion is better appreciated on digital breast tomosynthesis (arrow); (C) and (D) show appearance of a scar on conventional or 2D mammogram (C) and digital breast tomosynthesis (D) where the fat lucency at the scar site is confirmed (arrow) on digital breast tomosynthesis.
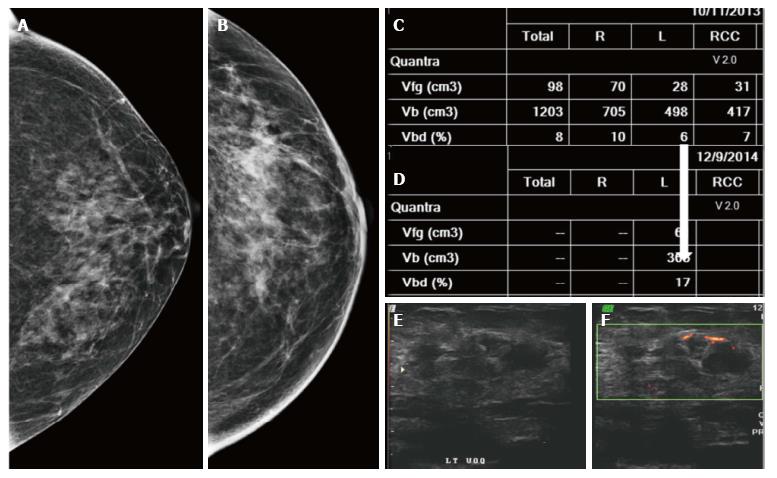
Figure 21 Patient underwent left breast-conserving therapy.
On follow-up mammograms at five (A) and six (B) years a subtle increase in density is noted. On volumetric assessment (C and D), the left breast density increased from 6 to 17; E and F: Ultrasound and color Doppler revealed a heterogeneously hypoechoic mass in left upper outer quadrant with peripheral vascularity. Histology: IDC.
- Citation: Ramani SK, Rastogi A, Mahajan A, Nair N, Shet T, Thakur MH. Imaging of the treated breast post breast conservation surgery/oncoplasty: Pictorial review. World J Radiol 2017; 9(8): 321-329
- URL: https://www.wjgnet.com/1949-8470/full/v9/i8/321.htm
- DOI: https://dx.doi.org/10.4329/wjr.v9.i8.321


