Copyright
©The Author(s) 2017.
World J Radiol. Jun 28, 2017; 9(6): 287-294
Published online Jun 28, 2017. doi: 10.4329/wjr.v9.i6.287
Published online Jun 28, 2017. doi: 10.4329/wjr.v9.i6.287
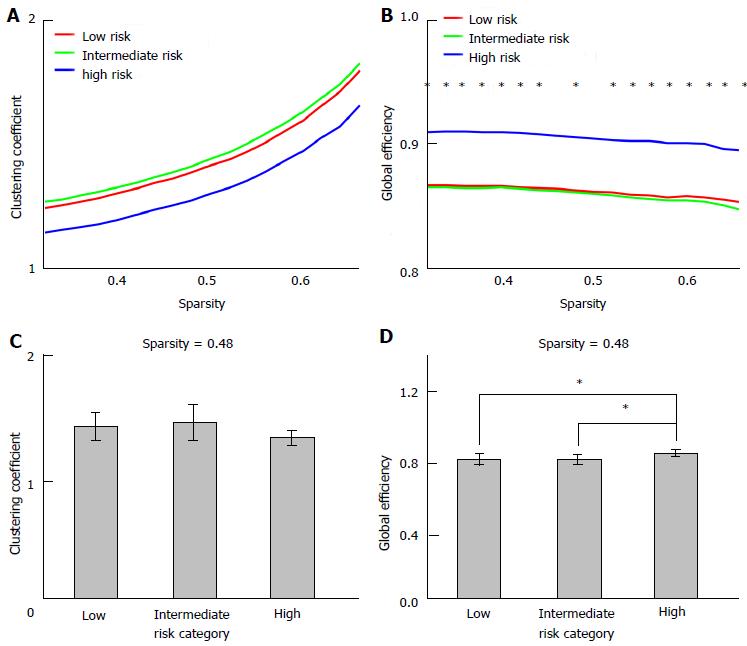
Figure 1 Mean clustering coefficient (A and C) and global efficiency (B and D) for each risk category.
Both clustering coefficient and global efficiency are normalized, i.e., the measures are divided by the clustering coefficient and global efficiency of random networks. A and B show the graph measures as a function of sparsity, while B and D show the results at a single sparsity level. Error bars show standard deviations, while the “*” indicate significant differences between the risk categories (P < 0.05, with age included as covariate).
- Citation: van Veenendaal TM, IJff DM, Aldenkamp AP, Lazeron RHC, Hofman PAM, de Louw AJA, Backes WH, Jansen JFA. Chronic antiepileptic drug use and functional network efficiency: A functional magnetic resonance imaging study. World J Radiol 2017; 9(6): 287-294
- URL: https://www.wjgnet.com/1949-8470/full/v9/i6/287.htm
- DOI: https://dx.doi.org/10.4329/wjr.v9.i6.287


