Copyright
©The Author(s) 2017.
World J Radiol. Jun 28, 2017; 9(6): 253-268
Published online Jun 28, 2017. doi: 10.4329/wjr.v9.i6.253
Published online Jun 28, 2017. doi: 10.4329/wjr.v9.i6.253
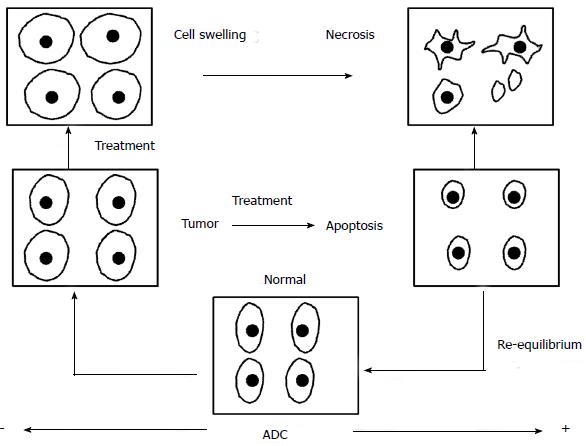
Figure 1 Diffusion imaging in oncology.
The pictorial diagram depicts the diffusion changes and corresponding ADC values in correlation to the pre and post-treatment tumor microenvironment. Increased cell density in the tumor tissue leads to low ADC values as compared to the normal tissue. When subjected to antitumor therapy the cells undergo swelling in the immediate post-treatment phase which leads to further decrease in the ADC values. Once the cell death cycle sets in the cell membranes are more permeable and diffusivity increases which leads to higher ADC values. This ADC normalizes during the healing phase. ADC: Apparent diffusion coefficient.
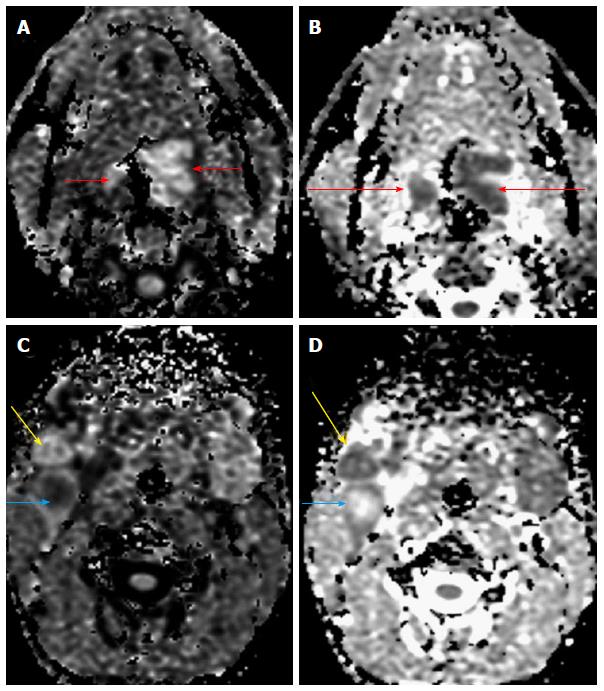
Figure 2 A 70-year-old male presented with a lesion in the base of tongue.
Diffusion weighted imaging revealed restricted diffusion (A) in the primary lesion (short arrows) with reduced ADC values (B, long arrows). Restricted diffusion was also noted in the two right level II nodes with reduced ADC values (C and D) indicating nodal metastases (yellow and blue arrows). One of the nodes, showed raised central ADC values suggestive of necrosis (blue arrow). Biopsy of the primary lesion revealed squamous cell carcinoma. ADC: Apparent diffusion coefficient.
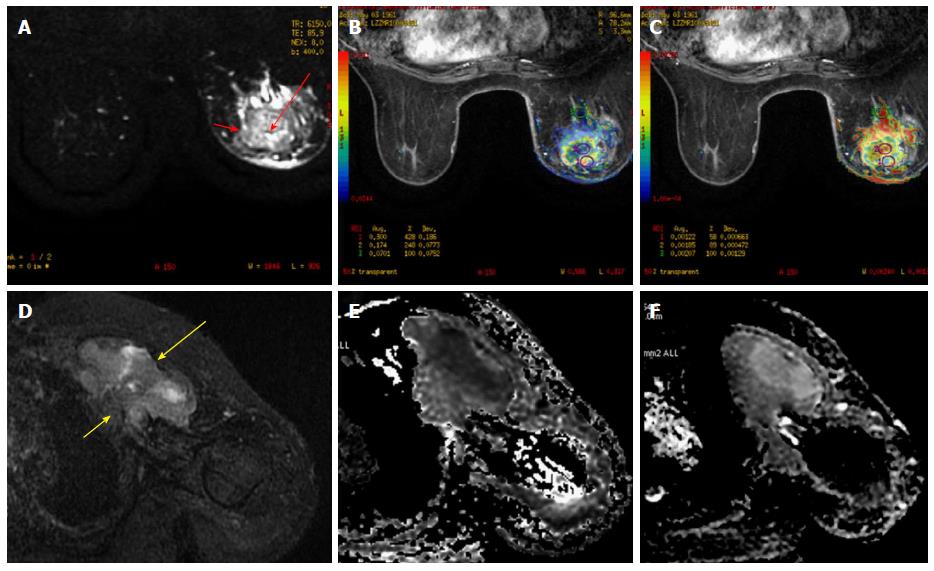
Figure 3 A 51-year-old female presented with a lump in the left breast.
A: FS T2 weighted images revealed a well-defined rounded mass with smooth margins in the left breast with central hyperintensity (long red arrow) and a hypointense rim (short red arrow). Diffusion weighted imaging (B) revealed restricted diffusion in the periphery of the lesion (ROI 1) with reduced ADC values (C). The center of the lesion showed facilitated diffusion suggestive of necrotic areas (ROI 2). Biopsy revealed invasive ductal carcinoma; D: FS T2 weighted images revealed a well-defined heterogeneously hyperintense irregular mass in the left breast (long yellow arrow) with chest wall invasion (short yellow arrow). Diffusion weighted imaging (E) revealed restricted diffusion with reduced ADC values (F). Biopsy revealed invasive ductal carcinoma. ADC: Apparent diffusion coefficient.
Figure 4 Pre-therapy magnetic resonance imaging in 57-year-old patient with hepatocellular carcinoma.
A: DCE MR of liver showed enhancing lesion in segment V, VI, VII and VIIII of the liver (long arrow-A) with enhancing portal vein thrombus (short white arrow-A). Diffusion weighted imaging revealed restricted diffusion in the hepatic lesion (long arrow-B) and the portal vein thrombus (short arrow-B) with reduced ADC values (B and C). Biopsy revealed hepatocellular carcinoma. Thus DWI helps in confirming the diagnosis of malignant portal vein thrombosis. ADC: Apparent diffusion coefficient; MR: Magnetic resonance; DWI: Diffusion-weighted imaging.
Figure 5 A 45-year-old female with ovarian malignancy, post therapy, presented with sudden onset of abdominal pain and high grade fever.
A: Axial T2 W images showed well defined lesions in the right lobe of liver with central hyperintensity and hypointense rim (arrow). However, DWI showed restricted diffusion (B) in the periphery of the lesion with reduced ADC values (C) with central necrotic component which showed facilitated diffusion. The case was diagnosed as necrotic metastases. Final histopathology was hepatic metastasis. ADC: Apparent diffusion coefficient; DWI: Diffusion-weighted imaging.
Figure 6 A 62-year-old male presented with bleeding per rectum.
(A) Axial post contrast T1W fat suppressed image showed eccentric rectal wall thickening (arrow) which showed restricted diffusion (B) on diffusion weighted images (ROI 1) with reduced ADC values (C) as compared to the adjacent normal rectal wall (ROI 2). Histopathological evaluation revealed adenocarcinoma of rectum.
Figure 7 A 51-year-old male previously treated for rectal malignancy presented with suspected recurrence.
A: Axial T2 W images showed irregular polypoidal mass lesions with necrosis within in the perianal region. However, diffusion weighted images (exponential map image B and apparent diffusion map image C) showed facilitated diffusion (arrowhead, ROI 1) in both the solid polypoidal as well as the necrotic component favoring a benign etiology. A diagnosis of perianal abscess was made and patient underwent debridement which revealed ischiorectal abscess.
Figure 8 A 61-year-old male presented with hematuria and right sided flank pain.
Superimposed DWI and T2 W images revealed a well-defined right renal mass which showed restricted diffusion (A-white arrow) with low ADC values (B-red arrow) suggestive of malignant mass. Post histopathological evaluation revealed renal cell carcinoma. ADC: Apparent diffusion coefficient; DWI: Diffusion-weighted imaging.
Figure 9 A 65-year-old male presented with symptoms of bladder outlet obstruction and raised serum PSA.
DCE-MRI revealed a focal lesion in the central gland on the left side (white arrow in A), with restricted diffusion (white arrow in B) and low ADC values (white arrow in C) suggestive of malignancy. Biopsy revealed prostatic adenocarcinoma. ADC: Apparent diffusion coefficient; MRI: Magnetic resonance imaging.
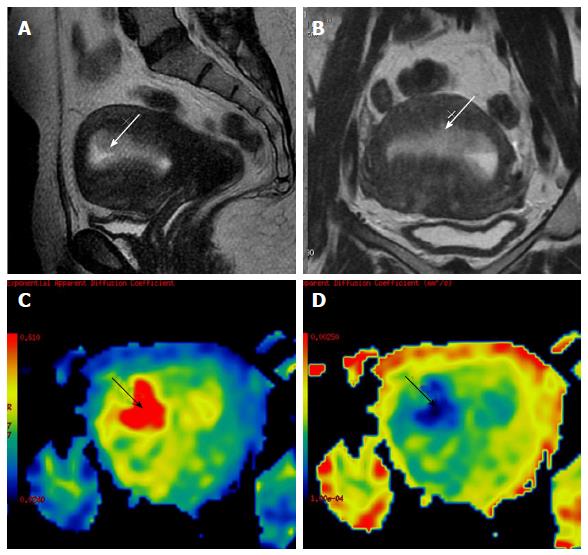
Figure 10 A 60-year-old female on tamoxifen, presented with post-menopausal bleeding.
MRI revealed a heterogeneously hyperintense lesion in the endometrium (white arrow in A and B) which showed restricted diffusion (black arrow in C) with low ADC values (black arrow in D). Surgery was performed and histopathology showed tamoxifen induced hyperplasia harboring carcinoma of the endometrium. ADC: Apparent diffusion coefficient; MRI: Magnetic resonance imaging.
Figure 11 A 59-year-old female presented with post-menopausal bleeding.
MRI revealed heterogeneously enhancing mass in the cervix which showed restricted diffusion (A-ROI 1) with low ADC (B-ROI-1) values and higher values on diffusion histogram maps (C) suggestive of malignancy. Biopsy revealed squamous cell carcinoma of the cervix. ADC: Apparent diffusion coefficient; MRI: Magnetic resonance imaging.
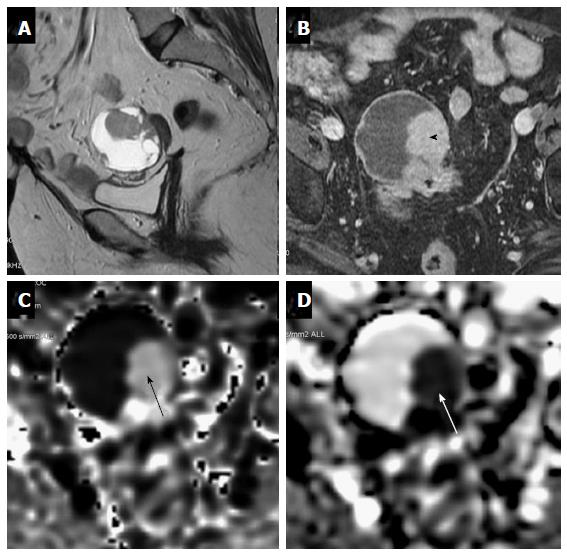
Figure 12 A 63-year-old female under evaluation for ovarian mass.
(A) Sagittal T2W images showing a well-defined complex ovarian cyst showing hyperintense solid component which shows post contrast enhancement (black arrowhead-B) and restricted diffusion (black arrow-C) with low ADC values (white arrow-D). Restricted diffusion in the solid component was suggestive of this lesion to be a malignant ovarian mass. Final histopathology revealed mucinous cystadenocarcinoma..
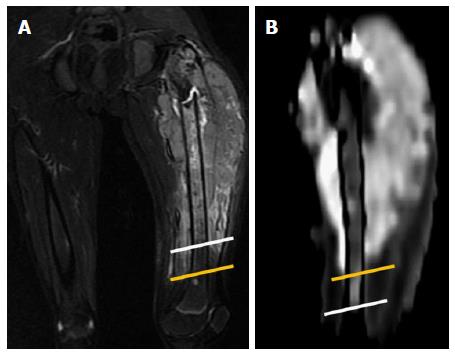
Figure 13 Case of Ewing’s sarcoma in a 12-year-old boy.
A: Coronal T2W-FS image showing altered marrow signal intensity in the femoral diaphysis (white line representing inferior extent) with associated soft tissue mass and surrounding edema (yellow line representing inferior extent); B: DWI shows restricted diffusion in the involved marrow which was significantly less (inferior extent represented by the white line) than that noted on the T2w Images thus differentiating the marrow edema from marrow infiltration and soft tissue edema from infiltration (yellow line representing inferior extent). The soft tissue mass shows restricted diffusion, suggestive of infiltrative tumor mass and not reactive inflammation. DWI: Diffusion-weighted imaging.
- Citation: Mahajan A, Deshpande SS, Thakur MH. Diffusion magnetic resonance imaging: A molecular imaging tool caught between hope, hype and the real world of “personalized oncology”. World J Radiol 2017; 9(6): 253-268
- URL: https://www.wjgnet.com/1949-8470/full/v9/i6/253.htm
- DOI: https://dx.doi.org/10.4329/wjr.v9.i6.253


