Copyright
©The Author(s) 2017.
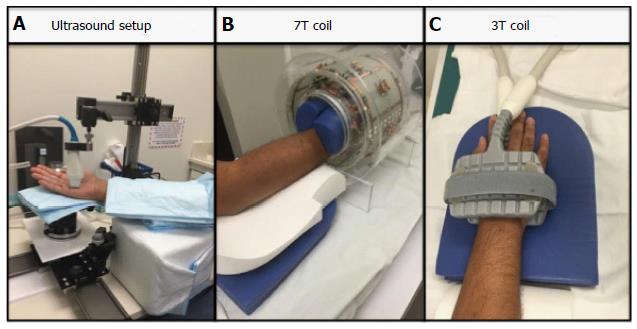
Figure 1 The figure shows the set up for the ultrasound (A), the 7T (B) and the 3T (C) respectively.
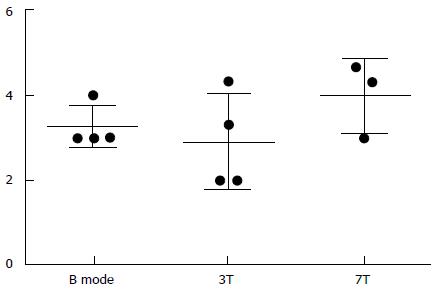
Figure 2 Data from 3 subjective analyses of image quality (1-5 scale).
Error bars included.
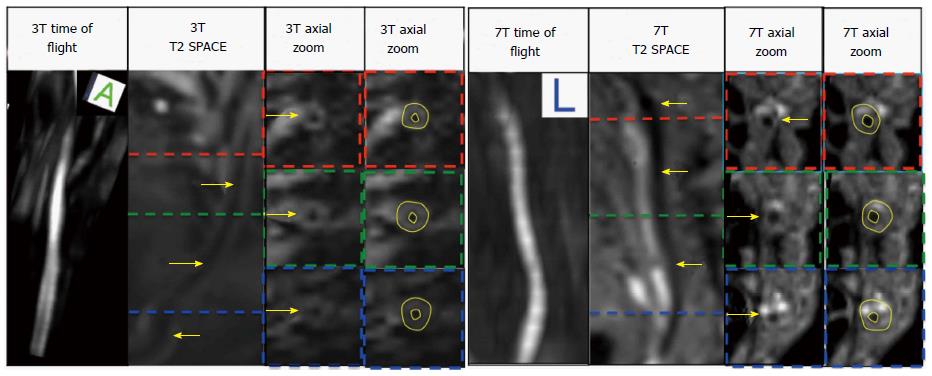
Figure 3 Displays the 3T images (Left) and the 7T images (Right) the arrows point to vessel wall.
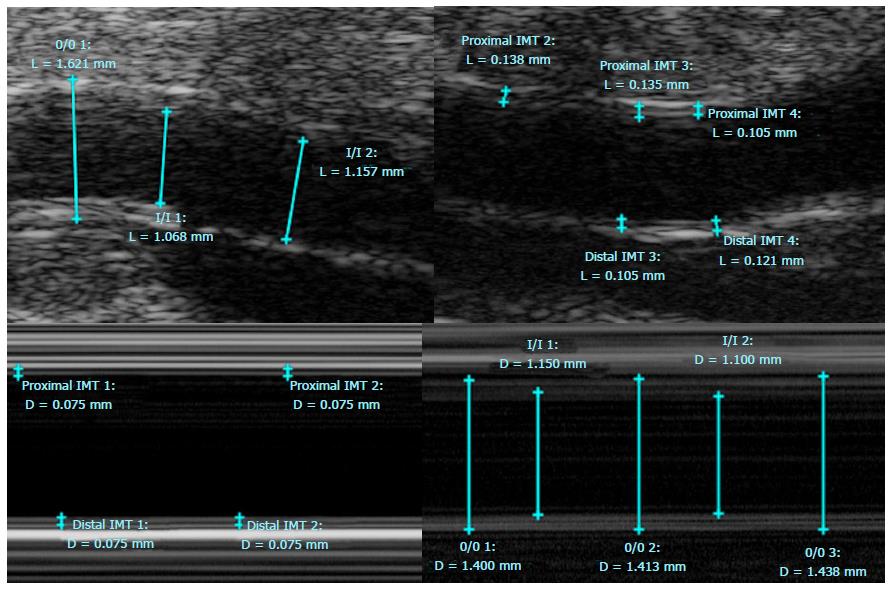
Figure 4 Ultrasound Images (B mode, M mode).
- Citation: Pruzan AN, Kaufman AE, Calcagno C, Zhou Y, Fayad ZA, Mani V. Feasibility of imaging superficial palmar arch using micro-ultrasound, 7T and 3T magnetic resonance imaging. World J Radiol 2017; 9(2): 79-84
- URL: https://www.wjgnet.com/1949-8470/full/v9/i2/79.htm
- DOI: https://dx.doi.org/10.4329/wjr.v9.i2.79


