Copyright
©The Author(s) 2017.
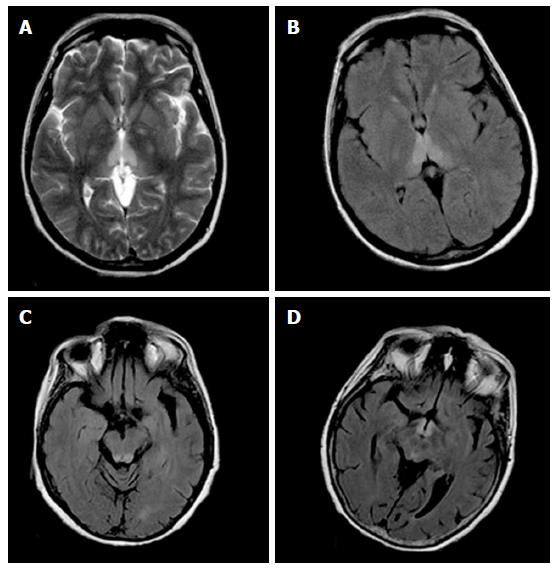
Figure 1 Magnetic resonance images in a patient with alcoholic Wernicke’s encephalopathy.
A: Axial T2-weighted image shows symmetrical high signal intensity lesions in the medial thalami; B: Axial fluid-attenuated inversion recovery (FLAIR) image shows symmetrical high signal intensity lesions in the medial thalami; C: Axial FLAIR image shows symmetrical high signal intensity lesions in the periaqueductal area; D: Axial FLAIR image shows symmetrical high signal intensity lesions around the mammillary bodies.
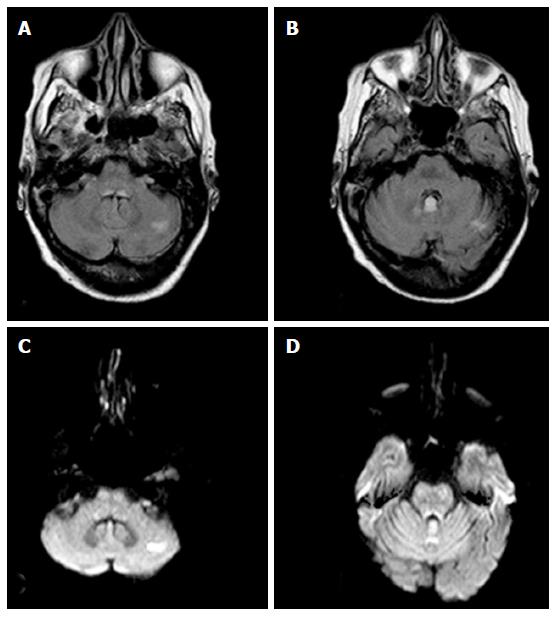
Figure 2 Magnetic resonance images in a patient with nonalcoholic Wernicke’s encephalopathy.
A: Axial FLAIR image shows a high signal intensity lesion in the left cerebellar hemisphere; B: Axial FLAIR image shows a high signal intensity lesion in the cerebellar vermis; C: Axial DWI shows an high signal intensity lesion in the left cerebellar hemisphere; D: Axial DWI shows a high signal intensity lesion in the cerebellar vermis. FLAIR: Fluid-attenuated inversion recovery; DWI: Diffusion-weighted imaging.
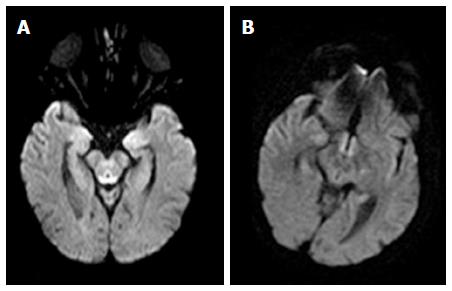
Figure 3 Axial diffusion weighted image magnetic resonance images in a patient with alcoholic Wernicke’s encephalopathy in the acute phase.
A: Diffusion weighted image shows restricted diffusion in the periaqueductal grey matter; B: Diffusion weighted image shows restricted diffusion around the mammillary bodies.
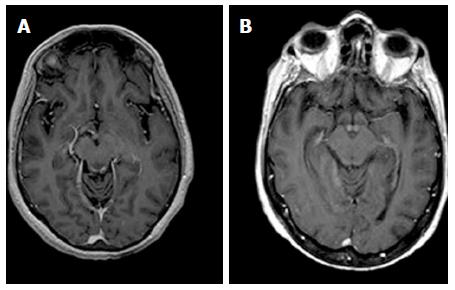
Figure 4 Axial T1-weighted magnetic resonance images after contrast material administration in a patient with alcoholic Wernicke’s encephalopathy.
A: Enhanced axial T1-weighted image shows contrast-enhancement of the periaqueductal grey matter; B: Enhanced axial T1-weighted image shows contrast-enhancement around the mammillary bodies.
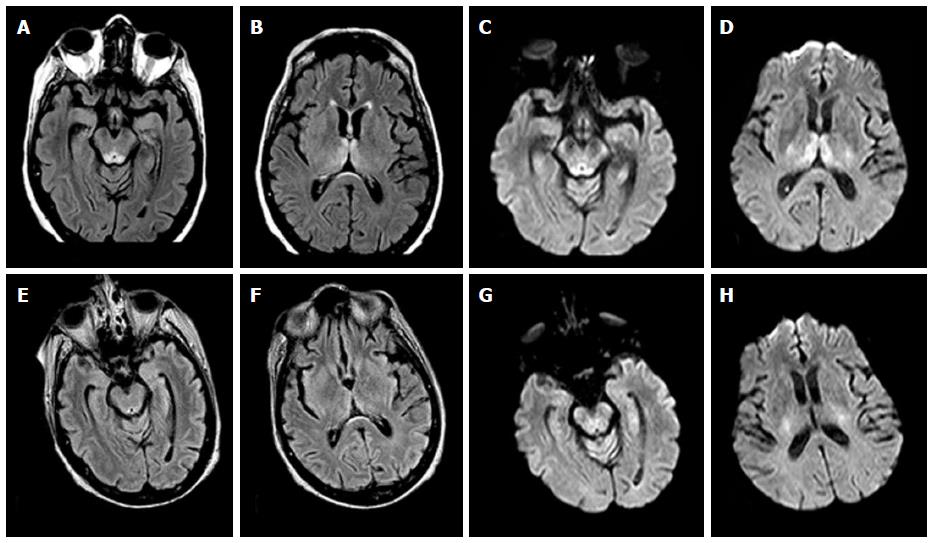
Figure 5 Magnetic resonance images in a patient affected by alcoholic Wernicke’s encephalopathy.
A-D: MR images before intravenous administration of thiamine therapy; E-H: MR images after intravenous administration of thiamine therapy. Axial FLAIR images (A,B) and DWI images (C,D) show signal abnormalities in the periaqueductal area and in the medial thalami. Axial FLAIR (E,F) and DWI (G,H) follow-up MR images, after intravenous administration of thiamine therapy, show resolution of the signal abnormalities previously observed. MR: Magnetic resonance; FLAIR: Fluid-attenuated inversion recovery; DWI: Diffusion weighted image.
- Citation: Sparacia G, Anastasi A, Speciale C, Agnello F, Banco A. Magnetic resonance imaging in the assessment of brain involvement in alcoholic and nonalcoholic Wernicke’s encephalopathy. World J Radiol 2017; 9(2): 72-78
- URL: https://www.wjgnet.com/1949-8470/full/v9/i2/72.htm
- DOI: https://dx.doi.org/10.4329/wjr.v9.i2.72


