Copyright
©The Author(s) 2017.
World J Radiol. Dec 28, 2017; 9(12): 448-453
Published online Dec 28, 2017. doi: 10.4329/wjr.v9.i12.448
Published online Dec 28, 2017. doi: 10.4329/wjr.v9.i12.448
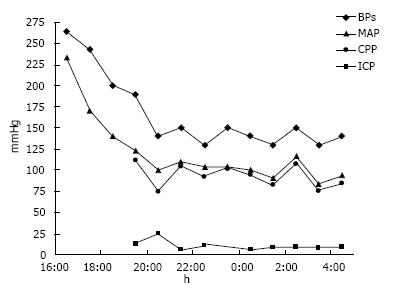
Figure 1 Diagram showing the evolution of systolic blood pressure, mean arterial blood pressure, cerebral perfusion pressure and intracranial pressure within the first 12 h.
BP: Blood pressure; MAP: Mean arterial blood pressure; CPP: Cerebral perfusion pressure; ICP: Intracranial pressure.
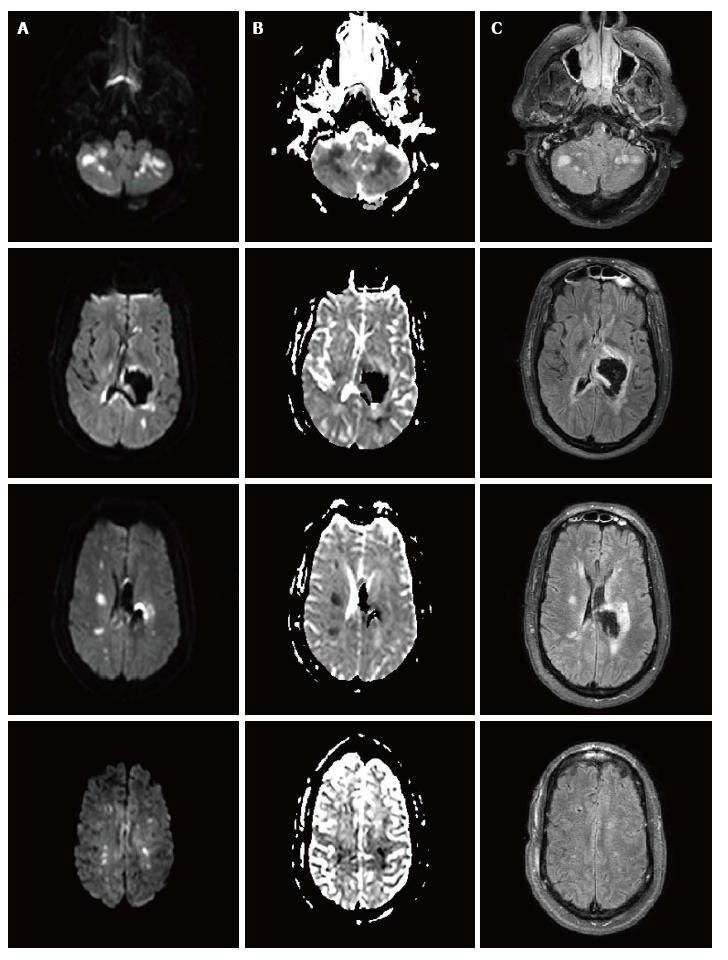
Figure 2 Brain magnetic resonance imaging with diffusion weighted imaging (A), apparent diffusion coefficient (B) and FLAIR sequences (C) showing multiple areas of infarction in the internal border zone areas of bilateral cerebral and cerebellar hemispheres.
There is no evidence of perihematoma infarction. MRI: Magnetic resonance imaging.
- Citation: Gavito-Higuera J, Khatri R, Qureshi IA, Maud A, Rodriguez GJ. Aggressive blood pressure treatment of hypertensive intracerebral hemorrhage may lead to global cerebral hypoperfusion: Case report and imaging perspective. World J Radiol 2017; 9(12): 448-453
- URL: https://www.wjgnet.com/1949-8470/full/v9/i12/448.htm
- DOI: https://dx.doi.org/10.4329/wjr.v9.i12.448


