Copyright
©The Author(s) 2017.
World J Radiol. Dec 28, 2017; 9(12): 438-447
Published online Dec 28, 2017. doi: 10.4329/wjr.v9.i12.438
Published online Dec 28, 2017. doi: 10.4329/wjr.v9.i12.438
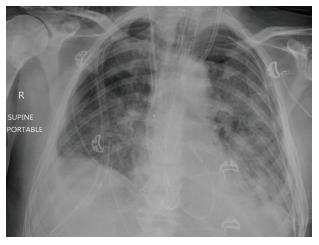
Figure 1 Chest X-ray of a 64-year-old male 3 d post transplantation showing reperfusion oedema.
Bilateral airspace opacity predominantly in the mid to lower zones with associated bilateral pleural effusions.
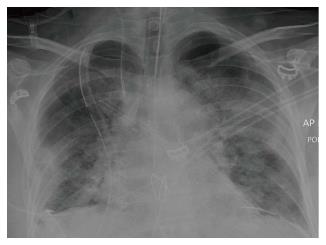
Figure 2 Chest X-ray 3 d post transplantation shows reperfusion oedema.
Bilateral airspace opacity in the mid to lower zones and sub-pleural consolidation in the lower zone of the right lower lobe.
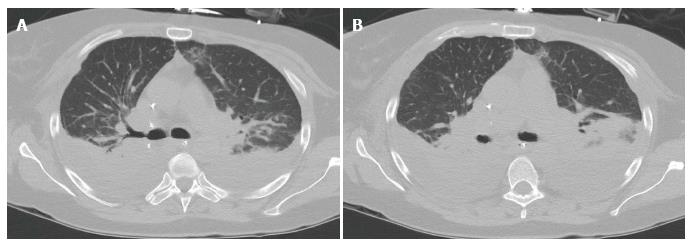
Figure 3 Computerised tomography images of the chest 4 wk post-transplantation showing acute rejection.
Bilateral basal predominant consolidation, diffuse ground glass opacity and atelectasis with large bilateral pleural effusions. A: Axial slice of CT chest image showing bilateral basal consolidations; B: Axial slice of CT chest image illustrating extensive bilateral pleural effusions with pulmonary atelectasis. CT: Computerised tomography.
Figure 4 Acute rejection in a 50-year-old female 3 wk post-transplantation.
CT scan of the chest shows bilateral diffuse ground glass opacity, linear atelectases, bilateral pleural effusion and bilateral peribronchial thickening. A: Coronal slice of CT chest image showing bilateral ground glass opacities and linear atelectasis; B: Axial slice of CT chest image highlighting bilateral pleural effusions; C: Axial slice of CT chest image highlighting peribronchial thickening. CT: Computerised tomography.
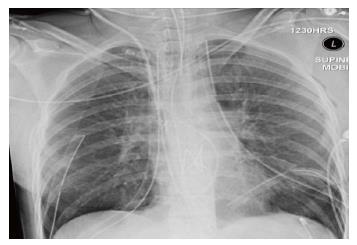
Figure 5 Chest X-ray shows increased lucency of the costophrenic angles on both sides (deep sulcus sign) in keeping with bilateral supine pneumothoraces.
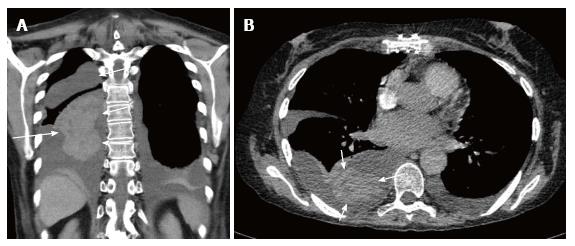
Figure 6 Computerised tomography scan of the chest in a 63-year-old female performed 16 d post bilateral lung transplant showing a coronal slice and an axial slice of a left pleural effusion and right haemothorax with clotted blood component (arrow).
A: Coronal slice; B: Axial slice.
Figure 7 Computerised tomography scan images of a 37-year-old man performed 18 mo post-transplantation showing a coronal slice and an axial slice of a stenosis of the right main stem bronchus (arrow).
A: Coronal slice; B: Axial slice.
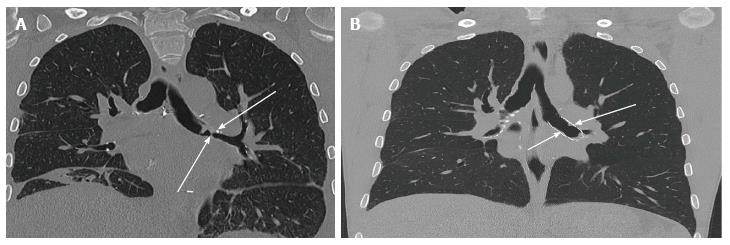
Figure 8 Computerised tomography scan of the chest showing a left main stem bronchial stenosis (arrow) in a 36-year-old male 2 mo post lung transplantation.
A: Coronal slice of CT chest image before insertion of bronchial stent; B: Coronal slice of CT chest image after insertion of bronchial stent. CT: Computerised tomography.
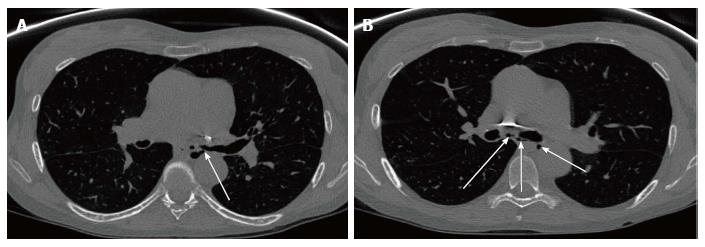
Figure 9 Computerised tomography scan of the chest in a 51-year-old female performed nearly 3 years post bilateral lung transplantation shows left main bronchial dehiscence resulting in gas locules tracking from the left main stem bronchus to the mediastinum causing pneumomediastinum.
A: Axial slice of CT chest image showing gas leaks (arrow) from the left main stem bronchus; B: Axial slice of CT chest image showing multiple gas locules (arrow) causing pneumomediastinum. CT: Computerised tomography.
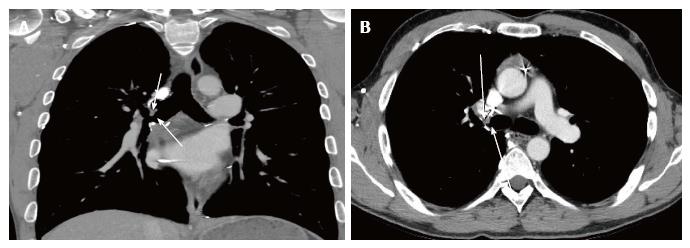
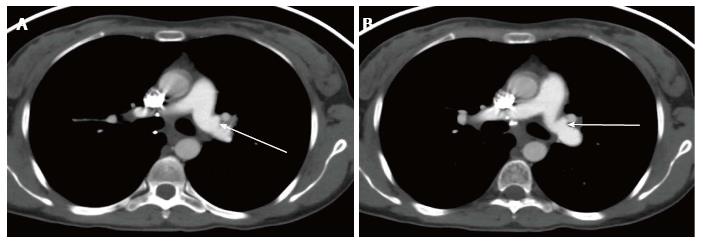
Figure 10 Computerised tomography scan of the chest in a 31-year-old female 3 mo post bilateral lung transplantation showing peri-anastomotic left pulmonary artery saccular aneurysm.
A: Axial slice of CT chest image showing a left pulmonary artery saccular aneurysm (arrow); B: Axial slice of CT chest image showing a left pulmonary artery saccular aneurysm (arrow). CT: Computerised tomography.
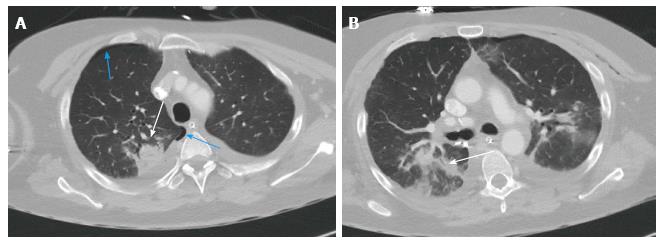
Figure 11 Computerised tomography scan of the chest 2 wk post-transplantation shows consolidation in the right upper lobe posteriorly with air bronchogram in keeping with pneumonia.
Associated right sided pneumothorax. A: Axial slice of CT chest showing right upper lobe consolidation (white arrow), and right sided pneumothorax (blue arrows); B: Axial slice showing consolidation on the right upper lobe with air bronchogram (arrow). CT: Computerised tomography.
Figure 12 Chest computerised tomography scan of a 57-year-old male performed 2 years post-transplantation shows pseudomonas lung infection.
Geographic area of ground glass opacity with associated diffuse centrilobular ground glass opacities and bronchiolar thickening mainly in the basal segment of the left upper lobe. A: Axial slice of CT chest image showing ground glass opacity (arrow); B: Axial slice of CT chest image highlighting diffuse centrilobar ground glass opacities on the left; C: Axial slice of CT chest image showing bronchiolar wall thickening in the left upper lobe (arrow). CT: Computerised tomography.
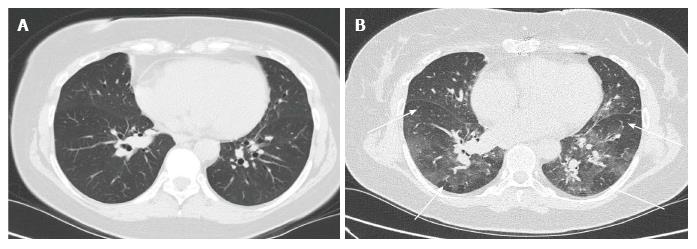
Figure 13 Bronchiolitis/small airway disease.
CT scan of the chest performed 8 years post-transplantation shows patchy multifocal air trapping with bronchiolar thickening. A: Axial slice of CT chest image showing bronchiolar thickening; B: Axial slice of CT chest image showing multifocal areas of patchy air trapping. CT: Computerised tomography.
Figure 14 Chest computerised tomography scan of a 30-year-old male performed 2 mo after lung transplantation shows fungal infection.
Two partly solid nodules in the right lung (one in the basal segment of the right upper lobe and the other in the right lower lobe. A: Axial slice of CT chest image showing right lower lobe nodule (arrow); B: Coronal slice of CT chest image showing 2 nodules on the lower segment of the right upper lobe (blue arrow) and right lower lobe (white arrow); C: Axial slice of CT chest image showing partially solid nodule (arrow). CT: Computerised tomography.
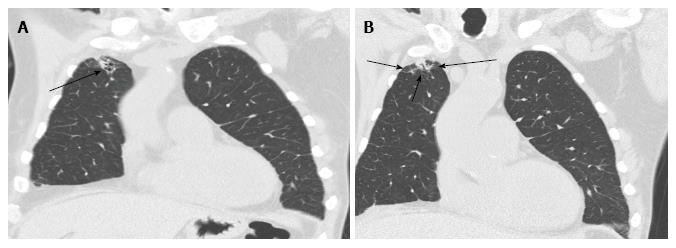
Figure 15 Broncho-alveolar lavage proven aspergillosis.
CT scan of the chest shows right lung apex sub-pleural nodule with surrounding ground glass opacity and focal bronchiectasis. A: Coronal slice of CT chest showing right apical sub-pleural nodule (arrow); B: Coronal slice of CT chest showing surrounding ground glass opacity and focal bronchiectasis (arrow) around a sub-pleural nodule. CT: Computerised tomography.
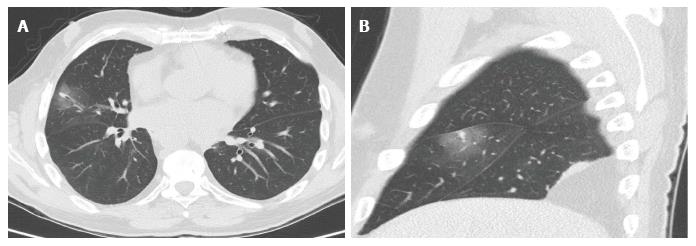
Figure 16 Computerised tomography scan of the chest performed 1 year post bilateral lung transplant shows pulmonary aspergillosis.
An axial slice (A) and sagittal slice (B) showing a middle lobe small solid nodule with relatively large peripheral halo of ground glass opacity known as a “halo sign” (arrow). Bronchoscopy confirmed aspergillosis. A: Axial slice; B: Sagittal slice.
- Citation: Chia E, Babawale SN. Imaging features of intrathoracic complications of lung transplantation: What the radiologists need to know. World J Radiol 2017; 9(12): 438-447
- URL: https://www.wjgnet.com/1949-8470/full/v9/i12/438.htm
- DOI: https://dx.doi.org/10.4329/wjr.v9.i12.438


