Copyright
©The Author(s) 2016.
World J Radiol. Sep 28, 2016; 8(9): 809-815
Published online Sep 28, 2016. doi: 10.4329/wjr.v8.i9.809
Published online Sep 28, 2016. doi: 10.4329/wjr.v8.i9.809
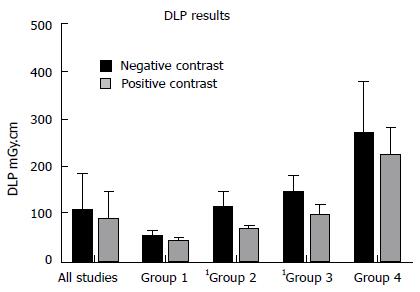
Figure 1 Comparison of dose-length product measurements for all studies in the neutral and positive cohorts and by body mass index range.
Group 1: BMI < 20 kg/m2; group 2: BMI 20-25 kg/m2; group 3: BMI 25-30 kg/m2; group 4: BMI > 30 kg/m2. Significant differences are denoted by1. BMI: Body mass index.
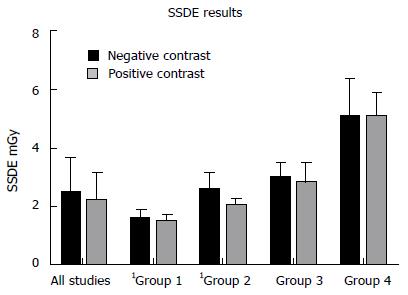
Figure 2 Comparison of size-specific dose estimated measurements for all studies in the neutral and positive cohorts and by body mass index range.
Group 1: BMI < 20 kg/m2; group 2: BMI 20-25 kg/m2; group 3: BMI 25-30 kg/m2; group 4: BMI > 30 kg/m2. Significant differences are denoted by1. BMI: Body mass index.
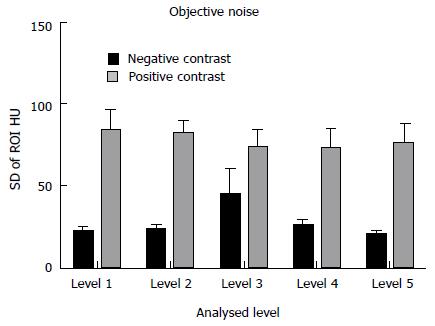
Figure 3 Comparison of objective noise measurements between the neutral and positive studies.
Level 1: Liver at the right hemi-diaphragm level; level 2: Liver at the porta hepatis; level 3: Right renal cortex at the renal hilum; level 4: Psoas muscle at the iliac crest; level 5: Gluteus maximus at the level of the acetabular roof. All neutral measurements were significantly superior. ROI: Regions of interest.
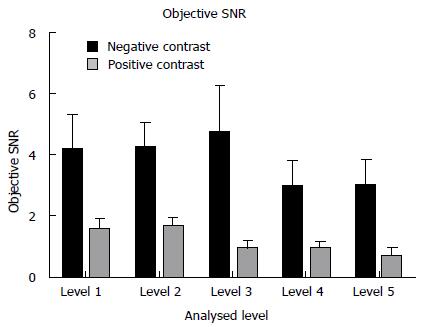
Figure 4 Comparison of objective signal to noise ratio measurements between the neutral and positive studies.
Level 1: Liver at the right hemi-diaphragm level; level 2: Liver at the porta hepatis; level 3: Right renal cortex at the renal hilum; level 4: Psoas muscle at the iliac crest; level 5: Gluteus maximus at the level of the acetabular roof. All neutral measurements were significantly superior.
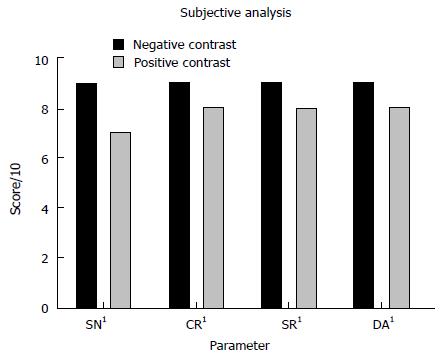
Figure 5 Comparison of median subjective image quality parameters for all neutral and positive studies.
1All neutral measurements were significantly superior. SN: Subjective noise; CR: Contrast resolution; SR: Spatial resolution; DA: Diagnostic acceptability.
- Citation: Murphy KP, Healy LJ, Crush L, Twomey M, Moloney F, Sexton S, O’Connor OJ, Maher MM. Effects of oral contrast on dose in abdominopelvic computed tomography with pure iterative reconstruction. World J Radiol 2016; 8(9): 809-815
- URL: https://www.wjgnet.com/1949-8470/full/v8/i9/809.htm
- DOI: https://dx.doi.org/10.4329/wjr.v8.i9.809


