Copyright
©The Author(s) 2016.
World J Radiol. Sep 28, 2016; 8(9): 785-798
Published online Sep 28, 2016. doi: 10.4329/wjr.v8.i9.785
Published online Sep 28, 2016. doi: 10.4329/wjr.v8.i9.785
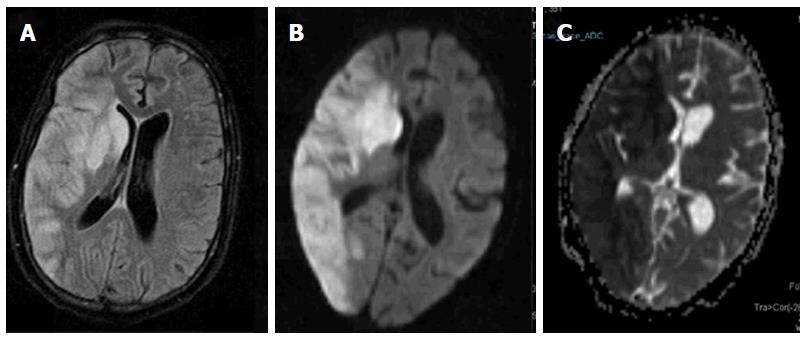
Figure 1 Acute infarct.
Axial FLAIR image (A) shows geographic hyperintensity involving right parieto-occipital region and basal ganglia. Diffusion weighted imaging shows restricted diffusion with high signal on b1000 image (B) and low signal intensity on apparent diffusion coefficient map (C).
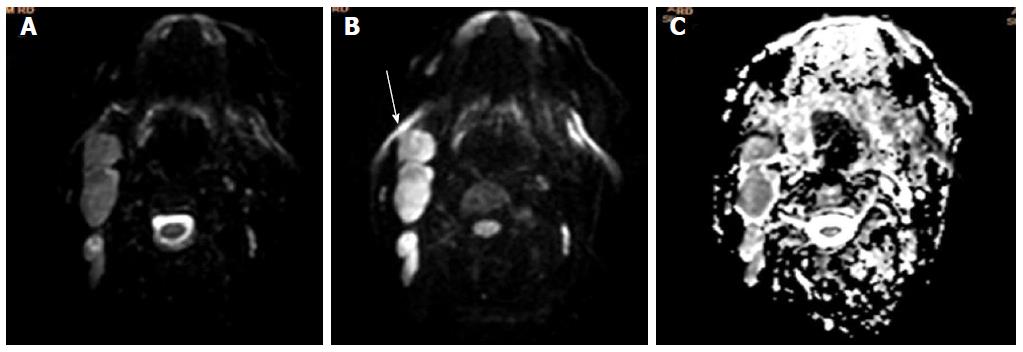
Figure 2 Non-hodgkin’s lymphoma.
Axial b0 (A), b1000 (B) and apparent diffusion coefficient map are showing multiple enlarged neck nodes. Nodes are showing slightly hyperintense signal on b0 images and retaining their signal on b1000 image with low signal on corresponding ADC (C). ADC: Apparent diffusion coefficient.
Figure 3 Carcinoma breast.
Axial T2W fat saturated image (A) is showing a heterogeneously hyperintense mass lesion in right breast. Mass is showing hyperintense signal on b800 image (B), with low signal on apparent diffusion coefficient map (C); dynamic post-contrast MIP image (D) is showing contrast enhancement within the mass with type 3 enhancement curve (E).
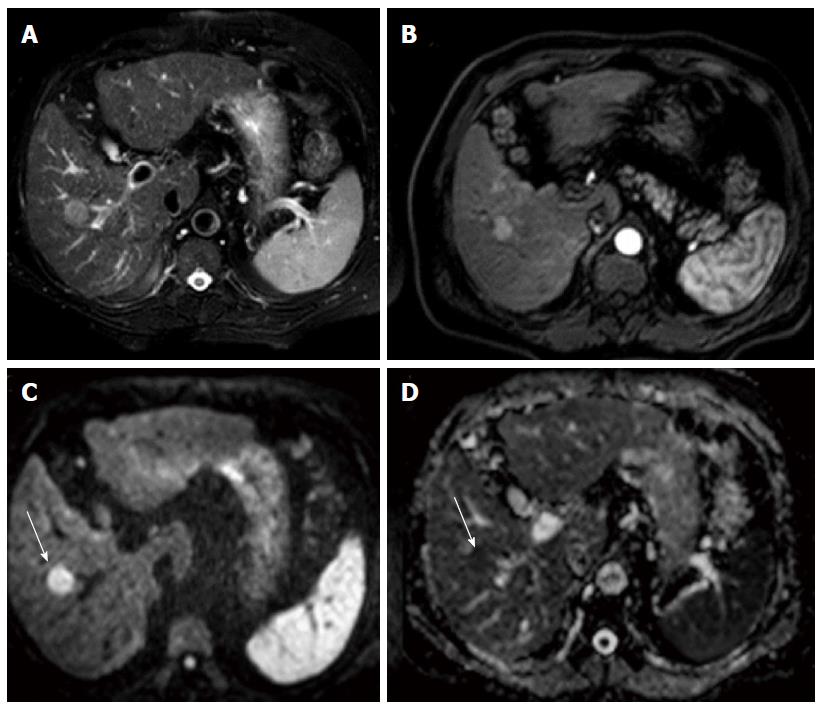
Figure 4 Hepatocellular carcinoma in cirrhotic liver.
Axial T2W image is showing a hyperintense lesion in segment 5 of liver (A); lesion is enhancing in arterial phase (B); and it shows hyperintense signal on b800 image (C) and hypointense on apparent diffusion coefficient map (D).
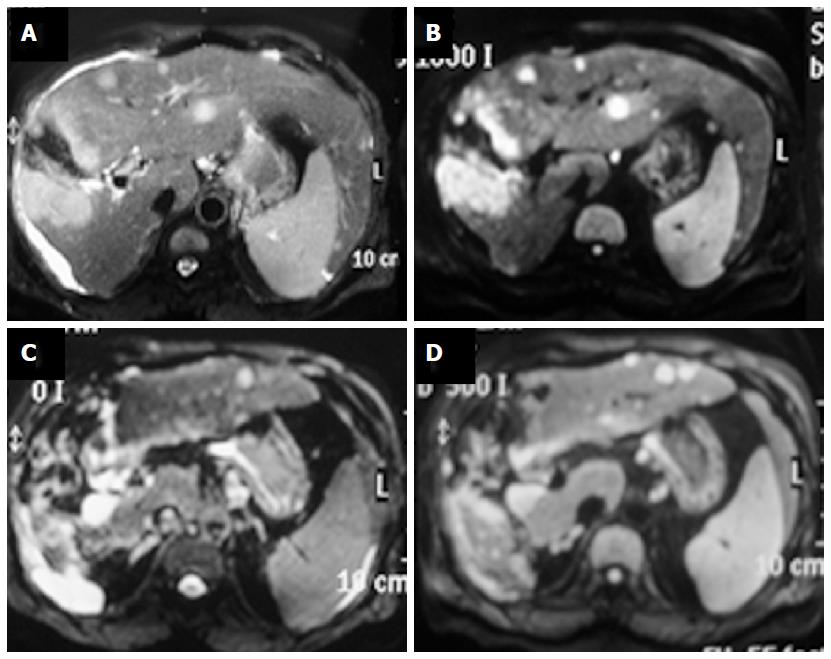
Figure 5 Liver metastases.
Patient with gall bladder carcinoma is showing a large T2 hyperintense mass in gall bladder fossa (A) showing restricted diffusion on b1000 image (B); there are multiple metastatic lesions in liver in segments 2, 3 and 4. These lesions are also showing restricted diffusion. Another important point is the fact that a b500 image (D) is showing more lesion compared to a corresponding b0 image (C).
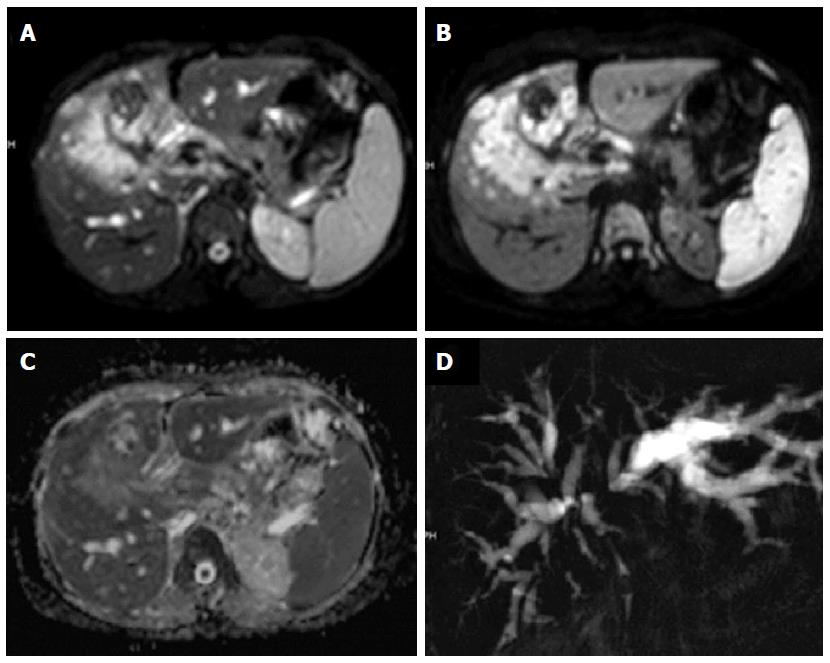
Figure 6 Carcinoma gall bladder.
Axial T2W image showing a large heterogeneously hyperintense mass in gall bladder fossa of liver. It is showing hyperintense signal on b700 image (B) and are showing peripheral hyperintense signal on apparent diffusion coefficient map (C); coronal projectional MRCP image is showing biliary obstruction with involvement of primary and right secondary biliary confluence.
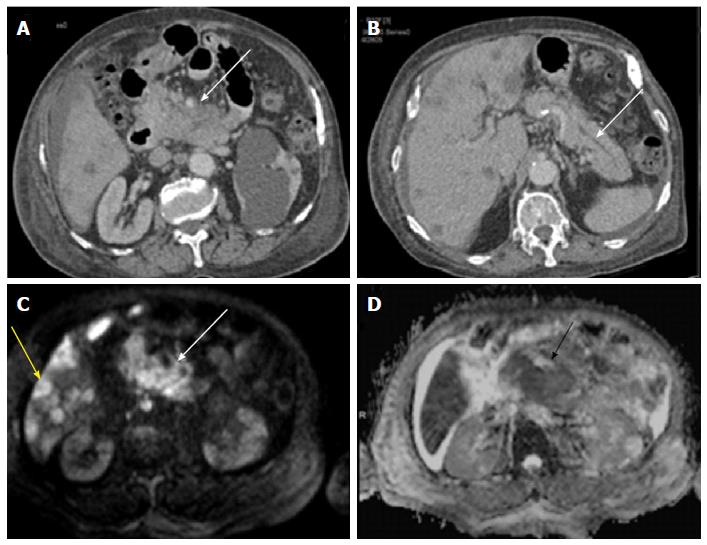
Figure 7 Pancreatic adenocarcinoma.
Axial CECT images showing a hypo-enhancing mass in the neck and head region of pancreas (A) with a dilated pancreatic duct (B); multiple hypodense lesions can be noted within the liver parenchyma. Mass in the neck and head region of pancreas is showing hyperintense signal on b800 image and so are the focal liver lesions (C); corresponding apparent diffusion coefficient map shows hypointense signal within the mass (D).
Figure 8 Renal cell carcinoma vs simple cyst.
Axial contrast-enhanced magnetic resonance image shows non-enhancing bosniak category I cyst in right kidney (arrowhead) and Bosniak category IV cyst (enhancing mural nodules) in left kidney (arrow). Former shows free diffusion with high ADC while latter depicts restricted diffusion with low ADCs. Latter was found to be clear cell renal cell carcinoma. ADC: Apparent diffusion coefficient.
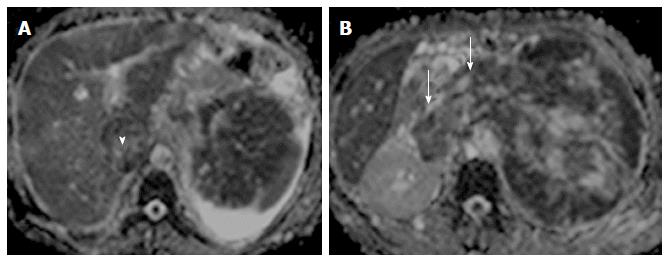
Figure 9 Renal cell carcinoma with malignant inferior vena cava thrombus.
Apparent diffusion coefficient maps (A and B) of a patient with large left renal mass with contiguous extension into renal vein (arrows) and inferior vena cava (arrowhead) (malignant thrombosis). Both the renal mass and intravascular thrombus had similar apparent diffusion coefficient values.
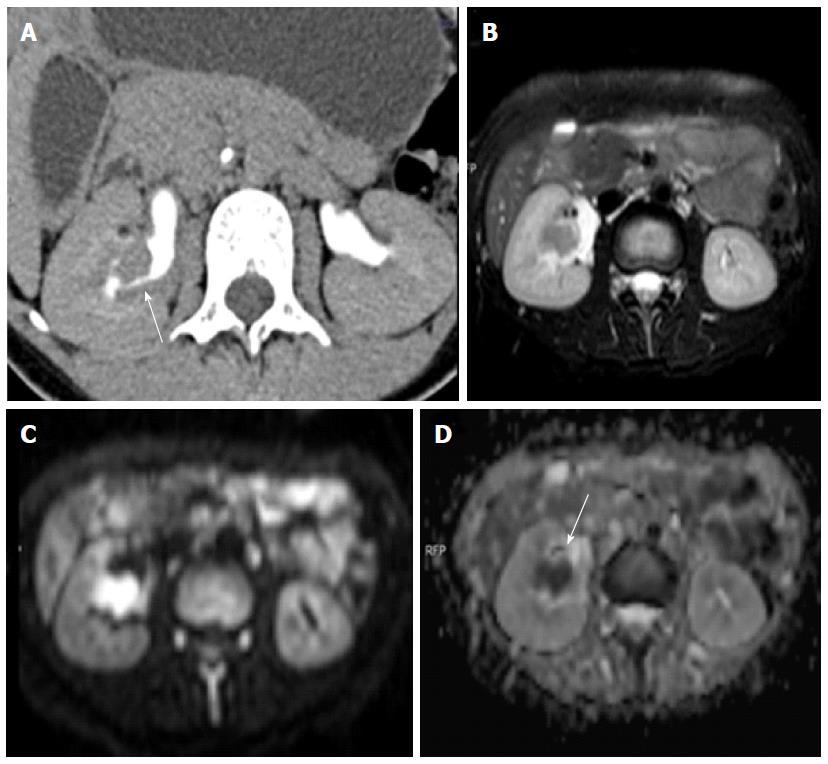
Figure 10 Transitional cell cancer.
Computed tomography urography image (A) shows a filling defect within the mid-pole calyx and infundibular region. Axial T2W image (B) showing a corresponding hypointense lesion showing restricted diffusion on diffusion weighted imaging (C, D).
Figure 11 Carcinoma ovary.
Coronal T2W image shows right adnexal mass with gross ascitis (A); B800 image (B) showing a focal hyperintense peritoneal nodule in left iliac fossa region with corresponding dark signal on apparent diffusion coefficient map (C).
Figure 12 Carcinoma prostate.
Axial T2W image (A) showing central T2 corresponding hypointensity on apparent diffusion coefficient map (C) and high signal on b1000 image (B) suggesting a central gland prostate cancer.
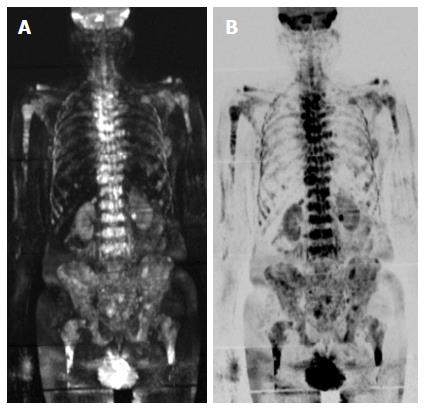
Figure 13 Carcinoma prostate metastases.
DWIBS images showing multiple metastatic lesions within the vertebral bodies, pelvic bones, B/L proximal femur and humerus.
Figure 14 Diffusion tensor imaging images.
It shows ulnar nerve (A) and sacral plexus (B); (C) is showing diffusion tensor imaging of nerve fibers of nerves around elbow.
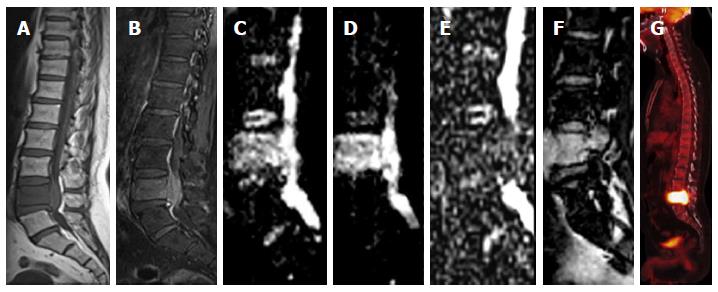
Figure 15 Vertebral metastasis.
Sagittal T1W image (A) is showing diffuse T2 hypointese signal within the L5 vertebral body with corresponding hyperintese signal and associated prevertebral and extradural soft tissue on STIR image (B). Diffusion weighted imaging images (C, D) are showing hyperintense signal with low signal on apparent diffusion coefficient map (E). There is contrast enhancement within the involved vertebra (F) and intense uptake on positron emission tomography image (G).
- Citation: Baliyan V, Das CJ, Sharma R, Gupta AK. Diffusion weighted imaging: Technique and applications. World J Radiol 2016; 8(9): 785-798
- URL: https://www.wjgnet.com/1949-8470/full/v8/i9/785.htm
- DOI: https://dx.doi.org/10.4329/wjr.v8.i9.785


