Copyright
©The Author(s) 2016.
World J Radiol. Sep 28, 2016; 8(9): 764-774
Published online Sep 28, 2016. doi: 10.4329/wjr.v8.i9.764
Published online Sep 28, 2016. doi: 10.4329/wjr.v8.i9.764
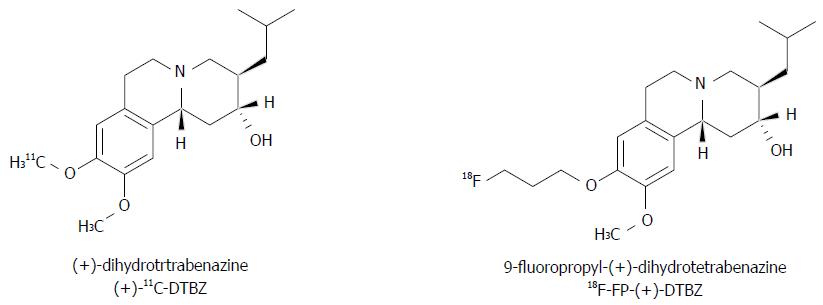
Figure 1 Structures of (+)-11C-DTBZ and 18F-FP-(+)-DTBZ.
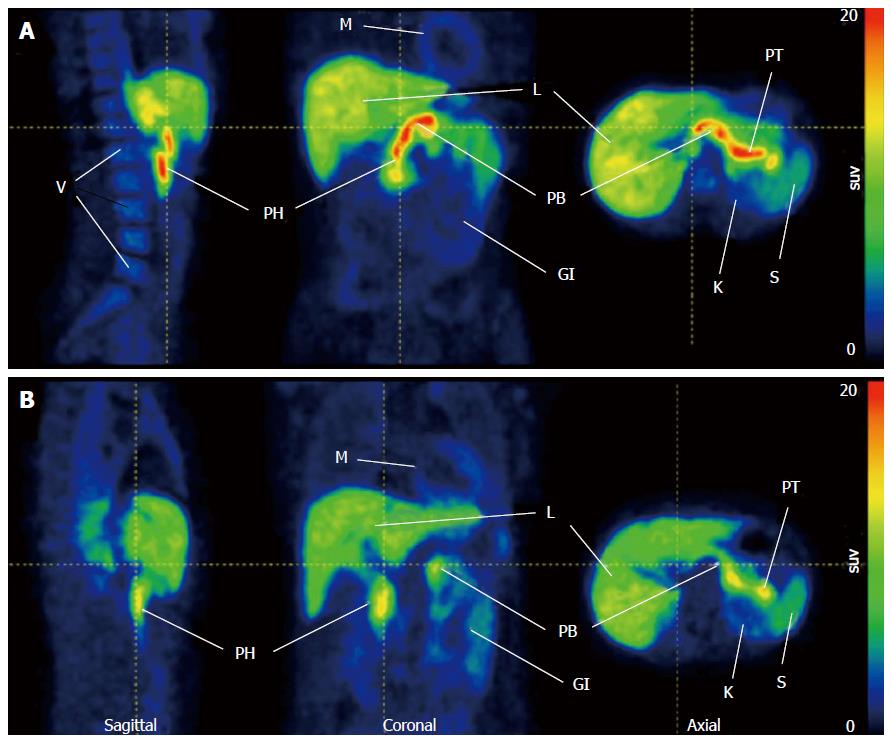
Figure 2 Representative 18F-FP-(+)-DTBZ positron emission tomography images in healthy control subject and type 1 diabetes patient.
A: High uptake in healthy pancreas; B: Compare with health control pancreas, lower uptake was observed in T1D patient. Both images PET data summed 0-90 min p.i. Reprinted with permission from Ref.[14]. GI: Gastrointestinal tract; K: Kidney; L: Liver; M: Myocardium; PB: Pancreas body; PH: Pancreas head; PT: Pancreas tail; S: Spleen; V: Vertebrae; T1D: Type 1 diabetes; PET: Positron emission tomography.
Figure 3 The structures of 18F-TTCO-Cys40-exendin-4 and 64Cu-DO3A-VS-Cys40-exendin-4 as glucagon-like peptide-1 receptor target probes.
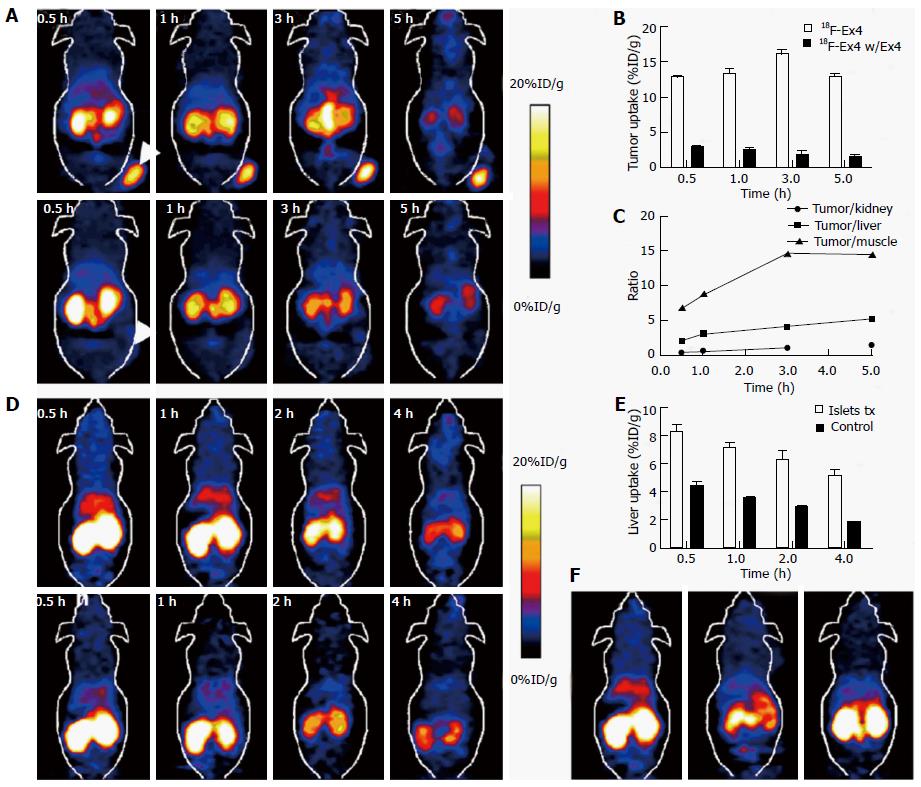
Figure 4 Representative 18F-TTCO-Cys40-exendin-4 positron emission tomography images in NOD/SCID mice.
A: Representative microPET images of 18F-TTCOCys40-exendin-4 (top) and blocking (bottom) for NOD/SCID mice with INS-1; B: Tumor uptakes between control and blocking groups; C: Tumor to organs ratios of radiotracer at different time points p.i.; D: Representative microPET images of tracer in NOD/SCID mice transplanted with human islets into liver (top) and control mice (bottom) at different time points p.i.; E: Liver uptake between intraportal islet transplantation and sham control groups; F: MicroPET mages of mice transplanted with human islets (Left: Control; Middle: Blocking and sham control mice at 1 h p.i.). Reprinted with permission from Ref.[23]. PET: Positron emission tomography.
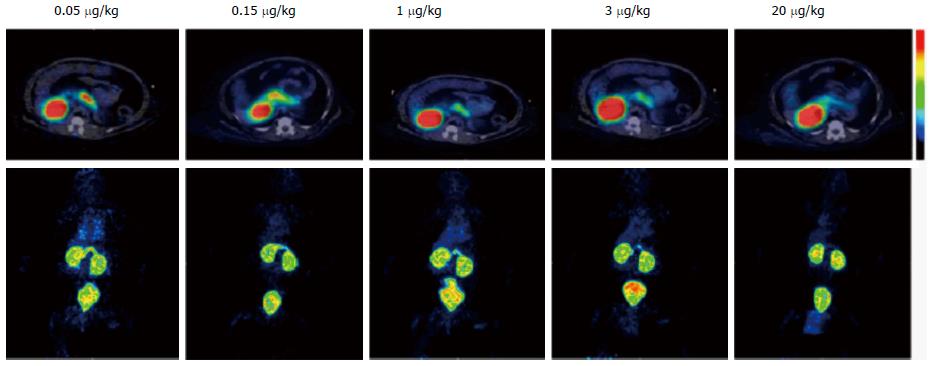
Figure 5 Positron emission tomography/computed tomography images of 68Ga-DO3A-exendin-4 for cynomolgus monkeys.
Increasing concentration of unlabeled peptide resulted in competition for glucagon-like peptide-1 receptor in pancreas only. Transaxial images (dynamic sequences 30-90 min, top row) and whole-body maximum-intensity projections (dynamic sequences 90-120 min, bottom row). Reprinted with permission from Ref. [27].
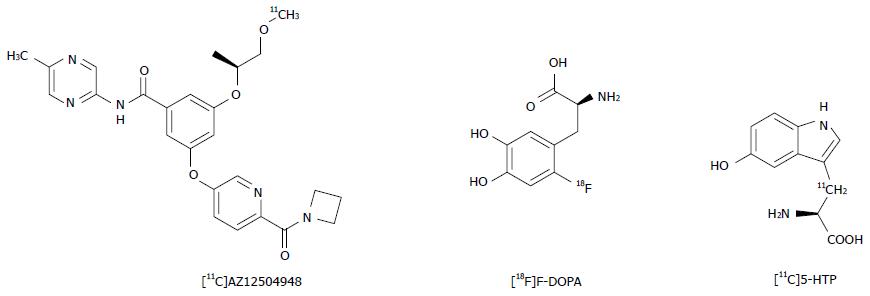
Figure 6 Chemical structures of [11C]AZ12504948, L-3,4-Dihydroxy-6-18F-fluoro-phenylalanine and 11C-5-hydroxy-Ltryptophan.
[18F]F-DOPA: L-3,4-Dihydroxy-6-18F-fluoro-phenylalanine; [11C]5-HTP: 11C-5-hydroxy-Ltryptophan.
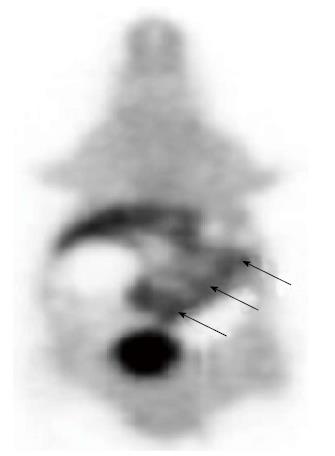
Figure 7 Positron emission tomography imaging of L-3,4-Dihydroxy-6-18F-fluoro-phenylalanine for detection of sites of viable islet cells transplanted in STZ-induced type 1 diabetes nu/nu mouse model.
The images shown irregular distribution of radiotracer uptake at the site of the grafted islet cells in the abdominal wall (black arrows). Reprinted with permission from Ref. [16].
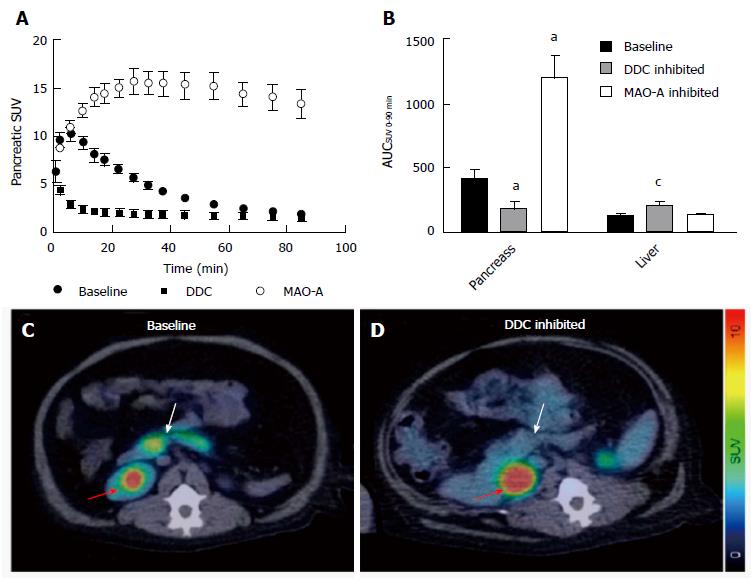
Figure 8 Positron emission tomography/computed tomography imaging of 5-hydroxy-L-11C-tryptophan in non-human primates.
A: SUV of [11C]5-HTP uptake in pancreas of nonhuman primate after 0-100 min p.i.; B: Pancreas uptake was significantly decreased by pretreated inhibitors (aP < 0.05; cP < 0.001); C and D: Abdominal HTP and PET/CT fusion images. Pancreas: White arrow; Kidney pelvis: Red arrow. Reprinted with permission from Ref.[65]. [11C]5-HTTP: 5-hydroxy-L-11C-tryptophan; PET/CT: Positron emission tomography/computed tomography. DDC:Dopa decarboxylase.
- Citation: Li J, Karunananthan J, Pelham B, Kandeel F. Imaging pancreatic islet cells by positron emission tomography. World J Radiol 2016; 8(9): 764-774
- URL: https://www.wjgnet.com/1949-8470/full/v8/i9/764.htm
- DOI: https://dx.doi.org/10.4329/wjr.v8.i9.764


