Copyright
©The Author(s) 2016.
World J Radiol. Jul 28, 2016; 8(7): 668-682
Published online Jul 28, 2016. doi: 10.4329/wjr.v8.i7.668
Published online Jul 28, 2016. doi: 10.4329/wjr.v8.i7.668
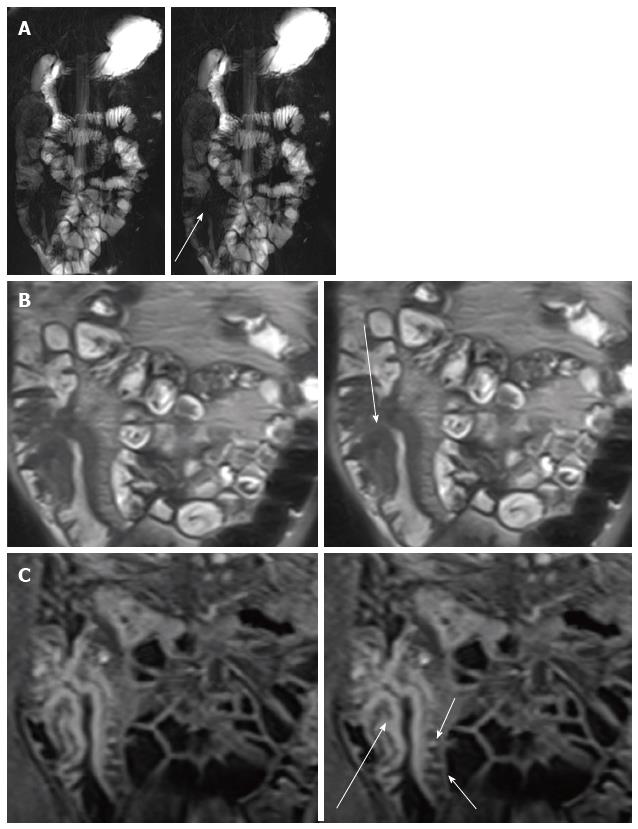
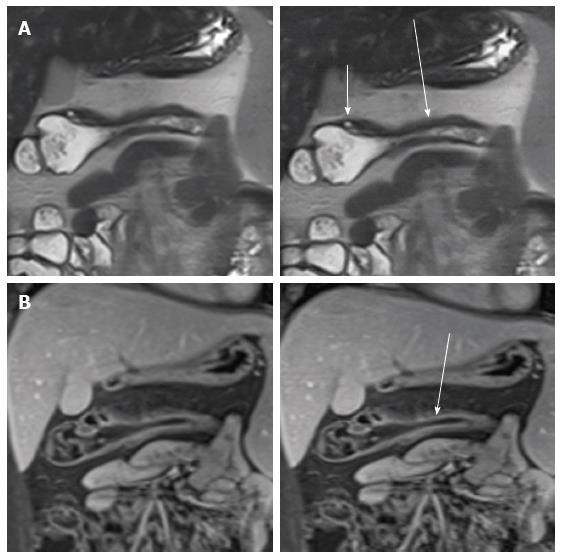
Figure 1 Magnetic resonance enterography in 15-year-old patient with Crohn’s disease.
MR fluoroscopic (∞/950) image A shows luminal narrowing of the terminal ileum (arrow). Coronal half-Fourier RARE (1000/90, 150° flip angle) image; B shows wall thickening of the terminal ileum (arrow). Coronal contrast- enhanced fat-saturated T1-weighted VIBE (4.2/mini-mum, 10° flip angle) image; C shows stratified contrast enhancement with avid enhancement of mucosa relative to submucosal and muscular layers and layered appearance. Note high-signal-intensity linear structure due to increased vascularity close to mesenteric border of the small-bowel segment involved-the so-called comb sign (short arrows). These MR findings are indicative of active Crohn’s disease. MR: Magnetic resonance.
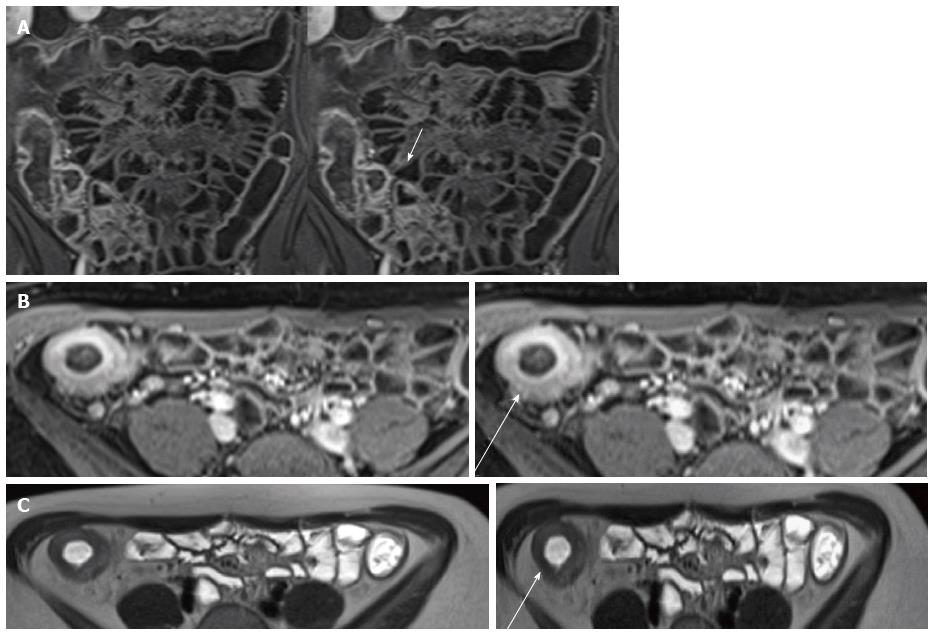
Figure 2 Magnetic resonance enterography in 16-year-old patient with Crohn’s disease.
Contrast coronal T1 GRE A shows marked enhancement of wall of the terminal ileum (arrow). Axial contrast-enhanced fat-saturated T1-weighted VIBE (4.2/mini-mum, 10° flip angle) image; B shows stratified contrast enhancement with avid enhancement of mucosa relative to submucosal and muscular layers and layered appearance (arrow); axial HASTE image C shows wall thickening of the terminal ileum (arrow). GRE: Gradient Echo.
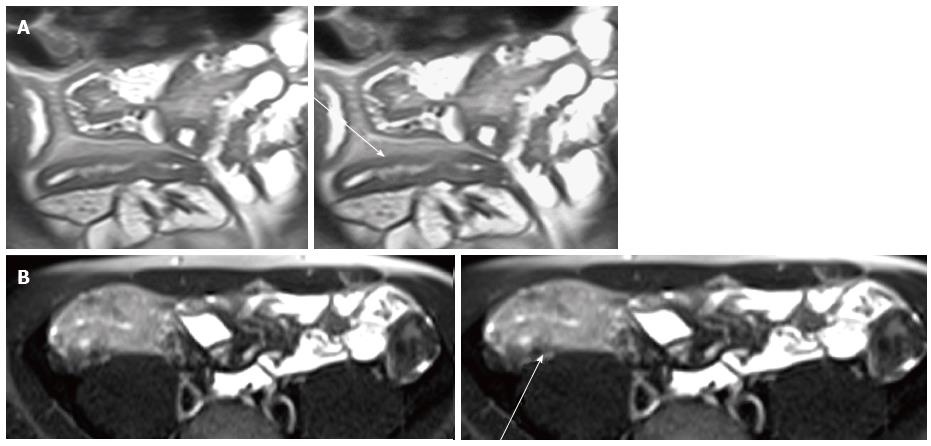
Figure 3 Coronal T2 haste image.
A: Marked thickening of wall of the terminal ileum (arrow). Axial T2 fat-saturated HASTE image; B: Marked hypersignal of wall of the terminal ileum due to edema (arrow).
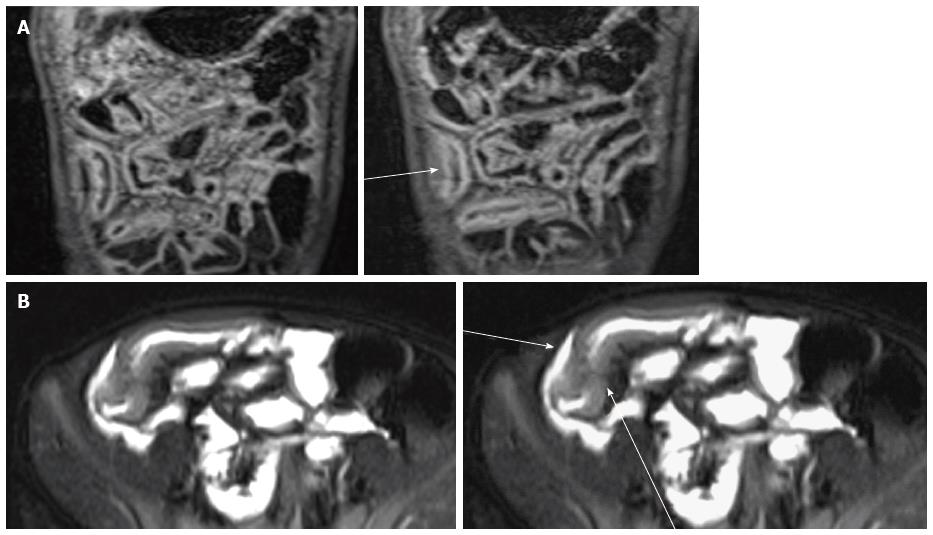
Figure 4 Magnetic resonance enterography in 17-year-old patient with Crohn’s disease.
Coronal GRE image (A) shows marked enhancement of wall of the terminal ileum (arrows). Axial T2 fat-saturated HASTE image (B) (arrow) shows marked hypersignal of the wall due to edema (arrow) with adjacent fluid collection (short arrow). GRE: Gradient Echo.
Figure 5 Magnetic resonance enterography in 15-year-old patient with Crohn’s disease.
Coronal half-Fourier RARE (1000/90, 150° flip angle) A and coronal contrast- enhanced fat-saturated T1-weighted VIBE (4.2/mini-mum, 10° flip angle) B show wall thickening lesions in the middle part of transverse colon (arrow). Coronal T2-w image A shows superficial ulcers that appears as a nidus of high signal intensity (short arrow in B surrounded by a rim of moderate signal intensity. Colonoscopy confirmed these findings.
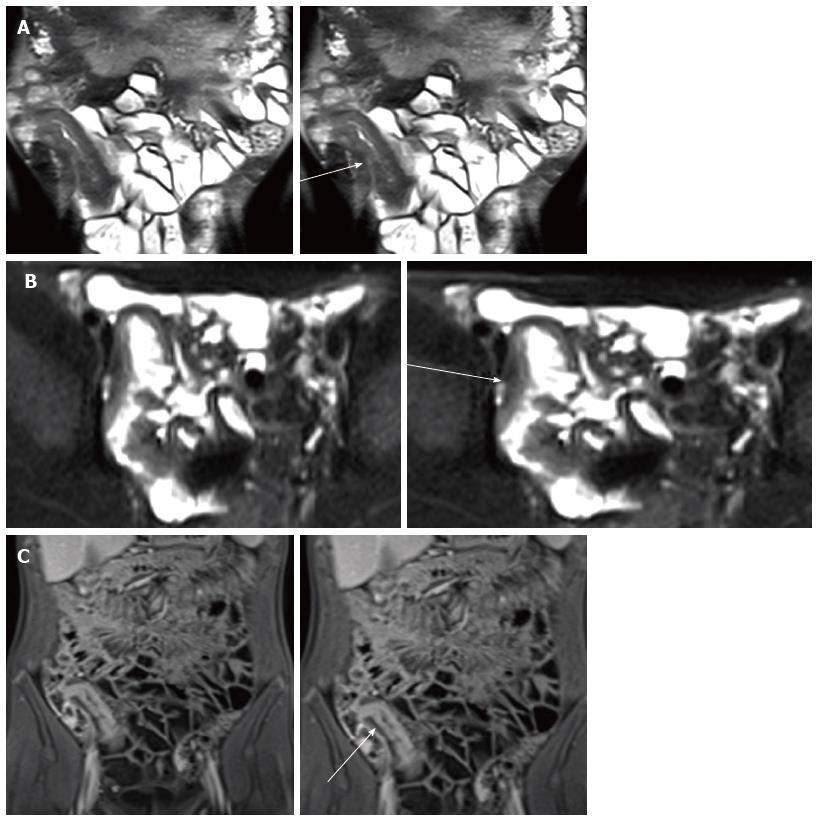
Figure 6 Coronal half-fourier RARE and axial fat sat (1000/90, 150° flip angle) images.
A and B shows wall thickening of the terminal ileum wall (arrows). Coronal contrast-enhanced T1-weighted fat-saturated VIBE (4.2/minimum, 10° flip angle) image C of terminal ileum shows uniform wall enhancement of terminal ileum with abnormal thickness a finding that indicates chronic inflammatory changes (arrow).
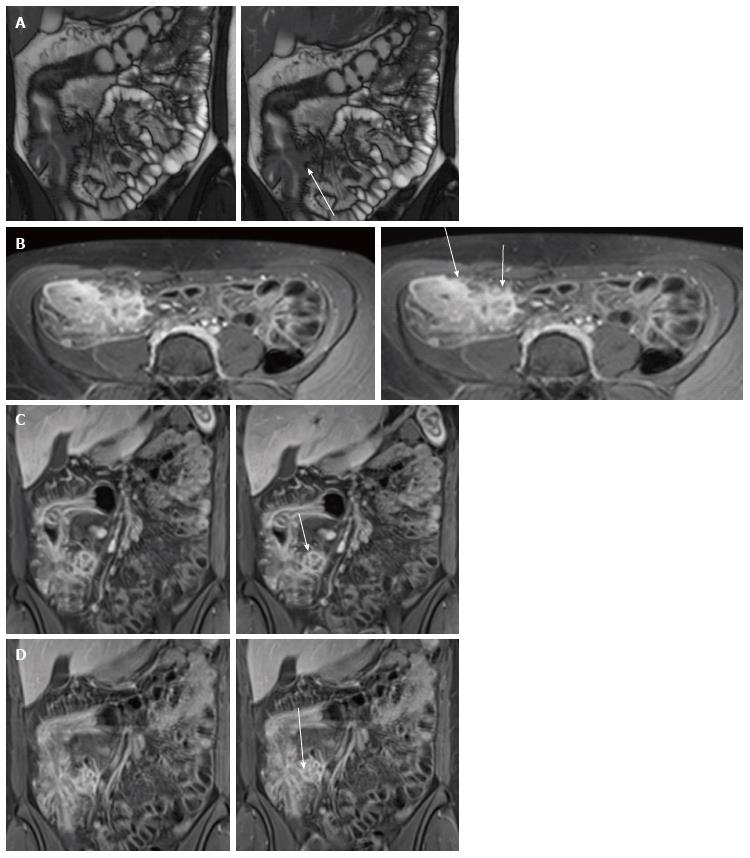
Figure 7 Magnetic resonance enterography in 14-year-old with Crohn’s disease.
Coronal fat-suppressed T2-weighted half-fourier RARE A (1000/90, 150° flip angle) image shows high-signal-intensity edematous wall thickening of terminal ileum. Note inflamed adjacent tissue with hyperintense fluid collection with thick hypointense rim. Axial B and coronal C contrast-enhanced T1-weighted fat-saturated VIBE (4.2/minimum, 10° flip angle) images show marked enhancement of wall of the collection. D Coronal contrast-enhanced T1-weighted fat-saturated VIBE (4.2/minimum, 10° flip angle) image shows marked enhancement of wall of the collection. Note small fistula between the small bowel and the abscess (arrow).
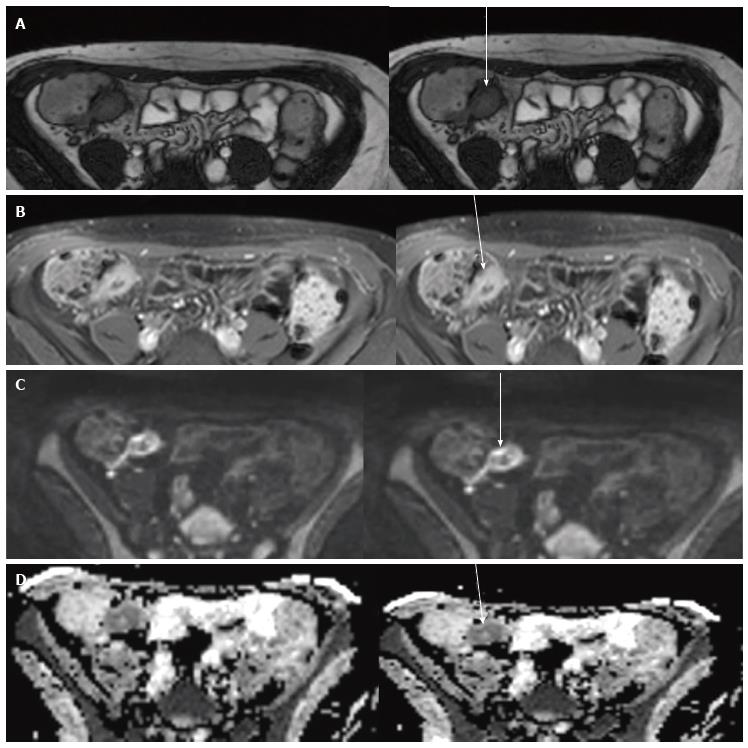
Figure 8 Magnetic resonance enterography of 16-year-old with Crohn’s disease.
Axial true-FISP (4.3/2.2, 50° flip angle) A and contrast axial T1 VIBE B show marked thickening with evidence of enhancement of the wall of terminal ileum, that shows hypersignal on diffusion weighted Imaging (b = 800) image C and restriction of diffusion on ADC map D (arrows).
- Citation: Masselli G, Mastroiacovo I, De Marco E, Francione G, Casciani E, Polettini E, Gualdi G. Current tecniques and new perpectives research of magnetic resonance enterography in pediatric Crohn’s disease. World J Radiol 2016; 8(7): 668-682
- URL: https://www.wjgnet.com/1949-8470/full/v8/i7/668.htm
- DOI: https://dx.doi.org/10.4329/wjr.v8.i7.668


