Copyright
©The Author(s) 2016.
World J Radiol. Jun 28, 2016; 8(6): 571-580
Published online Jun 28, 2016. doi: 10.4329/wjr.v8.i6.571
Published online Jun 28, 2016. doi: 10.4329/wjr.v8.i6.571
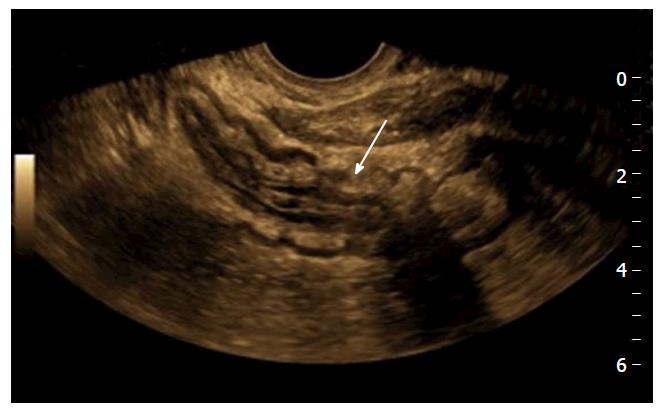
Figure 1 Ultrasound of the pelvis in a 33 years old female with right iliac fossa pain.
There is marked mural thickening of distal ileal loops (white arrow). Imaging findings led to further investigations and a new diagnosis of Crohn’s disease.
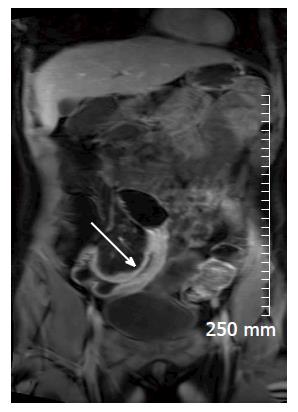
Figure 2 Coronal contrast enhanced T1 weighted image of an acute inflammatory stricture of the distal ileum (white arrow).
There is avid post contrast mural enhancement and wall oedema.
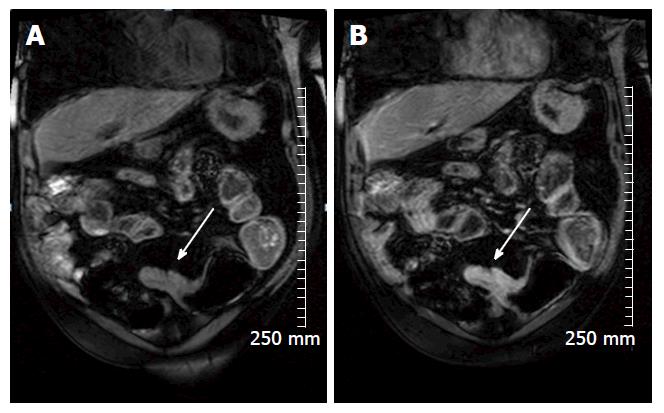
Figure 3 Coronal pre contrast (A) and post contrast (B) T1 weighted images demonstrate avid enhancement of an acute inflammatory stricture in a 69-year-old man with Crohn’s disease (white arrow).
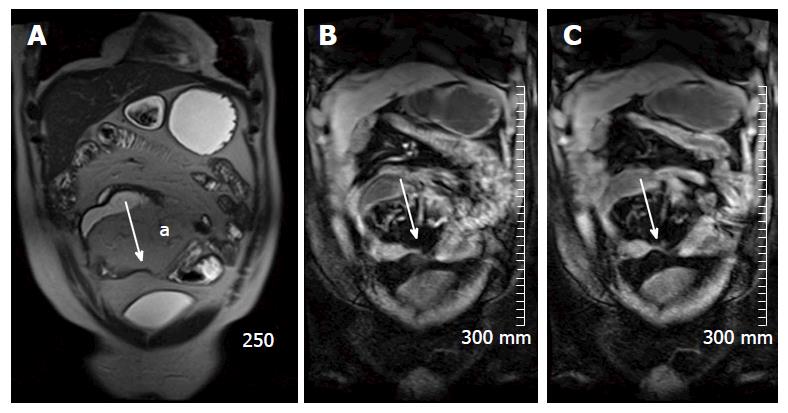
Figure 4 True fast imaging with steady-state precession (A), pre contrast (B) and post contrast (C) TI weighted images of a 43-year-old patient with chronic Crohn’s disease.
Figure 4A demonstrates fatty proliferation of the mesentery (a) and a chronic focal stricture in the distal ileum (white arrow). There is lack of post contrast enhancement demonstrated in (C) (white arrow).
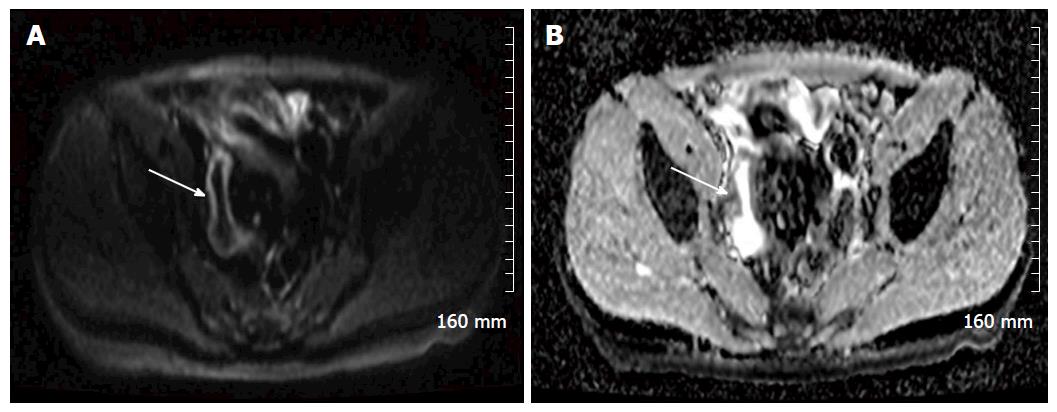
Figure 5 An example of restricted diffusion within the wall of an acutely inflamed distal ileum in a patient with acute Crohn’s disease.
A: A B 800 image, demonstrating hyperintense signal in the mucosa of the distal ileum (white arrow); B: The apparent diffusion coefficient map, and demonstrates corresponding hypointense signal (white arrow).
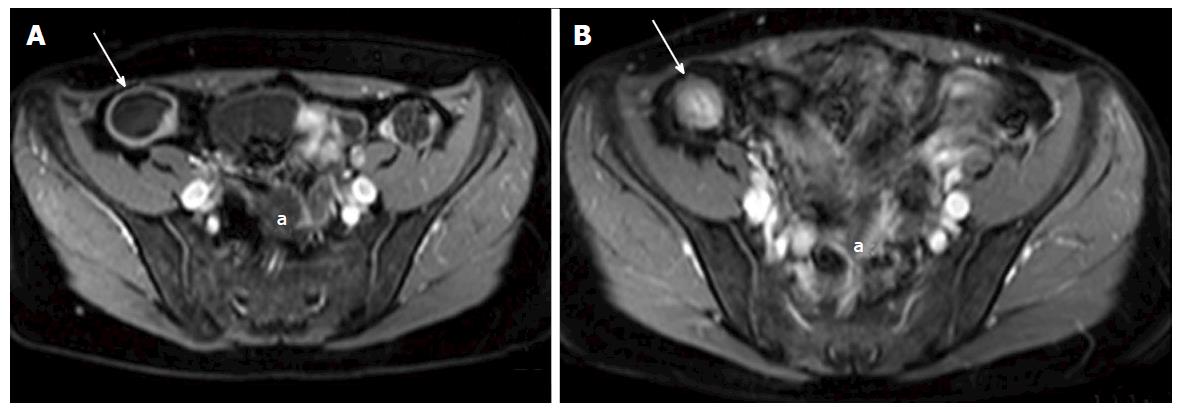
Figure 6 A and B: Axial contrast enhanced T1 weighted images of a 38-year-old female with Crohn’s disease.
A: shows a dilated terminal ileum with avid mural enhancement (white arrow) with further wall enhancing small bowel loops in the pelvis (a); B: Acquired following a course of Azithioprine treatment, and demonstrates a treatment response. The terminal ileum no longer demonstrates mural enhancement (white arrow). There is now relatively hyperintense T1 signal in the wall of the terminal ileum when compared with the mesenteric fat, consistent with fatty infiltration - the “Fat Halo sign”. Pelvic small bowel loops no longer display post contrast mural enhancemen (a).
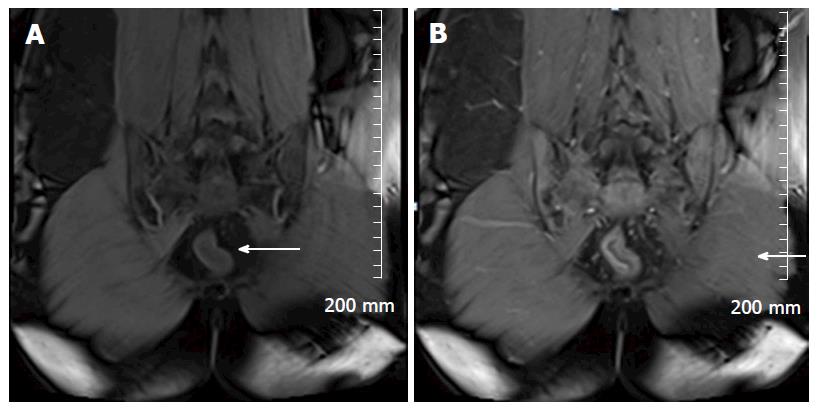
Figure 7 Pre contrast (A) and post (B) contrast coronal T1 weighted images in a 25-year-old patient with ulcerative colitis.
This patient is post total colectomy. Avid early mucosal enhancement of the remaining rectal stump is consistent with acute inflammation (white arrows).
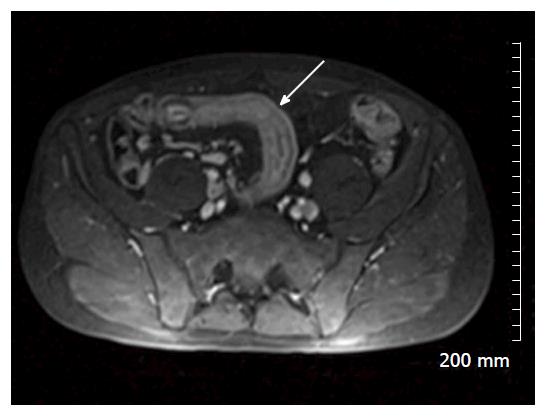
Figure 8 Axial post contrast T1 weighted images of a 34-year-old man with acute Crohn’s disease shows marked mural thickening and enhancement of a loop of distal ilium in the right lower quadrant (white arrow).
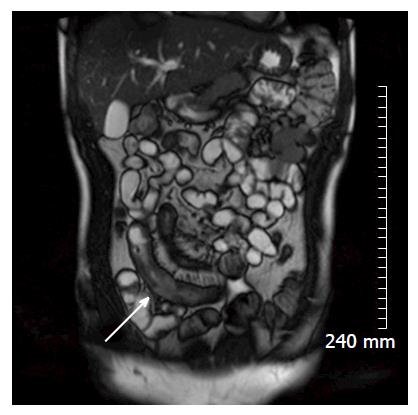
Figure 9 Coronal true fast imaging with steady-state precession image of the same patient showing marked mural thickening of the distal ileum (white arrow).
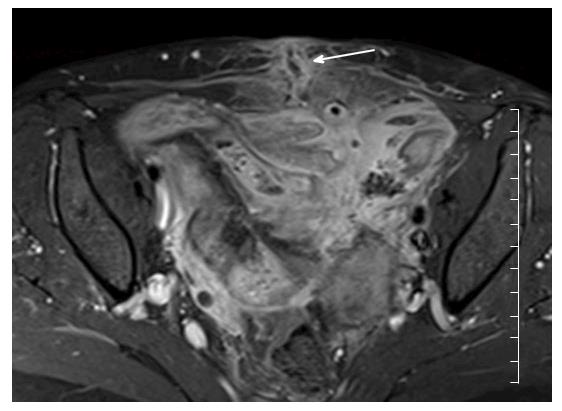
Figure 10 Axial contrast enhanced T1 weighted images demonstrate extensive inflammation and enhancement of small bowel and mesentery in the pelvis in a patient with acute Crohn’s disease.
In this image, there is good delineation of an enterocutaneous fistula extending from pelvic small bowel to the lower anterior abdominal wall in the midline (white arrow).
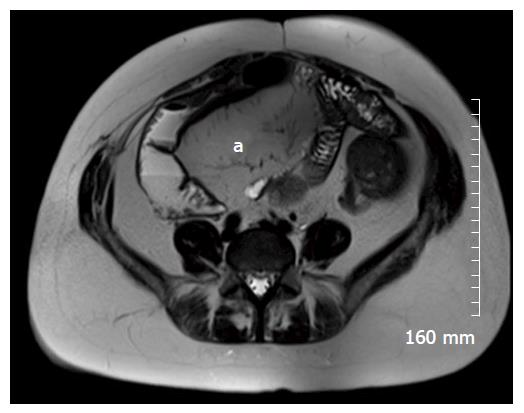
Figure 11 Axial T2 weighted image of 25-year-old patient with Crohn’s disease.
There has been extensive small bowel resection. There is marked fatty proliferation of the mesentery (a), as seen in chronic Crohn’s disease.
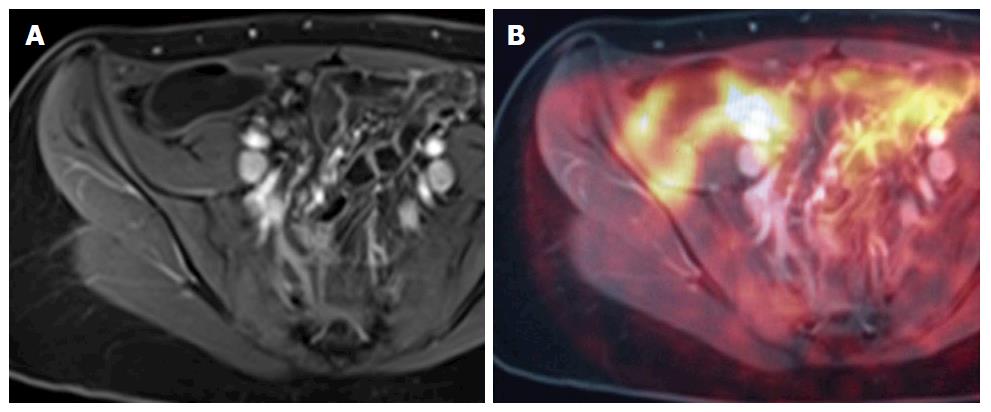
Figure 12 A and B demonstrate positron emission tomography magnetic resonance imaging.
The purpose of this figure is to demonstrate how an magnetic resonance image (A: Axial contrast enhanced T1 weighted image) and a PET image can be fused on a workstation to form an MR-PET image (B: Fused PET and MRI image) in cases where MR and PET images are acquired separately. MRI: Magnetic resonance imaging; PET: Positron emission tomography.
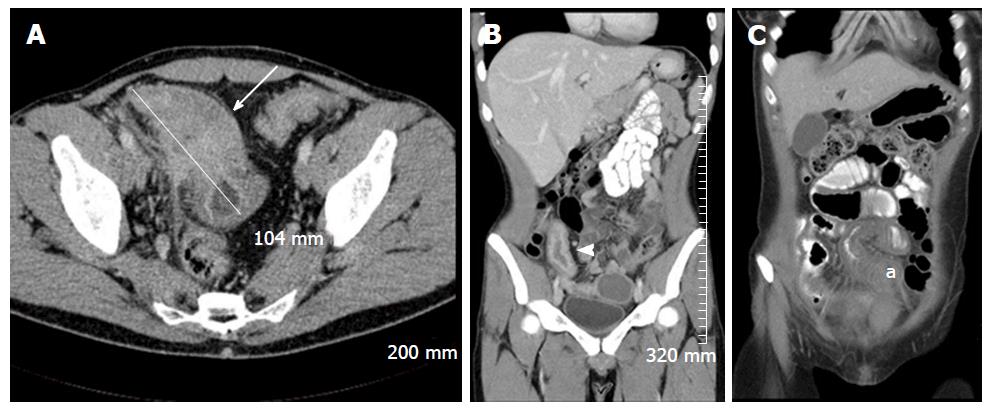
Figure 13 Selected intravenous and oral contrast enhanced computed tomography images of three different patients with acute Crohn’s disease, demonstrating diffuse small bowel mural thickening and enhancement.
A: An axial image demonstrating marked inflammatory thickening of the terminal ileum over approximately 10.4 cm, with extensive adjacent mesenteric stranding (white arrow); B: A coronal image demonstrating marked mural enhancement of a thickened terminal ileum, secondary to terminal ileitis (white arrowhead); C: A coronal image demonstrating inflammatory mural thickening of the mid ileum (a).
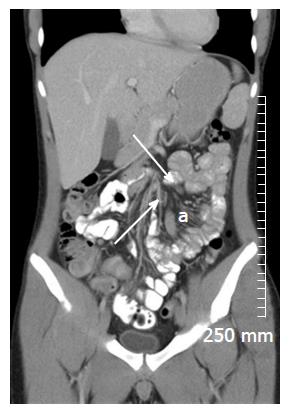
Figure 14 Coronal oral and intravenous contrast enhanced computed tomography demonstrates engorgement of the vasa recta of the small bowel mesentery “The Comb Sign” in acute Crohn’s disease (a).
There is also reactive mesenteric lymphadenopathy (white arrows).
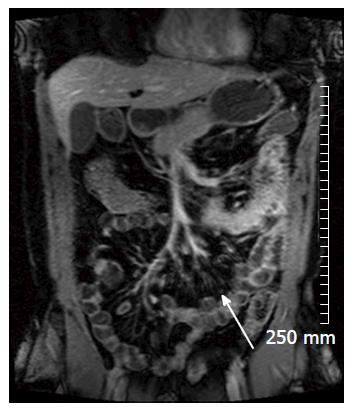
Figure 15 This coronal contrast enhanced T1 weighted magnetic resonance imaging image also demonstrates “The Comb Sign” in a patient with acute Crohn’s disease (white arrow).
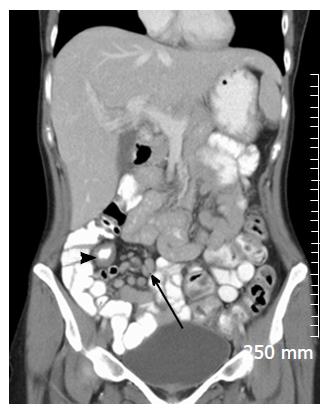
Figure 16 Coronal oral and intravenous contrast enhanced computed tomography image demonstrating bulky reactive adenopathy in the right iliac fossa (black arrow), adjacent to a segment of thickened distal ileum (black arrowhead) in a patient with acute Crohn’s disease.
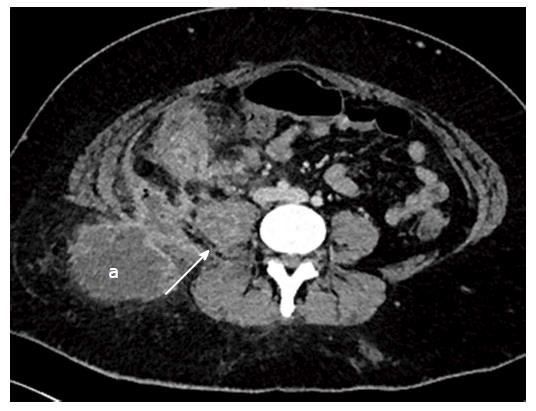
Figure 17 Axial contrast enhanced images of a 29-year-old lady with fistulating Crohn’s disease who presented with a mass in the right gluteal region, and raised CRP.
Computed tomography (CT) demonstrates ileocaecal inflammation associated with an abscess in right psoas (white arrow), extending to the posterior abdominal wall and the subcutaneous fat of the right gluteal region (a). Multiple pockets of air within the abscess indicate a communication between the bowel and the abscess. A pigtail drain was inserted the intra-abdominal component of the collection under CT guidance.
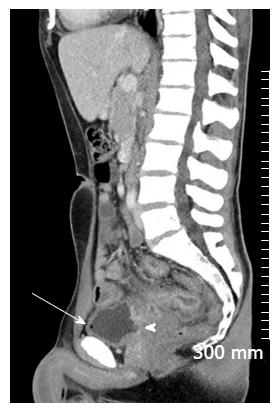
Figure 18 Sagittal oral and intravenous contrast enhanced computed tomography image demonstrating fistulating Crohn’s disease.
There is a wide enterovesical fistula extending from inflamed small bowel to the posterior wall of the bladder (white arrowhead). There is a pocket of air in the bladder (white arrow), indicative of communication with bowel.
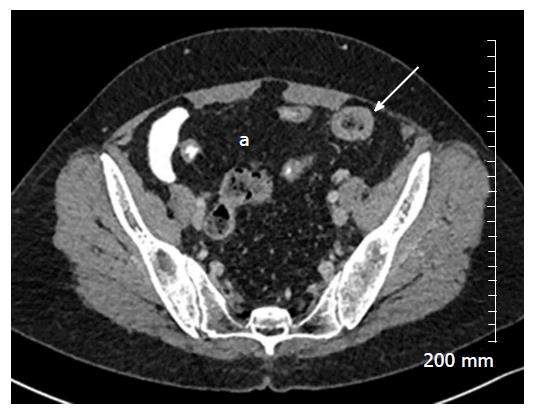
Figure 19 Axial contrast enhanced computed tomography in a patient with chronic Crohn’s disease demonstrating fatty proliferation of the mesentery (a).
A loop of small bowel in the left iliac fossa is thickened, without adjacent stranding, and there is infiltration of fat into the submucosa - the “fat-halo sign” (white arrow).
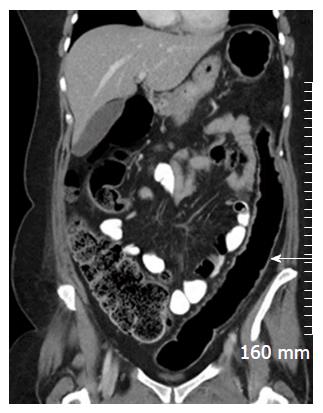
Figure 20 Coronal intravenous contrast enhanced computed tomography demonstrating a prominent, featureless descending colon which is mildly thickened (white arrow) consistent with “the lead pipe sign” seen in chronic ulcerative colitis.
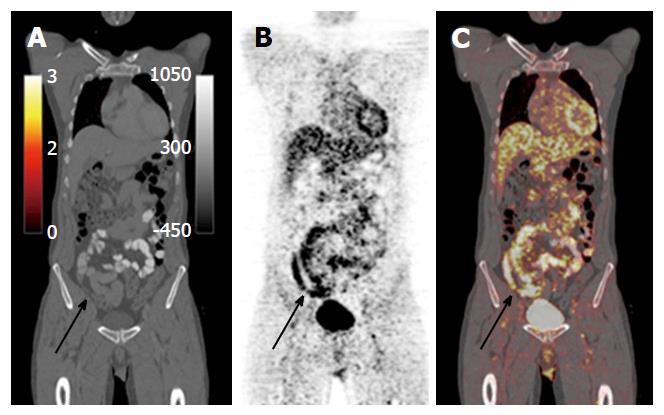
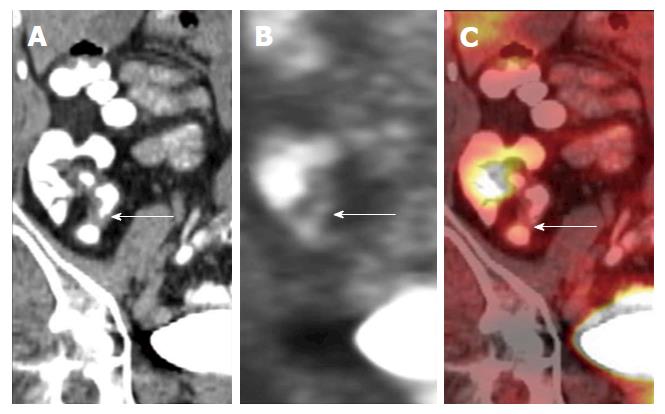
Figure 21 Oral contrast enhanced positron emission tomography computed tomography images in a patient with symptomatic Crohn’s disease shows nonspecific thickening of the distal and terminal ileum on the computed tomography component (A), with corresponding avid fluorodeoxyglucose uptake on the positron emission tomography component (B and C), indicative of acute inflammation.
Figure 22 Coronal positron emission tomography computed tomography images of a patient with quiescent Crohn’s disease.
There is focal thickening of the distal ileum on the computed tomography component. This area of focal thickening does not show any fluorodeoxyglucose uptake on the positron emission tomography component, indicative that there is no significant associated regional inflammation and that this is likely a chronic stricture. Images used with permission from Dr. Martin O’Connell.
- Citation: Stanley E, Moriarty HK, Cronin CG. Advanced multimodality imaging of inflammatory bowel disease in 2015: An update. World J Radiol 2016; 8(6): 571-580
- URL: https://www.wjgnet.com/1949-8470/full/v8/i6/571.htm
- DOI: https://dx.doi.org/10.4329/wjr.v8.i6.571


