Copyright
©The Author(s) 2016.
World J Radiol. Jun 28, 2016; 8(6): 556-570
Published online Jun 28, 2016. doi: 10.4329/wjr.v8.i6.556
Published online Jun 28, 2016. doi: 10.4329/wjr.v8.i6.556
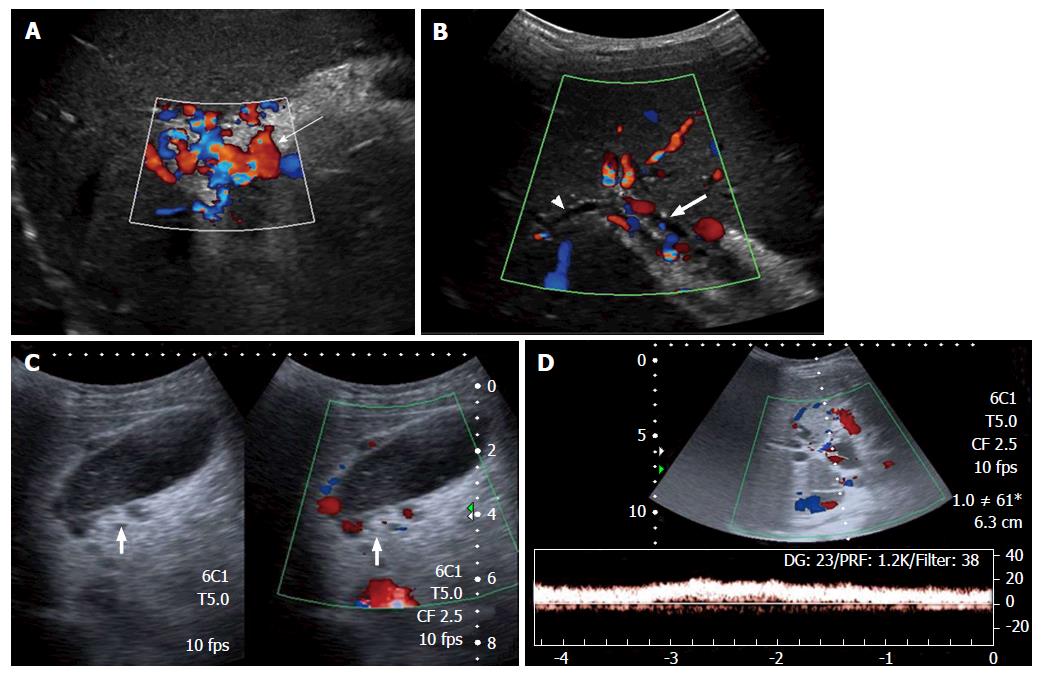
Figure 1 Ultrasonography and Doppler in extrahepatic portal vein obstruction.
A: Doppler showing multiple tortuous portoportal collaterals forming a portal cavernoma (arrow) and replacing the portal vein; B: USG with Doppler showing parabiliary collaterals surrounding the prominent CBD (block arrow) and intrahepatic biliary radicles (arrow head); C: Pericholecystic varices (block arrow) are also noted; D: Spectral Doppler reveals hepatopetal flow with monophasic waveform. USG: Ultrasonography; CBD: Common bile duct.
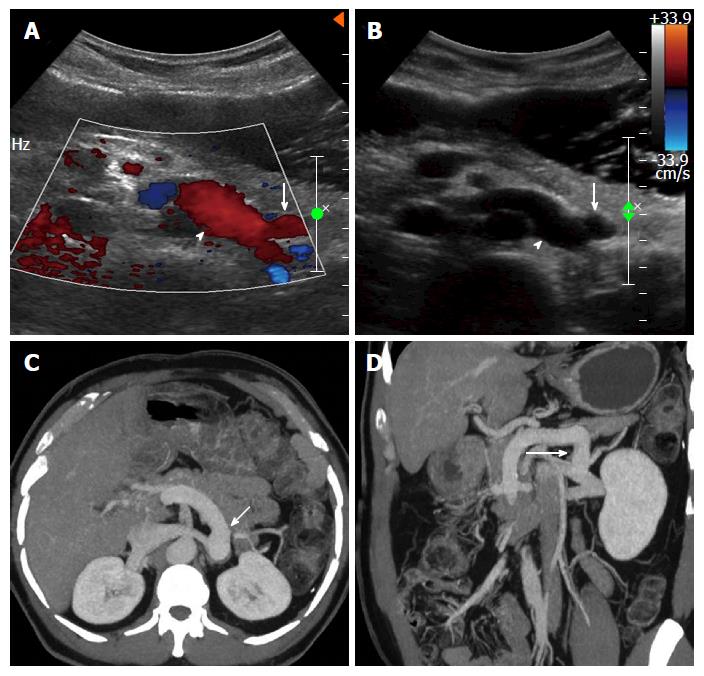
Figure 2 Proximal spleno-renal shunt.
Doppler (A) and gray-scale (B) ultrasound images showing a postoperative patient with patent proximal splenorenal shunt (arrow) draining into patent left renal vein (arrow head), axial (C) and coronal (D) thick maximum intensity projection images clearly demonstrating the shunt (arrow) patency.
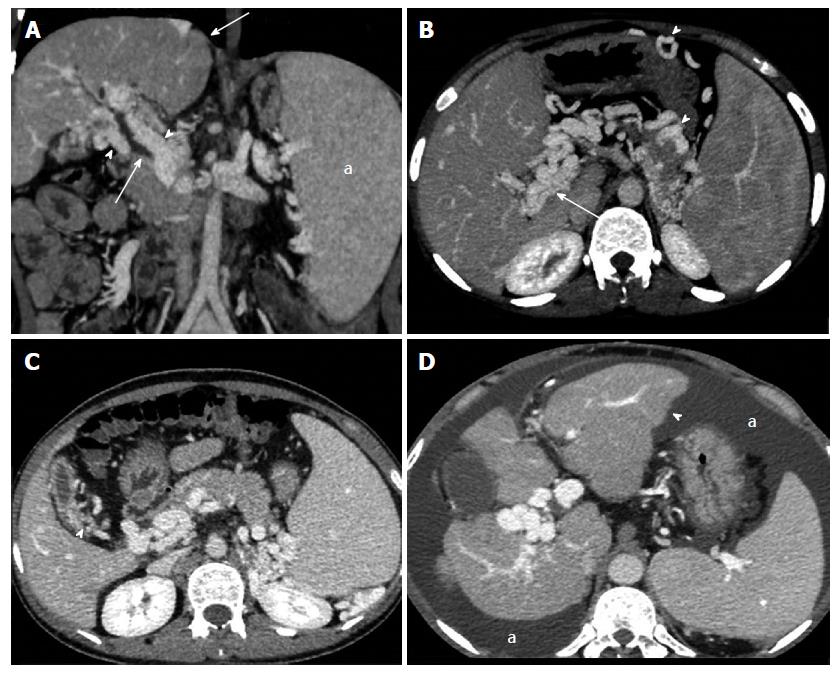
Figure 3 Vascular, biliary and visceral changes on multidetector computed tomography.
A: Coronal image shows paracholedochal collaterals (arrow heads) indenting the biliary tree (thin arrow) and causing upstream biliary dilatation. Note the normal liver outlines (thick arrow) and enlarged spleen (a); B: Thick maximum intensity projection image depicts portal cavernoma formation (thin arrow), perigastric and pancreatic collaterals (arrow heads); C: Contracted gallbladder with pericholecystic varices (arrow head); D: A patient of extrahepatic portal vein obstruction showing lobulated liver contours (arrow head) and ascites (a).
Figure 4 Magnetic resonance portovenography showing portal cavernoma and pancreatic collaterals.
Axial (A) and coronal (B) contrast magnetic resonance images in portovenous phase showing non visualization of portal vein and its intra-hepatic branches with formation of peribiliary varices (arrow heads) causing extrinsic impressions on common bile duct (thin arrow); C: Axial contrast magnetic resonance images revealing multiple tortuous pancreatic collaterals (arrows).
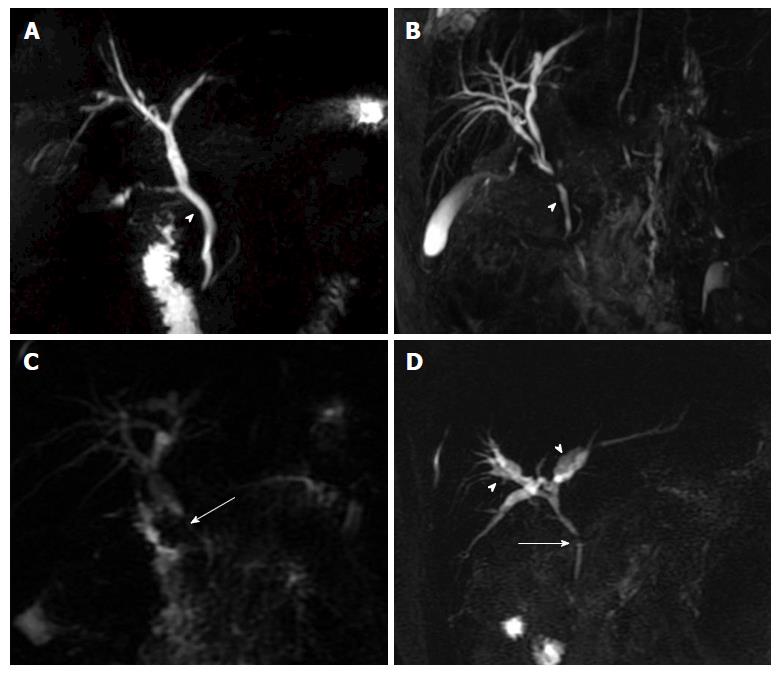
Figure 5 Portal biliopathy changes on magnetic resonance cholangiography.
Thick-slab two dimensional MRC images showing: A: Extrinsic nodular thumb-like impressions (arrow head) on CBD; B: Fine, wavy irregular contour (arrow head) of CBD; C: Stricture (arrow) in supra-pancreatic CBD with upstream dilatation; D: Angulated CBD (arrow) with smooth contour, patent primary confluence and intra-hepatic biliary ductal dilatation (arrow heads). MRC: Magnetic resonance cholangiography; CBD: Common bile duct.
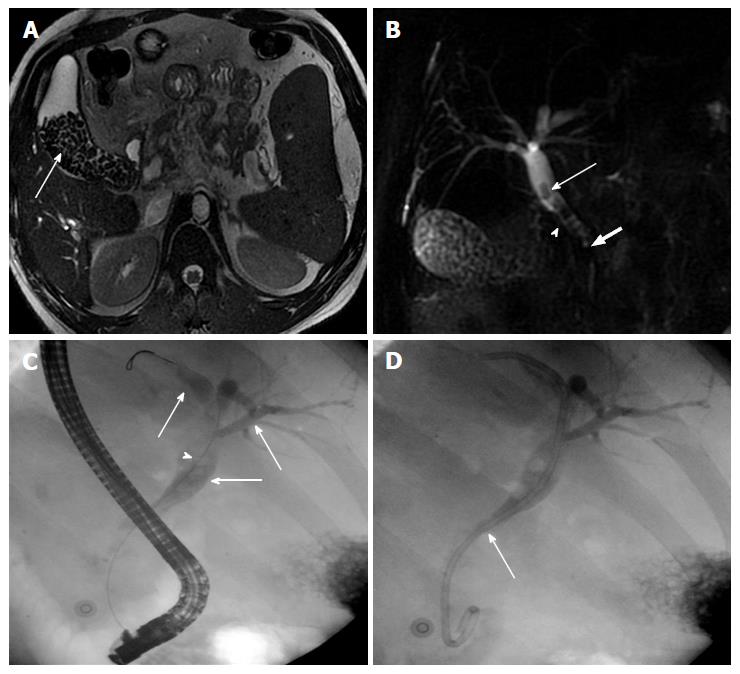
Figure 6 Cholelithiasis and choledocholithiasis.
A: MR Axial T2W gradient recalled echo image showing multiple variable sized calculi (arrow) filling the gallbladder; B: Thick-slab two-dimensional MRC image of the same patient depicting additionally choledocholithiasis (arrow). Also note the irregular CBD contour (arrow head) with angulated appearance of suprapancreatic CBD (block arrow) consistent with biliopathy; C: ERC of this patient shows dilated intra and extra-hepatic biliary system (thin arrow) with multiple filling defects (arrow heads) in CBD consistent with calculi; D: Post stone retrieval and biliary stent placement (thin arrow). MRC: Magnetic resonance cholangiography; CBD: Common bile duct; ERC: Endoscopic retrograde cholangiography.
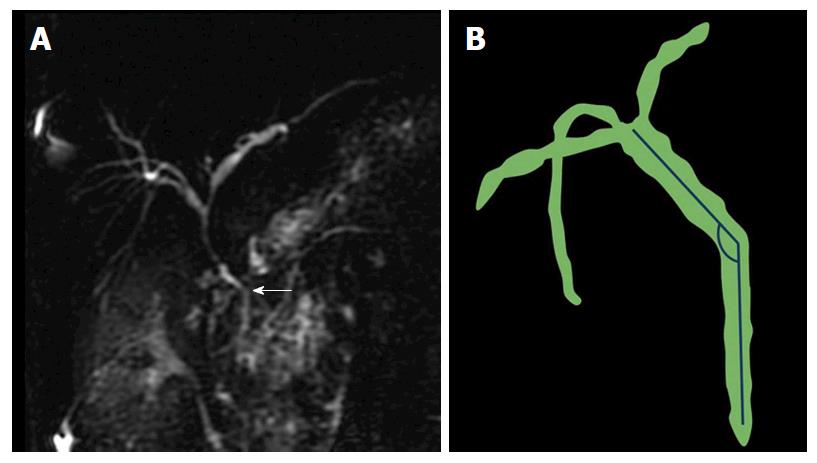
Figure 7 Common bile duct angle measurement.
A: Thick-slab two dimensional MRC image showing kinking and acute angulation (arrow) of suprapancreatic CBD (110°) in a patient of extrahepatic portal vein obstruction; B: Line is drawn along the long axis of CBD with angle measurement at the level of superior edge of pancreatic head. Lesser the value, greater is the CBD angulation. MRC: Magnetic resonance cholangiography; CBD: Common bile duct.
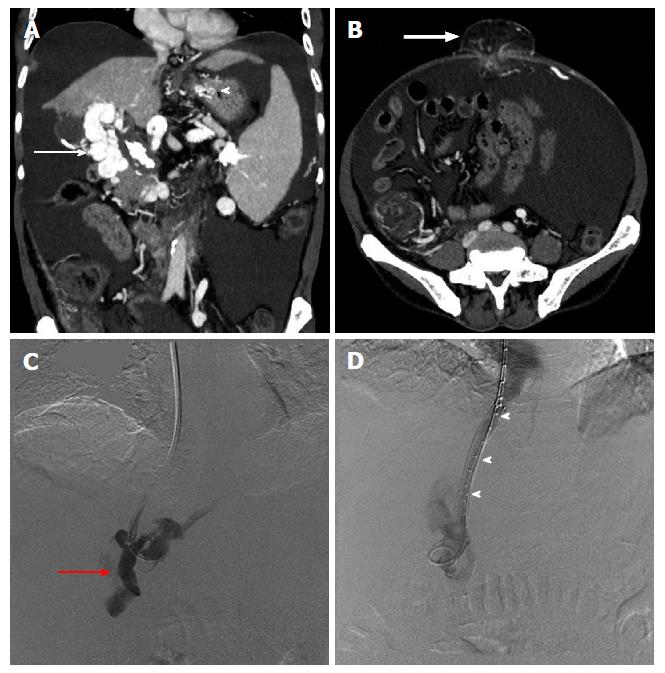
Figure 8 Sixty-year-old male patient, a known case of extrahepatic portal vein obstruction with history of recurrent upper gastrointestinal bleed and umbilical hernia, subjected to transjugular intrahepatic portosystemic shunt procedure in order to reduce blood loss during contemplated future surgical repair of umbilical hernia.
Maximum intensity projection coronal (A) and axial (B) post contrast CT images showing portal cavernoma (arrow), gastric varices (arrow head) and umbilical hernia (bold arrow). DSA images showing portal venogram (C) after accessing portal vein (red arrow) through transjugular approach and post TIPS stent deployment (arrow heads), diversion of portal flow into right atrium via hepatic vein (D). TIPS: Transjugular intra-hepatic portosystemic shunt; DSA: Digital substration angiography; CT: Computed tomography.
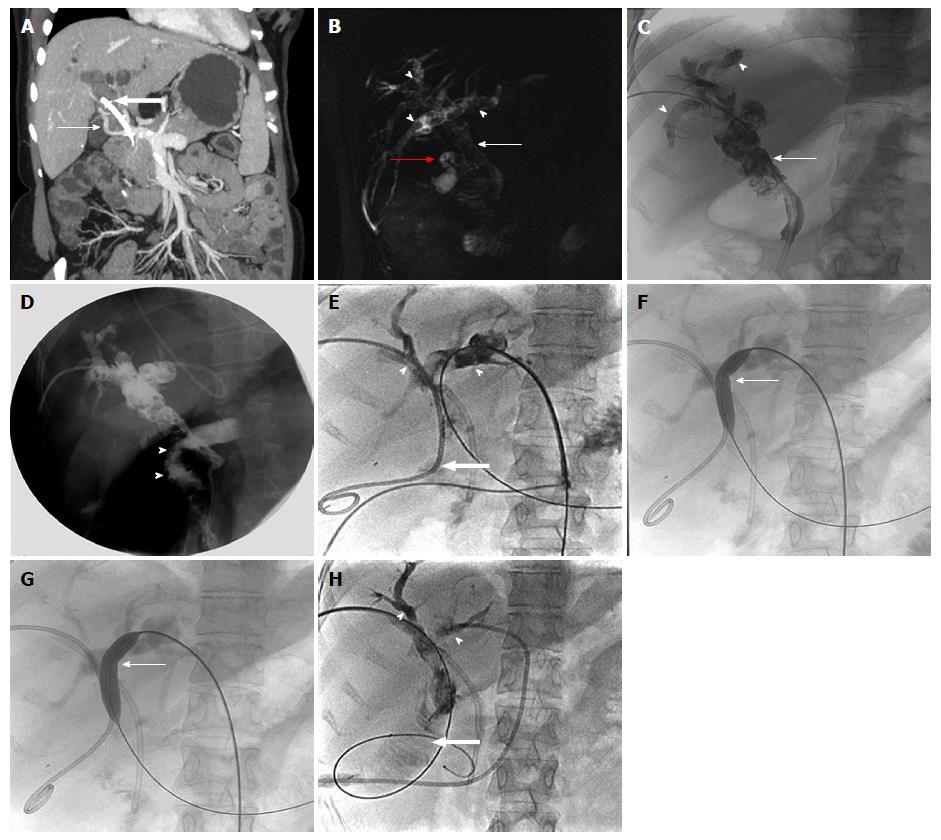
Figure 9 Twenty-five-years-old female, known case of extrahepatic portal vein obstruction with portal cavernoma cholangiopathy.
A: Maximum intensity projection post contrast coronal image showing portal cevernoma (arrow) and changes of PCC in the form of bilobar IHBRD with dilated CBD having stent in situ (block arrow); three-dimensional MRCP image (B) and PTC (C) showing dilated CBD with choledocholithiasis (thin arrow), IHBR dilatation with hepatolithiasis (arrow heads) and cholelithiasis (red arrow); D: Intraoperative cholangiogram after biliary diversion in the form of hepatico-jejunal anastomosis showing free flow of contrast into jejunal lumen (arrow heads); E: Follow-up PTC showing hepatico-jejunostomy anastomotic site stricture (block arrow) with upstream bilobar IHBR dilatation and hepatolithiasis (arrow heads) with faint contrast opacification of jejunal loop (block arrow); F and G: Fluoroscopic spot images showing progressive dilatation of anastomotic site stricture using conventional balloon (thin arrow) with assisted stone clearance; H: Post balloon dilatation and stone clearance, PTC showing relatively better contrast opacification of jejunal loop (block arrow) and relative reduction in amount of IHBRD and hepatolithiasis (arrow heads). CBD: Common bile duct; PCC: Portal cavernoma cholangiopathy; IHBRD: Intrahepatic biliary dilatation; MRCP: Magnetic resonance cholangiopancreatography; PTC: Percutaneous transhepatic cholangiogram.
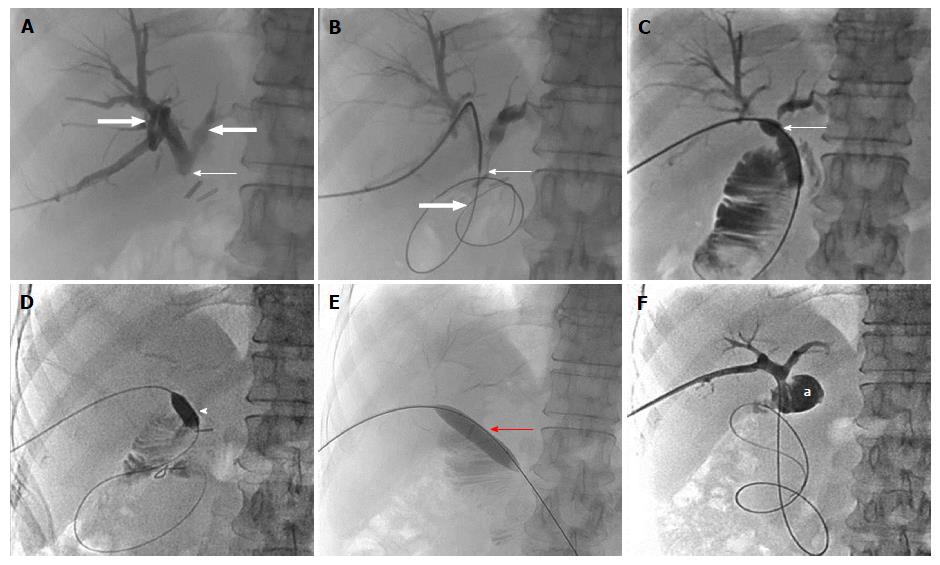
Figure 10 Fifty-four-year-old female, known case of extrahepatic portal vein obstruction with portal cavernoma cholangiopathy, status post hepatico-jejunostomy.
A: PTC showing complete cut-off at the HJ anastomotic site (thin arrow) with upstream bilobar biliary dilatation (block arrows); B: Fluoroscopic spot image showing the anastomotic site stricture (thin arrow) being negotiated using hydrophilic guide wire (block arrow); C: PTC with the help of conventional balloon showing resistent remant stricture at the anastomotic site in the form of persistent waist (thin arrow); D-F: Fluoroscopic spot images during PTC with combined use of cutting balloon (arrow head) and conventional balloon (red arrow) showing complete disappearance of stricture waist resulting into free flow of contrast into jejunal loop (a). PTC: Percutaneous transhepatic cholangiogram; HJ: Hepatico-jejunostomy.
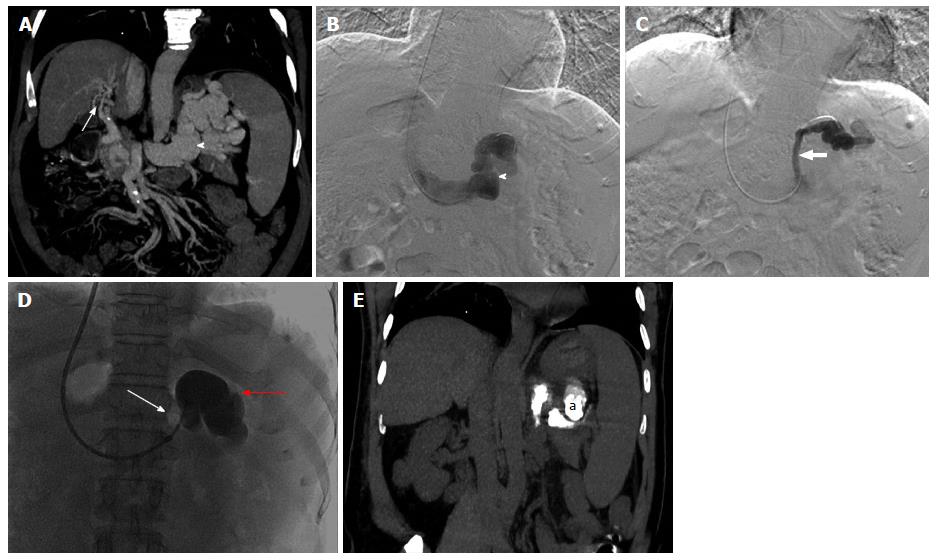
Figure 11 Fifty-year-old male patient, known case of extrahepatic portal vein obstruction with recurrent hepatic encephalopathy and hepatic parkinsonism.
Maximum intensity projection coronal post contrast CT image (A) and DSA images (B and C) showing portal cavernoma formation (arrow), a large gastorenal shunt (arrow head) and another small gastrorenal shunt identified within same patient. DSA image (D) showing balloon occluded (thin arrow) retrograde transvenous occlusion (BRTO) of only the large gastrorenal shunt (red arrow) through transjugular approach with the help of lipoidol-sclerosant foam. Post BRTO, non-contrast CT coronal image showing lipoidol cast (a) within the large gastrorenal shunt (E). BRTO: Balloon occluded trans-venous obliteration; CT: Computed tomography; DSA: Digital substraction angiography.
- Citation: Pargewar SS, Desai SN, Rajesh S, Singh VP, Arora A, Mukund A. Imaging and radiological interventions in extra-hepatic portal vein obstruction. World J Radiol 2016; 8(6): 556-570
- URL: https://www.wjgnet.com/1949-8470/full/v8/i6/556.htm
- DOI: https://dx.doi.org/10.4329/wjr.v8.i6.556


