Copyright
©The Author(s) 2016.
World J Radiol. May 28, 2016; 8(5): 434-448
Published online May 28, 2016. doi: 10.4329/wjr.v8.i5.434
Published online May 28, 2016. doi: 10.4329/wjr.v8.i5.434
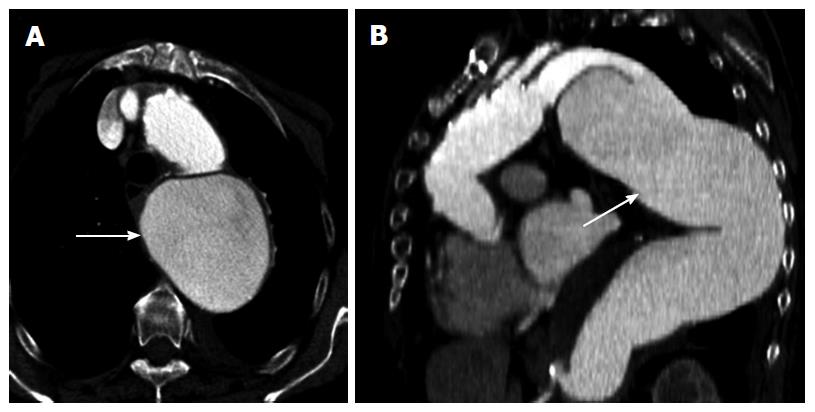
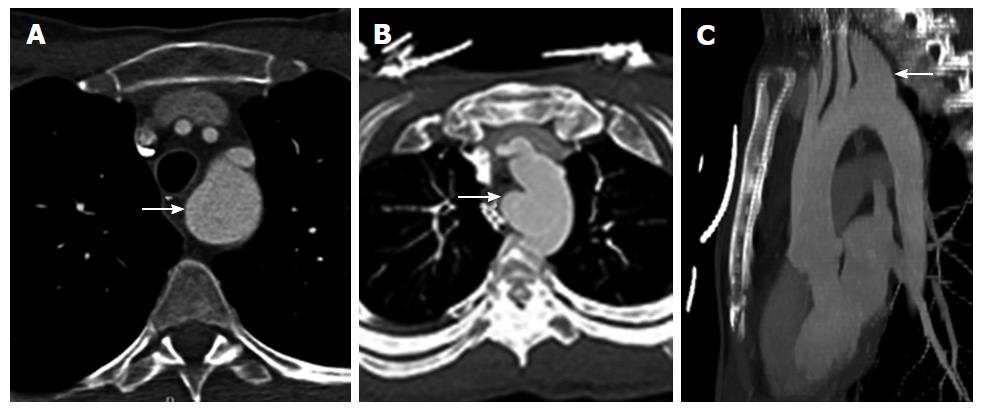
Figure 1 Giant aortic aneurysm.
A: Axial contrast enhanced computed tomography (CT) shows markedly dilated 12 cm aneurysm (arrow) in the proximal descending thoracic aorta; B: Sagittal contrast enhanced CT shows aneurysm (arrow) origin beyond an elephant trunk graft.
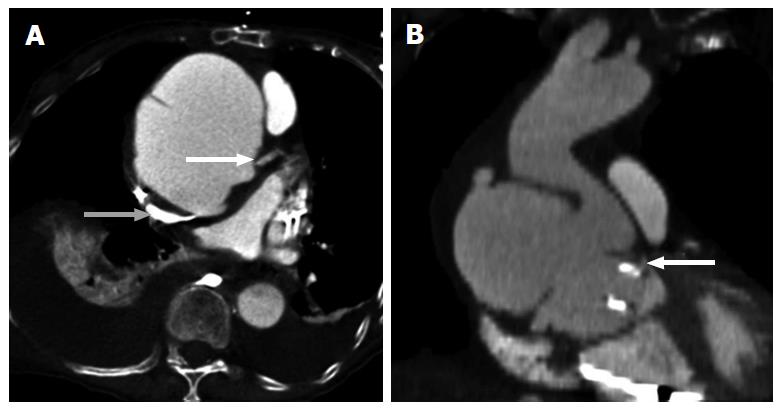
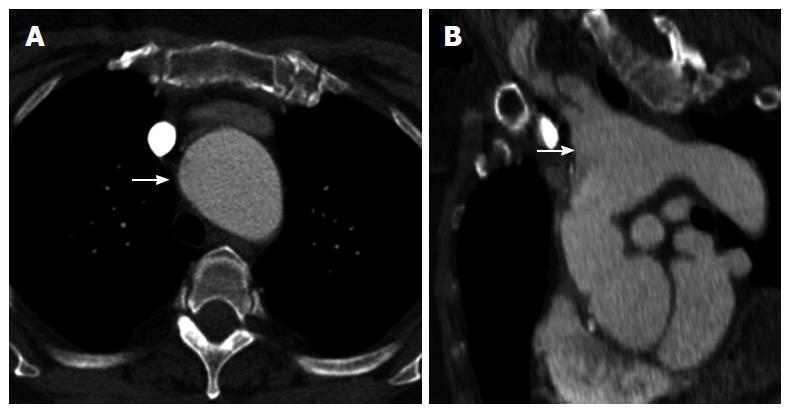
Figure 2 Giant aortic aneurysm with vascular compression.
A: Axial contrast enhanced computed tomography (CT) shows giant aortic aneurysm with dissection resulting in compression of the left main coronary artery (LMCA) ostium (white arrow) and superior vena cava (gray arrow); B: Coronal contrast enhanced CT shows giant aneurysm with dissection compressing the LMCA ostium (white arrow).
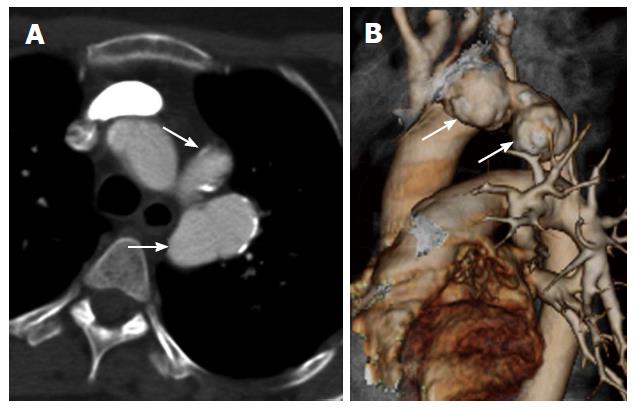
Figure 3 Traumatic aortic pseudoaneurysm.
A: Axial contrast enhanced computed tomography (CT) shows a pair of peripherally calcified pseudoaneurysms at the aortic isthmus (arrows) from remote trauma; B: Three-dimensional volume rendered CT shows a pair of pseudoaneurysms at the aortic isthmus (arrows).
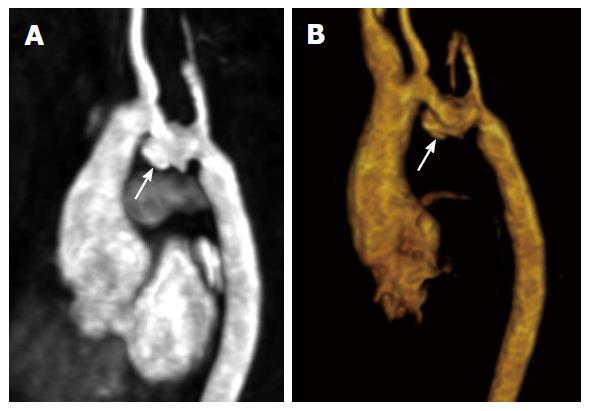
Figure 4 Coarctation repair pseudoaneurysm.
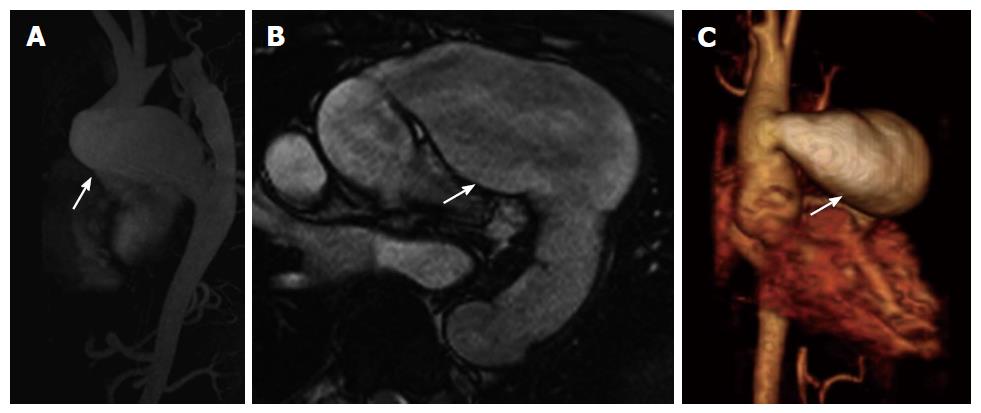
A: Magnetic resonance angiography (MRA) maximum intensity projection reconstruction shows post-ductal aortic pseudoaneurysm (arrow) at the surgical site after coarctation resection and end-to-end anastomosis; B: Three-dimensional volume rendered MRA shows post-ductal aortic pseudoaneurysm (arrow) post coarctation repair.
Figure 5 Aortic pseudoaneurysm after bypass graft.
A: Sagittal contrast enhanced magnetic resonance angiography (MRA) maximum intensity projection reconstruction shows proximal anastomotic pseudoaneurysm (arrow) of the aorta post ascending to descending aortic bypass graft after prior type B aortic dissection; B: Axial contrast enhanced MRA shows proximal anastomotic pseudoaneurysm (arrow) compressing the main pulmonary artery posteriorly; C: Three-dimensional volume rendered MRA shows proximal aortic anastomotic pseudoaneurysm (arrow).
Figure 6 Aortic pseudoaneurysm with aortic conduit.
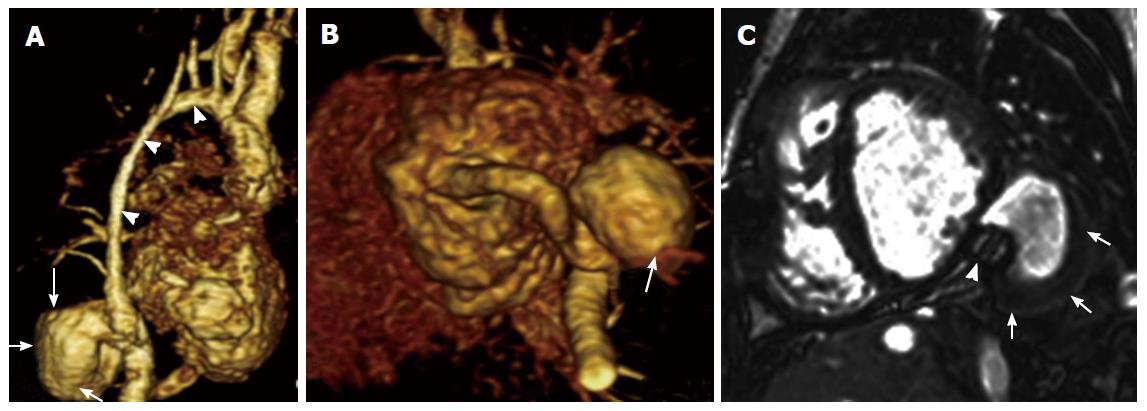
A: Three-dimensional (3D) volume rendered magnetic resonance angiography (MRA) in a patient with a history of trisomy 21, atrioventricular canal defect, and aortic hypoplasia status post left ventricular apex-descending aorta aortic conduit (arrowheads) shows aortic pseudoaneurysm (arrows) distal to the anastomotic site; B: 3D volume rendered MRA shows distal anastomotic site aortic pseudoaneurysm (arrow) post left ventricular apex-descending aorta aortic conduit; C: Short axis contrast enhanced magnetic resonance image shows pseudoaneurysm (arrows) adjacent to the tilted valve of the conduit (arrowhead).
Figure 7 Aortic pseudoaneurysm with sternal erosion.
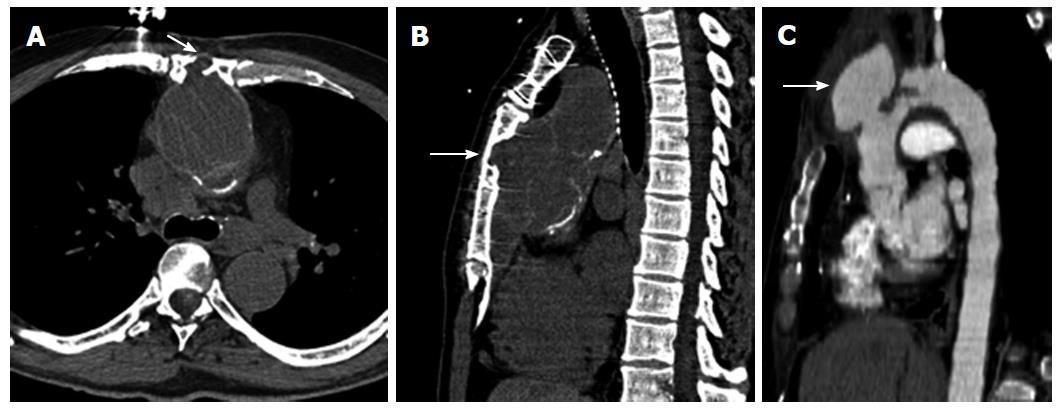
A: Axial non-enhanced computed tomography (CT) shows pseudoaneurysm of the ascending aorta in a patient post aortic graft repair extending to and eroding into posterior aspect of the sternum (arrow); B: Sagittal non-enhanced CT shows large pseudoaneurysm of the ascending aorta occupying a majority of the anterior mediastinum with extension into the adjacent sternum (arrow); C: Sagittal contrast enhanced CT shows filling pseudoaneurysm eroding into the sternum (arrow).
Figure 8 Ductus aneurysm.
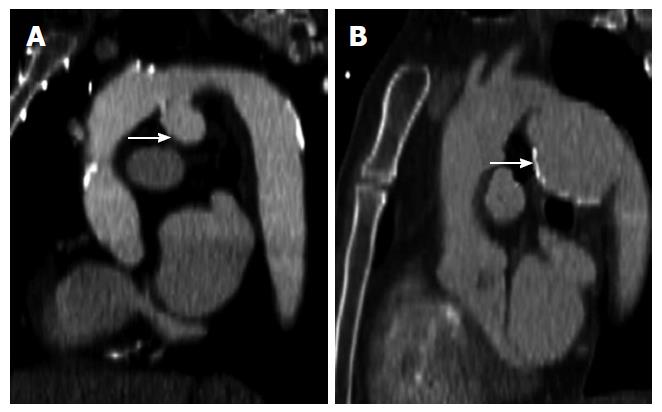
A: Sagittal contrast enhanced computed tomography (CT) shows pseudoaneurysm (arrow) arising from the aortic isthmus and projecting inferiorly in a patient with a history of remote thoracic trauma; B: Sagittal contrast enhanced CT shows large, peripherally calcified ductus aneurysm (arrow).
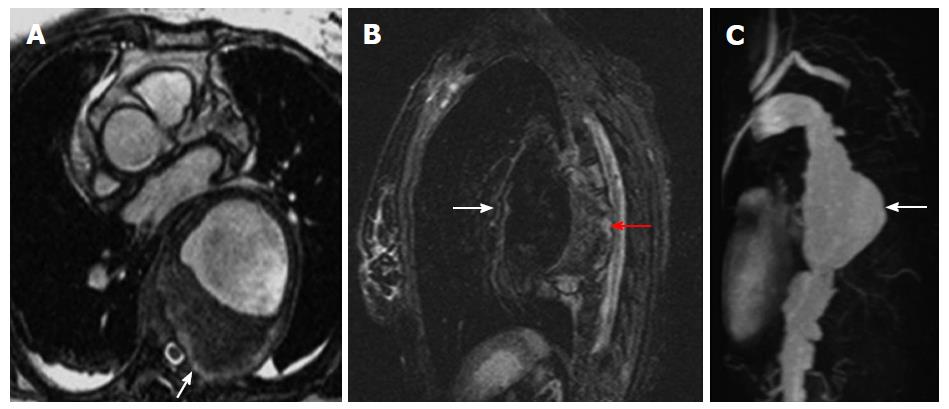
Figure 9 Mycotic aneurysm.
A: Axial contrast enhanced magnetic resonance angiography (MRA) shows large proximal descending aortic aneurysm with eccentric thrombus and invasion of adjacent thoracic vertebral body (arrow); B: Sagittal short tau inversion recovery shows large descending aortic aneurysm (white arrow) with high signal within the wall posteriorly (red arrow) indicating acute inflammation; C: Sagittal contrast enhanced MRA maximum intensity projection reconstruction shows proximal descending aortic mycotic aneurysm (arrow) extending posteriorly.
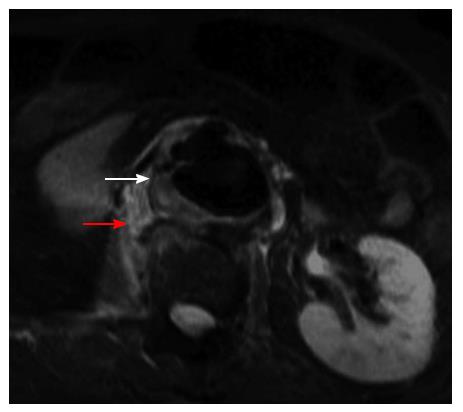
Figure 10 Aortitis aneurysm.
Axial short tau inversion recovery in a patient with Takayasu arteritis shows abdominal aortic aneurysm (white arrow) with wall thickening and high signal (red arrow) indicating acute inflammation.
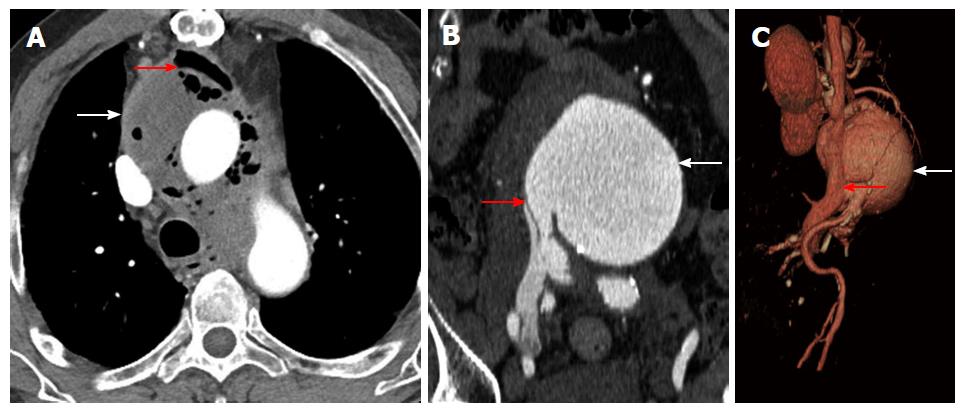
Figure 11 Fistula.
A: Aortoesophageal fistula-axial computed tomography (CT) scan shows multiple gas locules in the ascending aorta (arrows) consistent with aortoesophageal fistula; B: Coronal contrast enhanced CT shows a large abdominal aortic aneurysm (white arrow) near the level of the bifurcation communicating with the inferior vena cava (red arrow), which is isoattenuating to the aorta; C: Three-dimensional volume rendered CT shows abdominal aortic aneurysm (white arrow) with fistulous connection to the inferior vena cava (red arrow).
Figure 12 Left ventricular aneurysm.
A: Short axis magnetic resonance (MR) steady state free precession shows broad outpouching of the lateral wall of the left ventricle representing true aneurysm with associated dark thrombus formation (arrow); B: Four chamber MR delayed contrast enhanced image demonstrates large true aneurysm of the left ventricular apex (arrow).
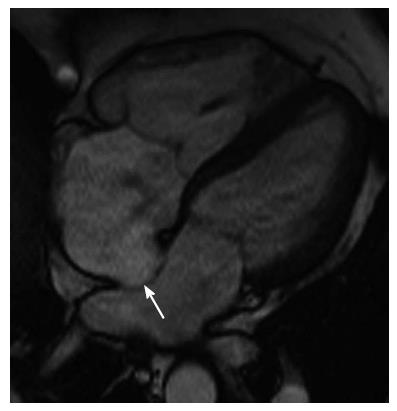
Figure 13 Right ventricular aneurysm.
Four chamber magnetic resonance steady state free precession image shows small true aneurysm at the right ventricular apex (arrow).
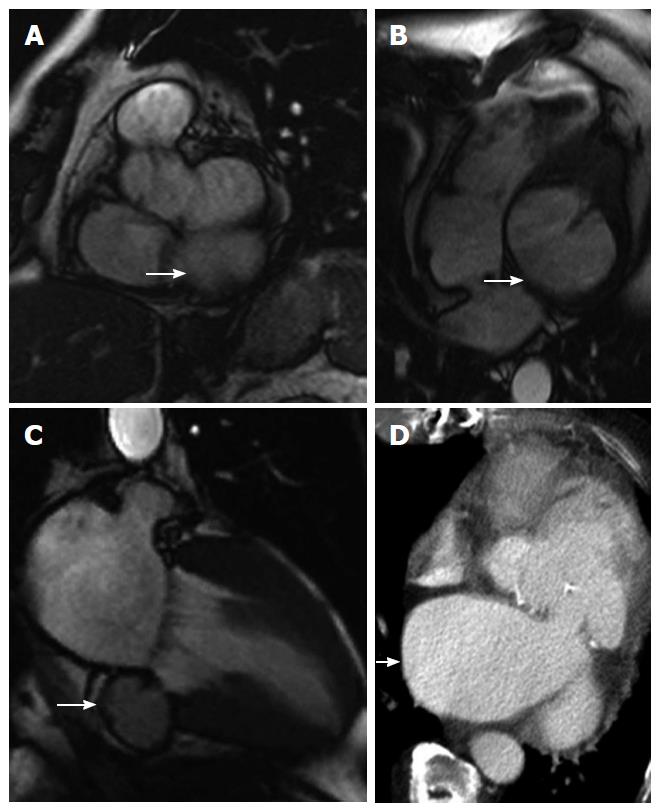
Figure 14 Left ventricular pseudoaneurysm.
A: Short axis magnetic resonance (MR) steady state free precession (SSFP) shows pseudoaneurysm at the basal inferior wall of the left ventricle (arrow); B: Four chamber MR SSFP image shows pseudoaneurysm at the basal inferior wall of the left ventricle (arrow); C: Two chamber MR SSFP shows pseudoaneurysm at the basal inferior wall of the left ventricle (arrow); D: Axial contrast enhanced computed tomography image shows large basal inferolateral wall pseudoaneurysm (arrow).
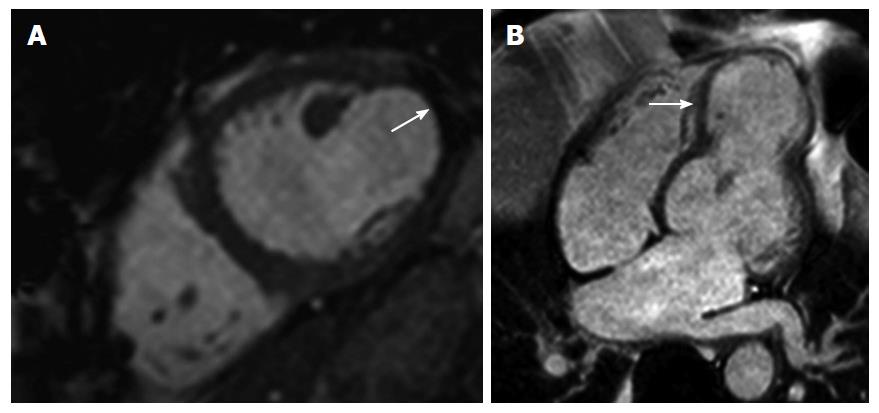
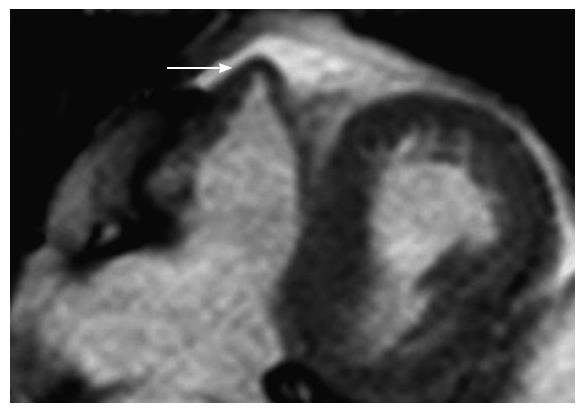
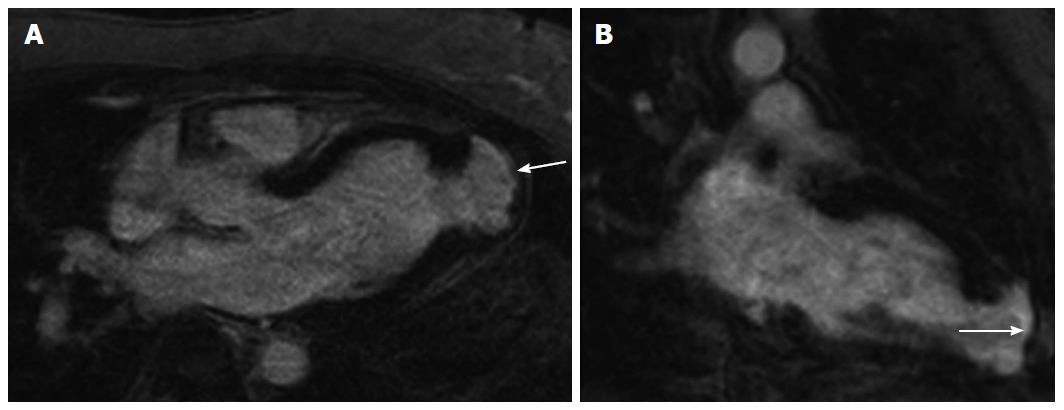
Figure 15 Left ventricular diverticulum.
A: Three chamber delayed contrast enhanced (DCE) magnetic resonance (MR) shows focal outpouching at the left ventricular apex (arrow) in the absence of myocardial scarring. Cine images demonstrated synchronous movement during systole consistent with diverticulum (not shown here); B: Two chamber DCE MR image of the same patient shows left ventricle apical diverticulum (arrow).
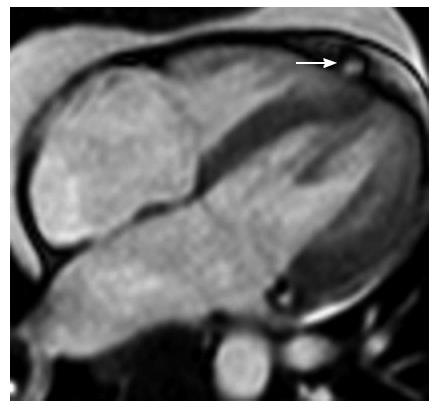
Figure 16 Right ventricular diverticulum.
Four chamber magnetic resonance steady state free precession shows small focal outpouching at the right ventricular apex (arrow). Cine images demonstrated synchronous movement during systole consistent with diverticulum (not shown here).
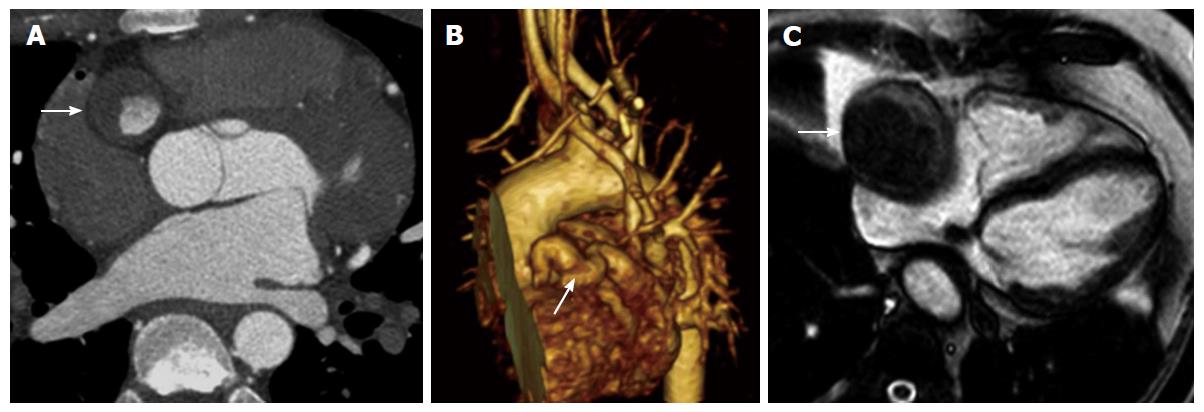
Figure 17 Membranous ventricular septal aneurysm.
A: Coronal contrast enhanced computed tomography demonstrates saccular aneurysm of the membranous portion of the ventricular septum (arrow), protruding into the right ventricle; B: Short axis magnetic resonance (MR) steady state free precession (SSFP) shows saccular aneurysm of the membranous portion of the ventricular septum (arrow); C: Four chamber MR SSFP shows saccular aneurysm of the membranous portion of the ventricular septum (arrow), protruding into the right ventricle.
Figure 18 Interatrial septal aneurysm.
Four chamber magnetic resonance steady state free precession shows broad-based aneurysm of the interatrial septum extending into the left atrium (arrow).
Figure 19 Coronary artery aneurysm.
A: Axial contrast enhanced computed tomography (CT) in a patient with a history of Kawasaki disease shows aneurysm of the right coronary artery (arrow) with significant mural thrombus; B: Three-dimensional volume rendered CT shows aneurysm of the right coronary artery (arrow); C: Four chamber magnetic resonance steady state free precession image in patient with saphenous vein graft to the posterior descending artery shows aneurysm of the graft (arrow) with mural thrombus and mass effect posteriorly onto the adjacent right atrium.
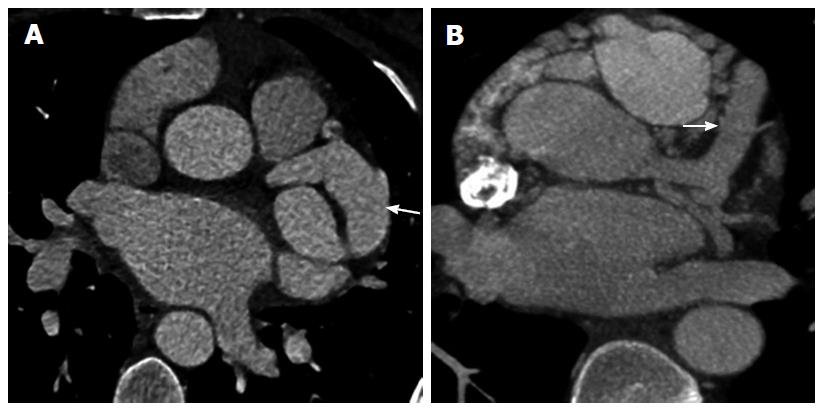
Figure 20 Diffuse coronary ectasia.
A: Axial contrast enhanced computed tomography (CT) shows diffuse fusiform enlargement of the left circumflex artery (arrow); B: Axial contrast enhanced CT shows multiple dilated coronary vessels included a significantly dilated left main coronary artery (arrow). This patient’s right coronary artery originated from the pulmonary artery.
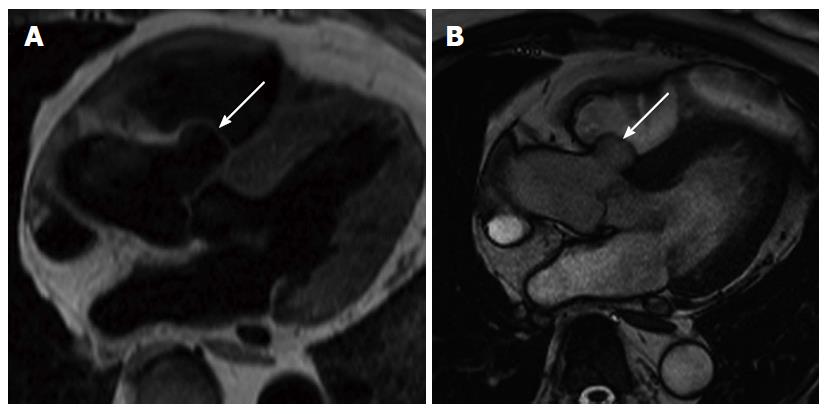
Figure 21 Sinus of Valsalva aneurysm.
A: Four chamber black blood magnetic resonance (MR) shows right sinus of Valsalva aneurysm (arrow) protruding into the right ventricular outflow tract (RVOT); B: Four chamber steady state free precession MR shows right sinus of Valsalva aneurysm (arrow) protruding into the RVOT.
Figure 22 Aberrant right subclavian artery aneurysm.
A: Axial contrast enhanced computed tomography (CT) shows aberrant right subclavian aneurysm (ARSA) arising as the last branch of the aortic arch (arrow); B: Axial CT maximum intensity projection reconstruction shows ARSA (arrow) arising from the aorta with posterior course in the mediastinum; C: Sagittal CT maximum intensity projection reconstruction shows ARSA arising as the last branch of the aortic arch (arrow).
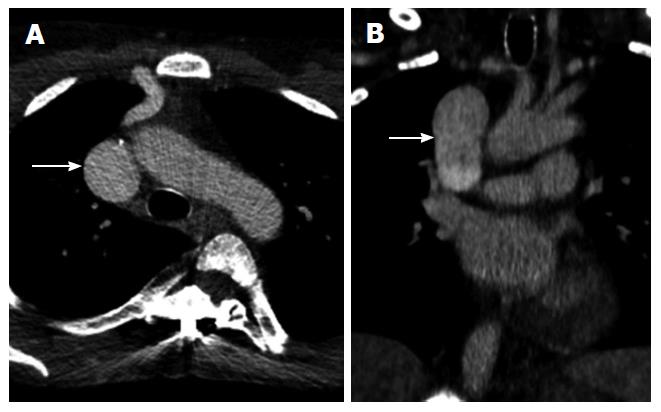
Figure 23 Brachiocephalic artery aneurysm.
A: Axial contrast enhanced computed tomography (CT) above the level of the aortic arch shows aneurysm of the right brachiocephalic artery (arrow); B: Coronal contrast enhanced CT shows aneurysmal involvement of the origin of the right brachiocephalic artery (arrow) without aortic involvement.
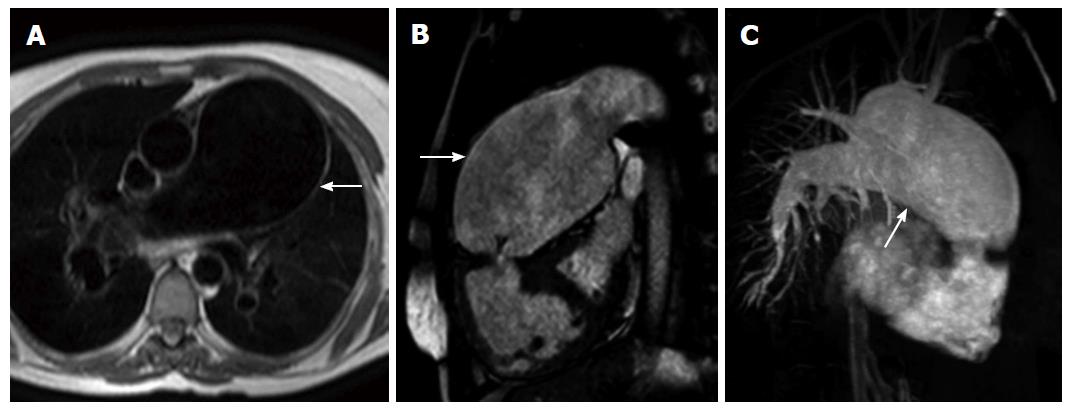
Figure 24 Giant pulmonary artery aneurysm.
A: Axial black blood magnetic resonance (MR) image shows massive fusiform enlargement of the main pulmonary artery (arrow) in a patient with atrial septal defect complicated by pulmonary hypertension and Eisenmenger syndrome; B: Right ventricular outflow tract steady state free precession MR shows massive fusiform enlargement of the main pulmonary artery (arrow); C: MR angiography maximum intensity projection reconstruction shows massive fusiform enlargement of the main pulmonary artery (arrow).
Figure 25 Superior vena cava aneurysm.
A: Axial contrast enhanced computed tomography (CT) image shows fusiform enlargement of the superior vena cava (arrow); B: Coronal contrast enhanced CT image shows fusiform enlargement of the superior vena cava (arrow).
- Citation: Kalisz K, Rajiah P. Radiological features of uncommon aneurysms of the cardiovascular system. World J Radiol 2016; 8(5): 434-448
- URL: https://www.wjgnet.com/1949-8470/full/v8/i5/434.htm
- DOI: https://dx.doi.org/10.4329/wjr.v8.i5.434


