Copyright
©The Author(s) 2016.
World J Radiol. Mar 28, 2016; 8(3): 308-315
Published online Mar 28, 2016. doi: 10.4329/wjr.v8.i3.308
Published online Mar 28, 2016. doi: 10.4329/wjr.v8.i3.308
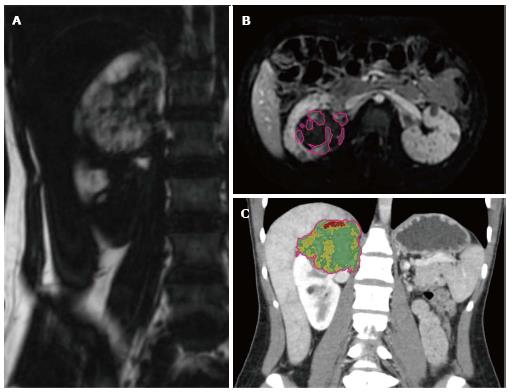
Figure 1 Examples of volumetric analysis on computed tomography and magnetic resonance imaging.
A: Coronal “fat-only” maps created from in- and opposed-phase gradient recalled imaging were used to measure macroscopic fat volumes within AMLs; B: Segmentation of tumoral vascularity (automatically generated regions of interest demarcated by pink line) from post-contrast subtraction imaging was used to calculate tumor vascular volumes; C: Histogram analysis from CT was used to calculate tumoral fat and vascular content (pseudocoloring depicts fatty tissue as red and vascular tissue as yellow). CT: Computed tomography; AML: Angiomyolipoma.
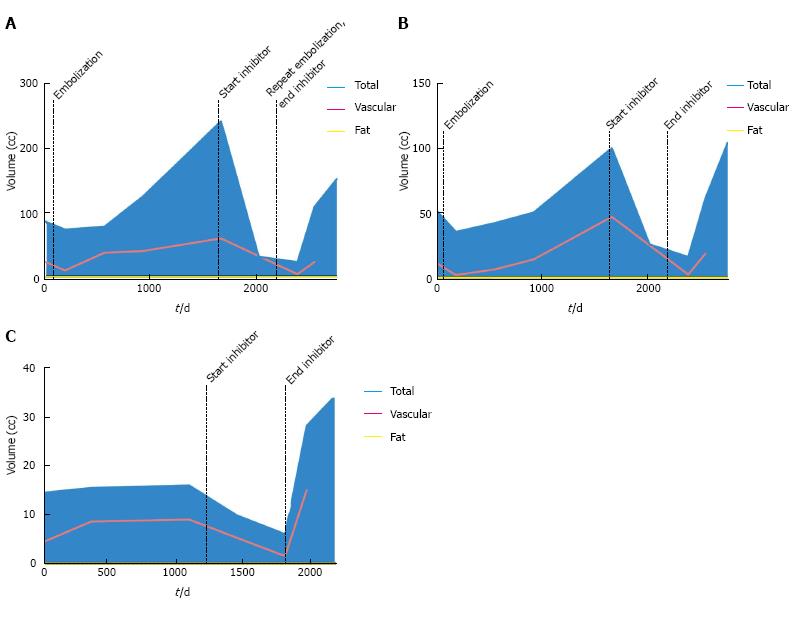
Figure 2 Volumetric analysis of patient 1 angiomyolipomas.
Both the right lower pole (A) and right upper pole (B) AMLs demonstrated growth several years following transarterial embolization and immediate response to mTOR inhibitor therapy. The performance of a second embolization did not prevent rebound growth following discontinuation of mTOR inhibitor; C: The left renal AML which did not undergo embolization demonstrated slow sustained growth prior to mTOR inhibitor, with a rapid increase in volume following discontinuation. AML: Angiomyolipoma; mTOR: Mammalian target of rapamycin.
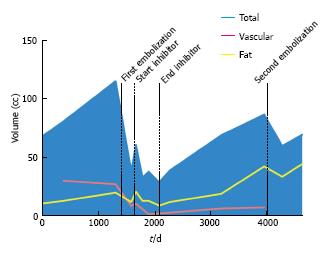
Figure 3 Volumetric analysis of patient 2 angiomyolipoma.
A right renal AML underwent embolization prior a course of mTOR inhibitor therapy. Following this course, there was rebound growth involving the lipid, soft tissue, and vascular components of the tumor. Performance of a second embolization only temporarily curtailed tumoral growth. AML: Angiomyolipoma; mTOR: Mammalian target of rapamycin.
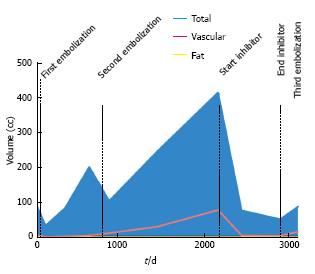
Figure 4 Volumetric analysis of patient 3 angiomyolipoma.
A left renal AML was treated with two embolization procedures prior to mTOR inhibitor therapy. Reduction in tumor volume with mTOR inhibitor affected both the soft tissue and vascular components of the tumor. However, discontinuation resulted in rebound growth, including tumor vascularity. AML: Angiomyolipoma; mTOR: Mammalian target of rapamycin.
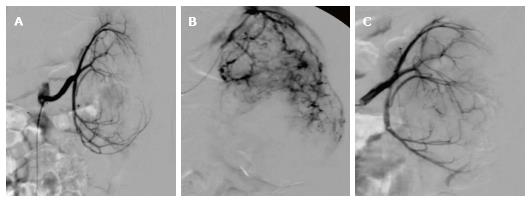
Figure 5 Angiographic analysis of patient 3 angiomyolipomas.
A: At the time of the patient’s first embolization, initial angiography demonstrated low overall tumoral vasculature (grade 1); B: The second embolization, however, revealed interval significant expansion of tumor vascularity including development of multiple aneurysms (grade 3); C: Following a course of mTOR inhibitor, tumor vascularity was reduced to grade 1 at the third embolization. mTOR: Mammalian target of rapamycin.
- Citation: Sheth RA, Feldman AS, Paul E, Thiele EA, Walker TG. Angiographic and volumetric effects of mammalian target of rapamycin inhibitors on angiomyolipomas in tuberous sclerosis. World J Radiol 2016; 8(3): 308-315
- URL: https://www.wjgnet.com/1949-8470/full/v8/i3/308.htm
- DOI: https://dx.doi.org/10.4329/wjr.v8.i3.308


