Copyright
©The Author(s) 2016.
World J Radiol. Mar 28, 2016; 8(3): 240-254
Published online Mar 28, 2016. doi: 10.4329/wjr.v8.i3.240
Published online Mar 28, 2016. doi: 10.4329/wjr.v8.i3.240
Figure 1 Hippocampal atrophy in an Alzheimer’s disease patient.
A: Computed tomography axial; B: Coronal images; C: Medial temporal lobe atrophy on magnetic resonance imaging (not the same patient).
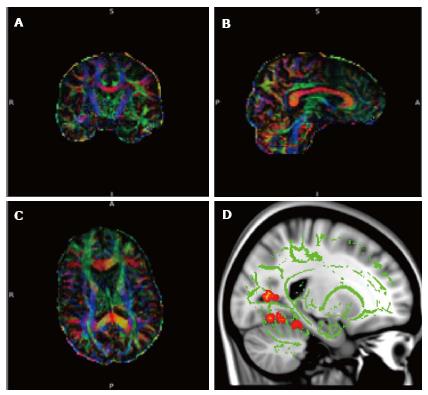
Figure 2 Diffusion tensor imaging.
A-C: Diffusion tensor imaging (DTI) data set superimposed on structural image of the brain in 3 orthogonal planes demonstrating colour coded white matter tracts. Blue colour correlate to the tracts in the cranio-caudal direction, red in the transverse direction and green in the antero-posterior direction. (Images kindly prepared by Dr. Gordon D Waiter); D: DTI data of white matter tracts (green) superimposed on T1 image demonstrating statistically significant difference in fractional anisotropy in the fornix (orange areas) compared to the rest of the brain in a subgroup of patients. (Images kindly prepared by Dr. Gordon D Waiter).
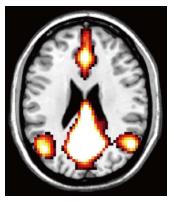
Figure 3 Default mode network, areas active during resting wakeful state.
Resting state functional magnetic resonance imaging images using blood oxygenation level dependent technique. Typical areas involved include the medial prefrontal cortices, posterior cingulate, ventral precuneus and parts of parietal lobes (Images kindly prepared by Dr. Michael Stringer).
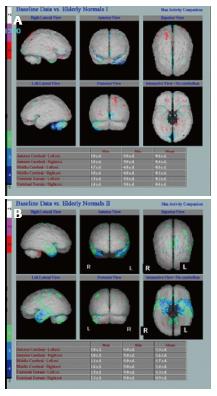
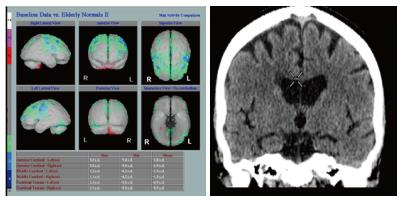
Figure 4 Underlying neuronal dysfunction and neurodegeneration.
A: Hexamethylpropylene amine oxime (HMPAO) single photon emission computed tomography (SPECT) in normal control subject demonstrating normal almost symmetrical perfusion pattern; B: HMPAO SPECT in Alzheimer’s disease parametric images demonstrate bilateral reduction in perfusion in the temporal lobes especially in the medial temporal regions up to 2 (green) and 3 (blue) standard deviation (Images kindly prepared by Ms Lesley Lovell, Senior technician).
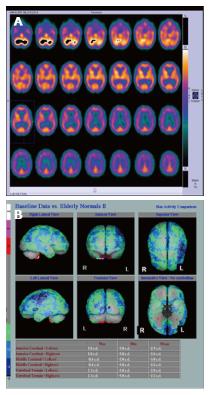
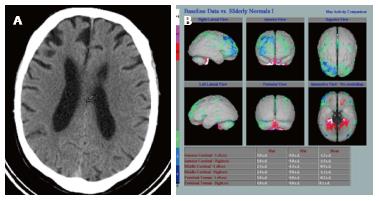
Figure 5 Hexamethylpropylene amine oxime single photon emission computed tomography in a patient with mixed vascular disease and Alzheimer’s disease.
A: Shows reduced perfusion in both the frontal and parietal lobes, especially on the left; B: Parametric images providing an overall view. There was hippocampal atrophy on computed tomography (Images kindly prepared by Dr. Fergus McKiddie).
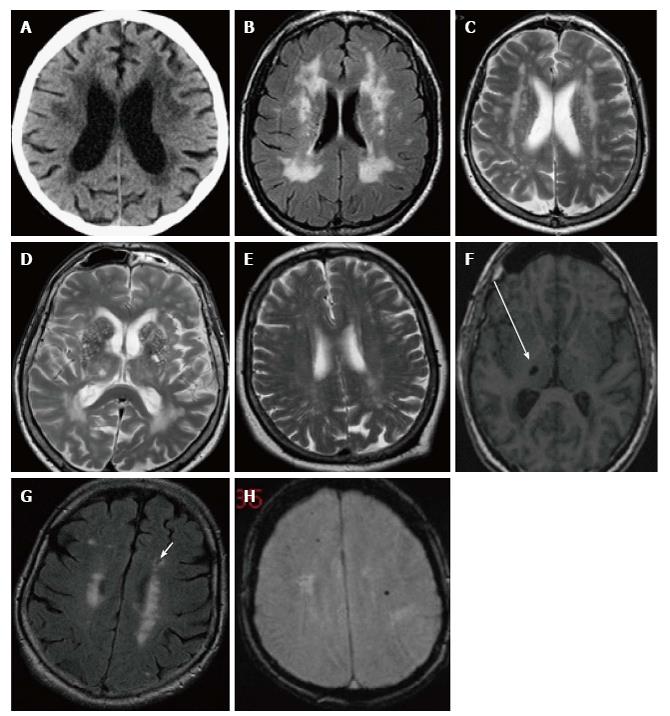
Figure 6 Computed tomography and magnetic resonance imaging images demonstrating structural changes secondary to cerebral small vessel disease.
A: Axial image of CT brain demonstrating periventricular white matter low attenuation changes; B and C: The same seen as periventricular white matter high signal areas on FLAIR and T2 MRI; D: Prominent perivascular spaces typically seen in the basal ganglia; E: Centrum semiovale; F: Focal lacune, a cerebrospinal fluid filled space, sequelae of an old lacunar infarct in the right thalamus seen here (arrow) on an axial T1 image; G: Lacune (arrow) in the left frontal lobe on a FLAIR image, usually with a rim of high signal differentiating from a PVS; H: Cerebral microhaemorrhages, seen here as focal rounded black/low signal foci in the white matter of both frontal lobes on T2* gradient echo MRI. MRI: Magnetic resonance imaging; CT: Computed tomography.
Figure 7 Hexamethylpropylene amine oxime single photon emission computed tomography in a pure cerebral vascular disease patient without Alzheimer’s disease.
Note normal hippocampal volumes in the pure cerebral vascular disease patient on computed tomography (Images kindly prepared by Ms Lesley Lovell and Dr Fergus Mckiddie, clinical scientist).
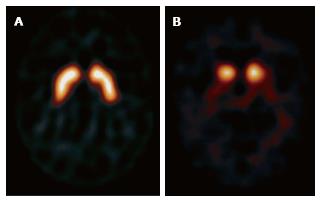
Figure 8 Iodine-123-b-carbo-methoxy-3-b-(4-iodophenyltropane) fluropropyl.
A: Normal example symmetrical uptake in the caudate heads and putamen bilaterally; B: Absent uptake in the putamen in a patient with Lewy body dementia.
Figure 9 Computed tomography showing atrophy.
A: Asymmetric right frontal lobe atrophy in fronto-temporal dementia; B: Hexamethylpropylene amine oxime single photon emission computed tomography in the same patient (Images kindly prepared by Ms Lewley Lovell, and Dr. Fergus Mckiddie).
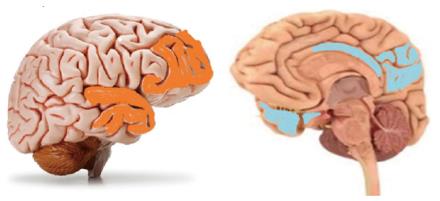
Figure 10 Regions of atrophy in fronto-temporal dementia (shaded orange) and Alzheimer’s disease (shaded light blue).
- Citation: Narayanan L, Murray AD. What can imaging tell us about cognitive impairment and dementia? World J Radiol 2016; 8(3): 240-254
- URL: https://www.wjgnet.com/1949-8470/full/v8/i3/240.htm
- DOI: https://dx.doi.org/10.4329/wjr.v8.i3.240


