Copyright
©The Author(s) 2016.
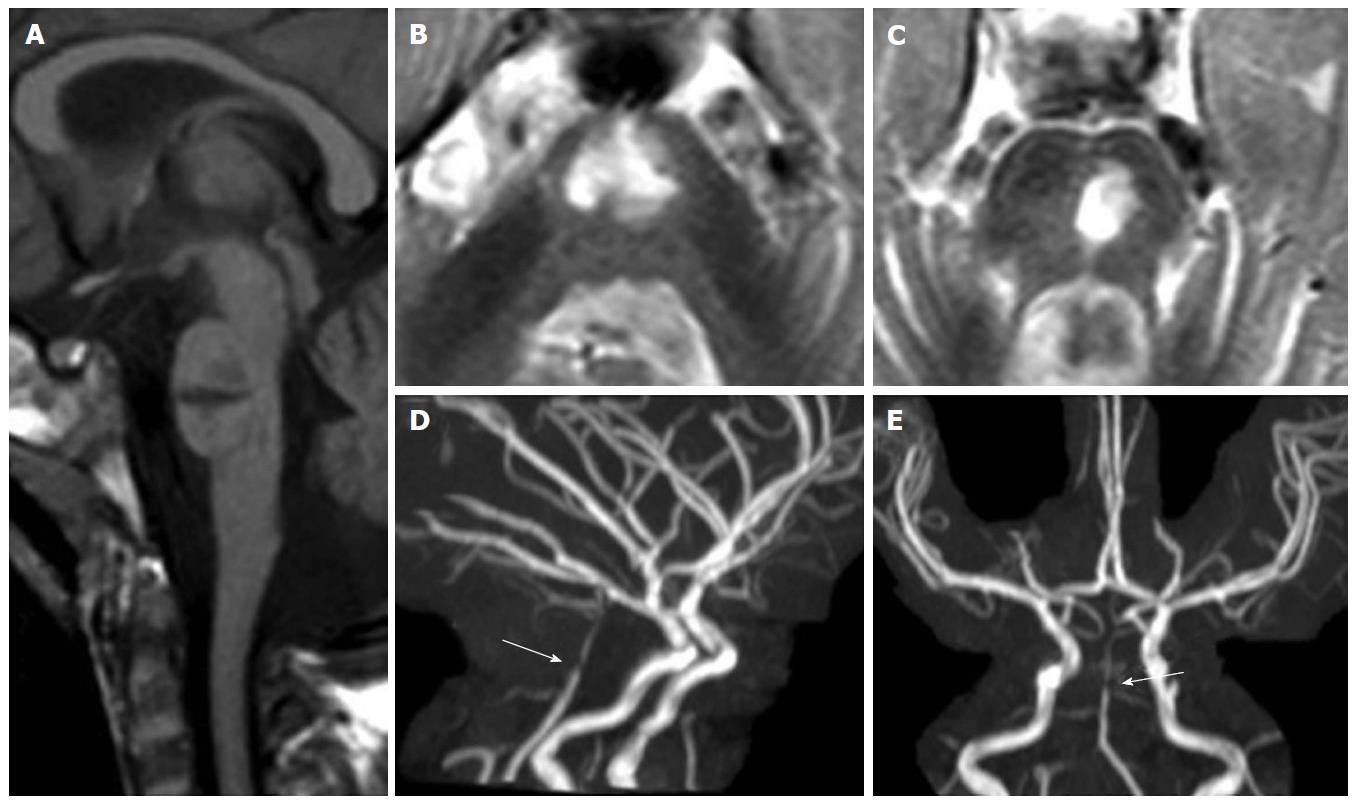
Figure 1 Pontine ischemic infarct.
A 2-year-old girl shows a large median and left paramedian T1 hypointense (mid-sagittal image in panel A) and T2 hyperintense (axial images in panels B and C) lesion as lacunar sequela of an infarct in the territory of basilar artery perforators. Time of flight maximum intensity of projection images (panels D and E) show residual segmental sub-occlusive stenosis of the basilar artery (white arrow in D and E).
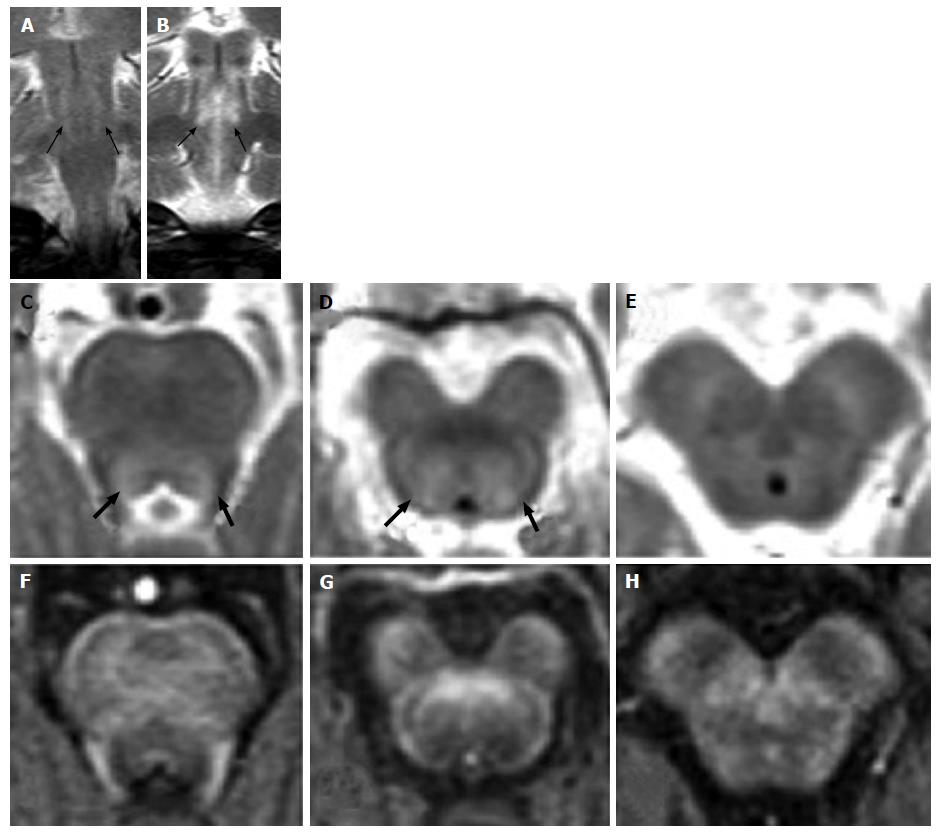
Figure 2 Hypoxic-ischemic tegmental watershed lesions.
A 26-day-old neonate with history of hypoxic-ischemic injuried. Coronal (A and B) and axial (C-E) T2- weighted images show bilateral and symmetric hyperintensities (black arrows) at the level of the pontine tegmentum. T1-weighted axial images (F-H) show hypointense signal at the same sites.
Figure 3 Leigh’s syndrome in pyruvate dehydrogenase complex deficiency.
A 1-year-old boy with vomiting and dystonia. Coronal (A) and axial (B) T2-weighted images show bilateral and symmetric hyperintense signal at the basilar portion of midbrain (white arrows). T1-weighted images (C) show hypointense signal at the same sites (white arrows). Note the bilateral and symmetric hyperintense signal of the lentiform nuclei (black arrows in A).
Figure 4 Leigh’s syndrome in complex I deficiency.
A 7-year-old girl with vomiting and respiratory distress. Axial T2-weighted images show multiple focal hyperintense lesions, involving midbrain, pons and medulla, mostly sparing the peripheral zone of the brainstem. A diffuse T2 hyperintensity and engulfement of the right basilar portion of the medulla is seen in G (white arrow): Differential diagnosis includes primary lesion and unilateral hypertrophic olivary degeneration.
Figure 5 Leigh’s syndrome in complex II and III deficiency.
A 8-year-old boy with respiratory distress and dysphagia. Axial T2-weighted images (A-H) show bilateral and symmetric T2 hyperintense lesions involving the basilar portion and the tegmentum of midbrain (A and B), pons (C-E) and medulla (F-H).
Figure 6 Leigh’s syndrome in complex IV deficiency.
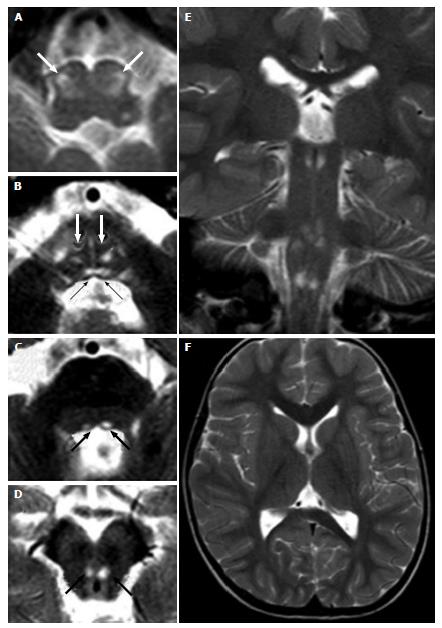
A 3-year-old male (heterozygous mutation of the SURF1 gene, responsible for assembly of the complex IV) with convergent strabism and ataxia. Axial (A-D, F) and coronal (E) T2 weighted images show hyperintense lesions at the brainstem. Bilateral and symmetric lesions involve inferior olivary nuclei (white arrows in A), bilateral medial longitudinal fasciculus (black arrows in B) and medial lemniscus (white arrows in B) in the caudal pons (B), and the medial longitudinal fasciculus in the cranial pons (black arrows in C) and midbrain (black arrows in D).
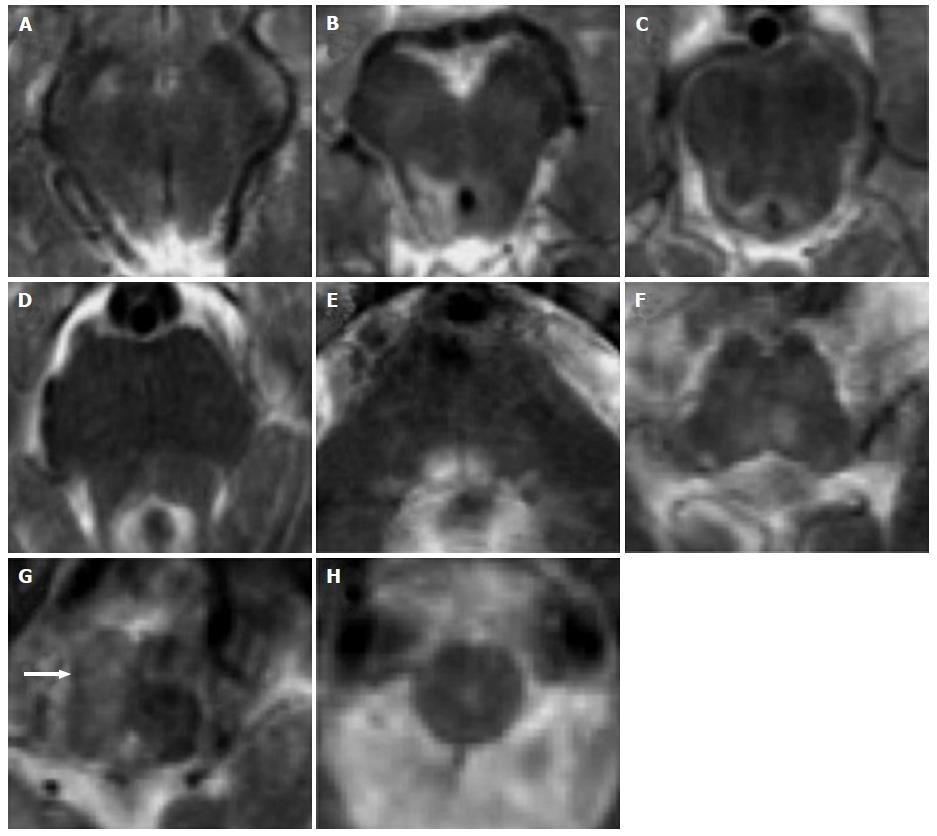
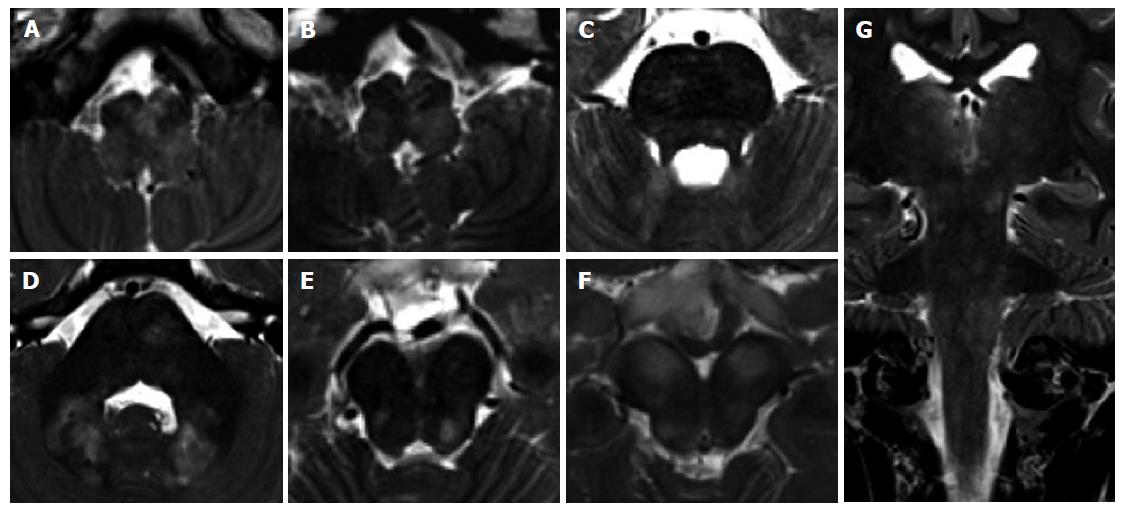
Figure 7 Central pontine myelinolysis.
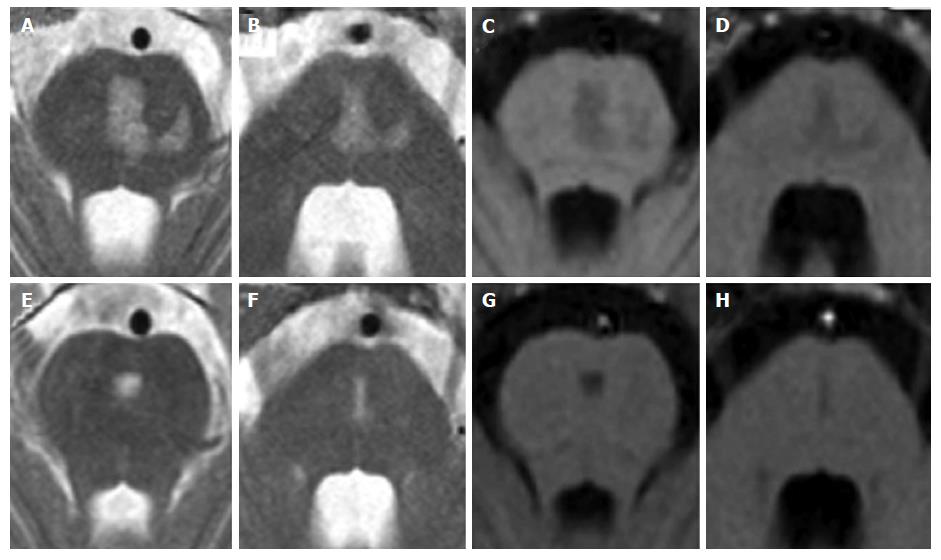
A 11-year-old boy with lymphoma after a rapid correction of hyponatremia. Axial T2-weighted (A and B) and T1 weighted (C and D) images show signal alterations of the central pons. Note the incomplete trident shape and the sparing of the peripheral zones of the pons. Two years later, MR images (E to H) show minimal residual pontine alterations with absence of symptoms.
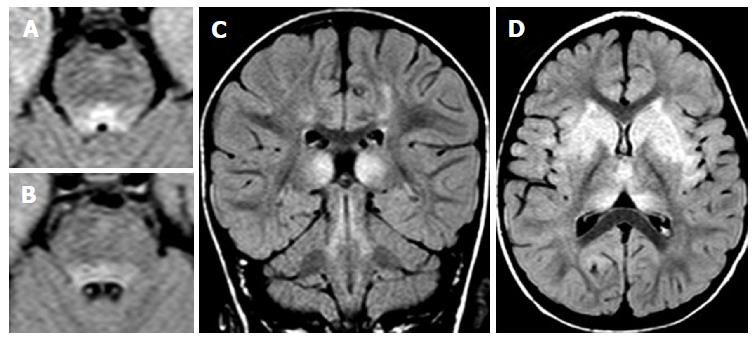
Figure 8 Vigabatrin-related transient magnetic resonance imaging abnormalities.
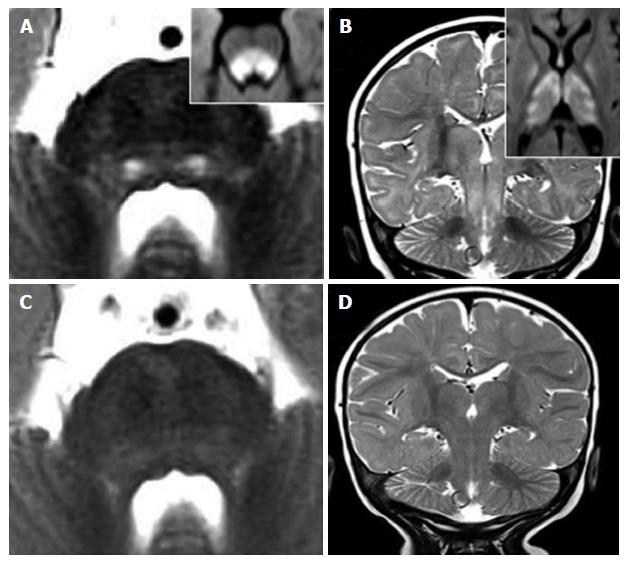
A 8-mo-old infant shows symmetric and bilateral pontine lesions located at the central tegmental tracts (white arrows in panel A) and bilateral basal ganglia and midbrain (panel B) T2 hyperintensities. Diffusion weighted images showed net restriction of diffusion at the same sites (right upper inlets in panels A and B). The T2 signal alterations resolved after three months of vigabatrin withdrawal (panels C and D).
Figure 9 Viral encephalitis.
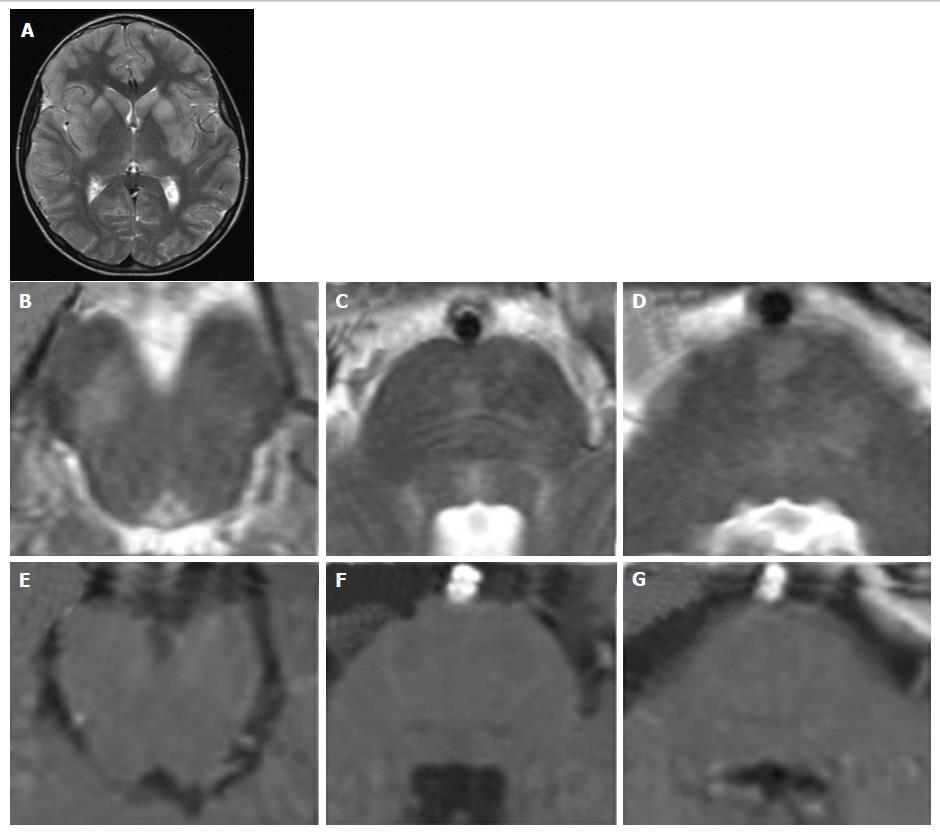
A 10-year-old boy with fever, vomiting, abdominal pain, irritability. Coronal (A) and axial (B-D) T2 weighted images show multiple asymmetrical hyperintense areas at the level of the midbrain and pons. T1 weighted signal intensity of the lesions do not enhance after contrast agent administration (E-G). Note the typical MR pattern of viral encephalitis with a bilateral and symmetrical hyperintensity of the corpus striatum and of the left thalamus (A) at the supra-tentorial level. MR: Magnetic resonance.
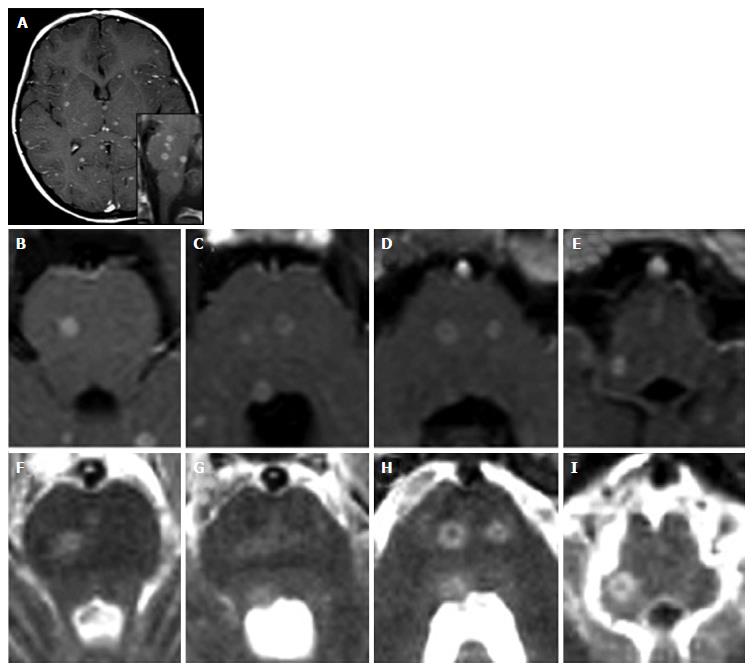
Figure 10 Miliary central nervous system tuberculosis.
A 5-year-old girl with a 2 mo history of vomiting, cephalea and dysartria. Diagnosis of miliary tuberculosis. Contrast-enhanced axial (A-E) and sagittal (lower inlet in A) T1-weighted images show multiple abscesses (tuberculomas) both supra-tentorially and at the level of the brainstem. T2 weighted images (F-I) show hyperintense lesions at the same sites.
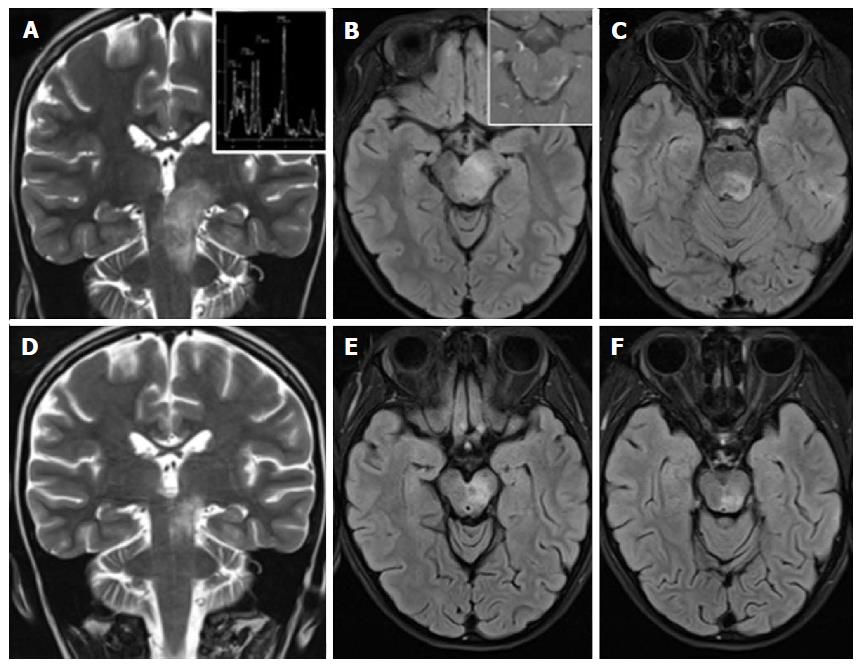
Figure 11 Anti-GQ1b antibody syndrome, Bickerstaff brainstem encephalitis type.
A 8-year-old girl with ataxia, diplopia and drowsiness. A tumor-like left diencephalo-mesencephalic T2 hyperintense lesion (A-C), shows a normal metabolic profile at MR spectroscopy (upper inlet in A) and inhomogeneous peripheral and spotty enhancement after contrast agent administration (upper inlet in B). Net reduction in size of the lesion (D-F) two weeks after corticosteroid treatment and the identification of anti-GQ1b autoantibodies in the CSF guide towards the diagnosis of brainstem encephalitis. MR: Magnetic resonance. CSF: Cerebro-spinal fluid.
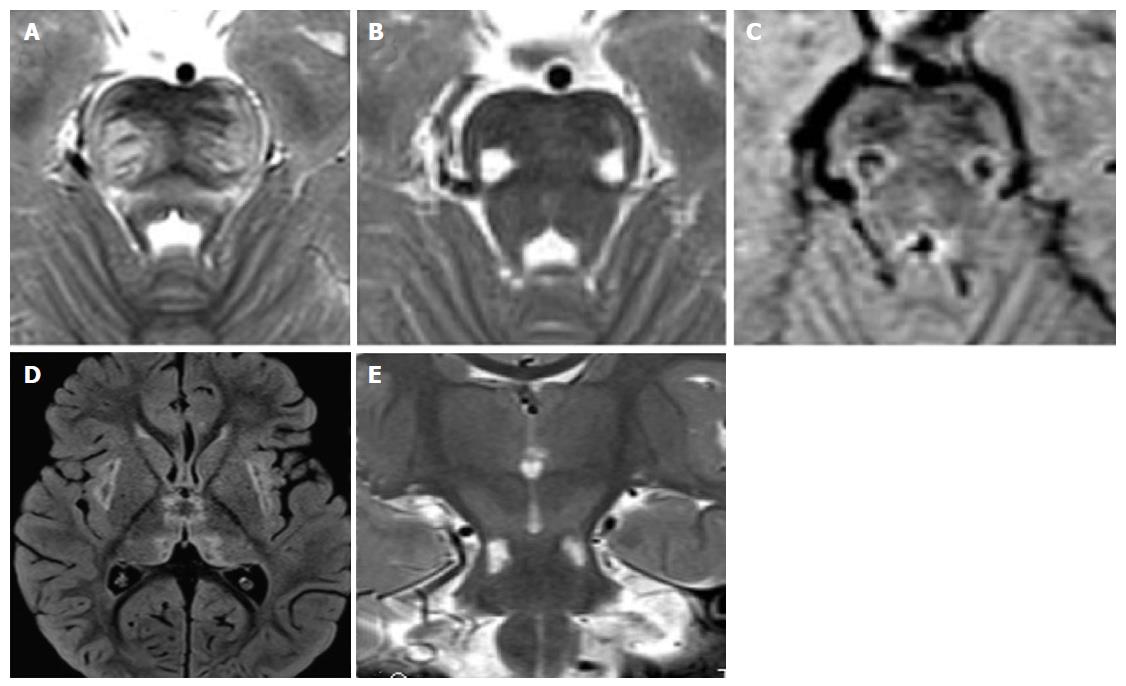
Figure 12 Recurrent acute necrotizing encephalopathy.
A 2-year-old boy with previous influenza, hyperpyrexia, ataxia, episodes of prolonged stupor. A mutation in ran-binding protein 2 was confirmed. Characteristic distribution of lesions involve the pons, midbrain, thalamus and external capsule bilaterally (D). T2 hyperintense and T1 hypointense lesions of the pontine transverse fibers (A) and of the ventro-lateral portions of the pons-midbrain (B and C) are demonstrated.
Figure 13 Acute disseminated encephalomyelitis.
A 3-year-old boy developed ataxia, nystagmus and stupor one month after gastro-enteritis. T2 hyperintense areas of the pontine tegmentum and faint areas of the base and of the periphery of the brainstem are demontrated in panels A and B. Supratentorial bilateral and symmetric T2 hyperintensities involve basal ganglia, thalami and the subcortical white matter.
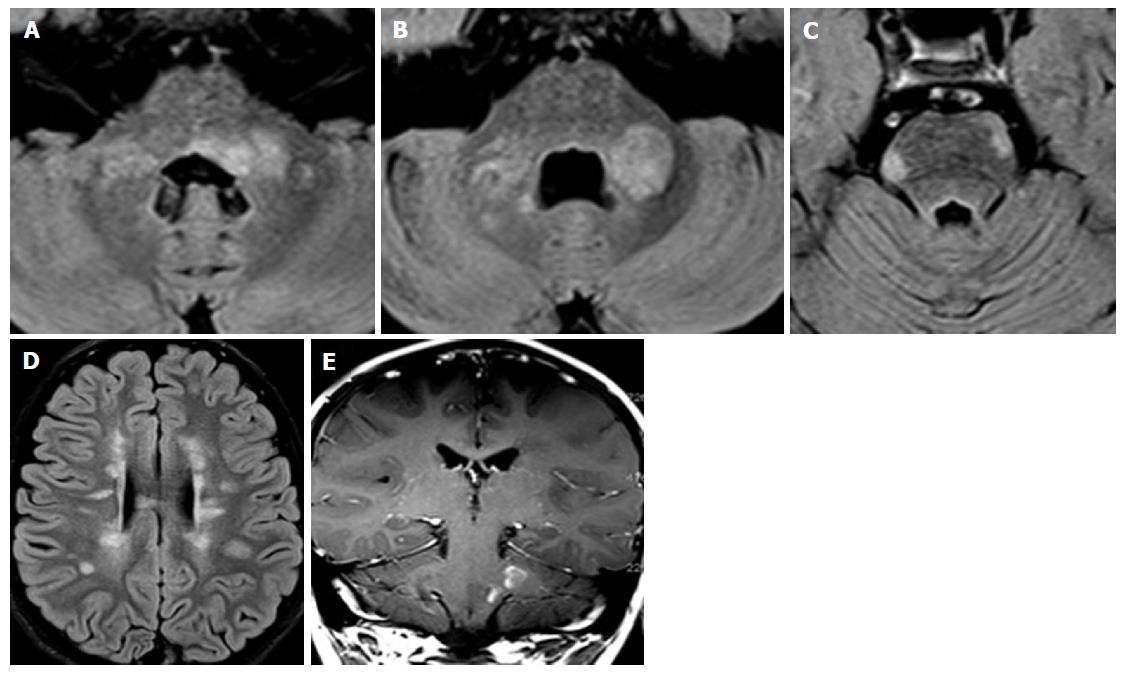
Figure 14 Pediatric onset multiple sclerosis.
A 7-year-old boy with diplopia, ataxia and speech disorder. Peripheral and peri-ventricular multiple brainstem T2 hyperintense lesions are observed (A-C), with extension to the middle cerebral peduncles (A and B). Multiple bilateral periventricular ovoidal-shaped lesions are seen at supra-tentorial level (C). Two lesions of the left pons and left middle cerebral peduncle show enhancement after contrast agent administration (E).
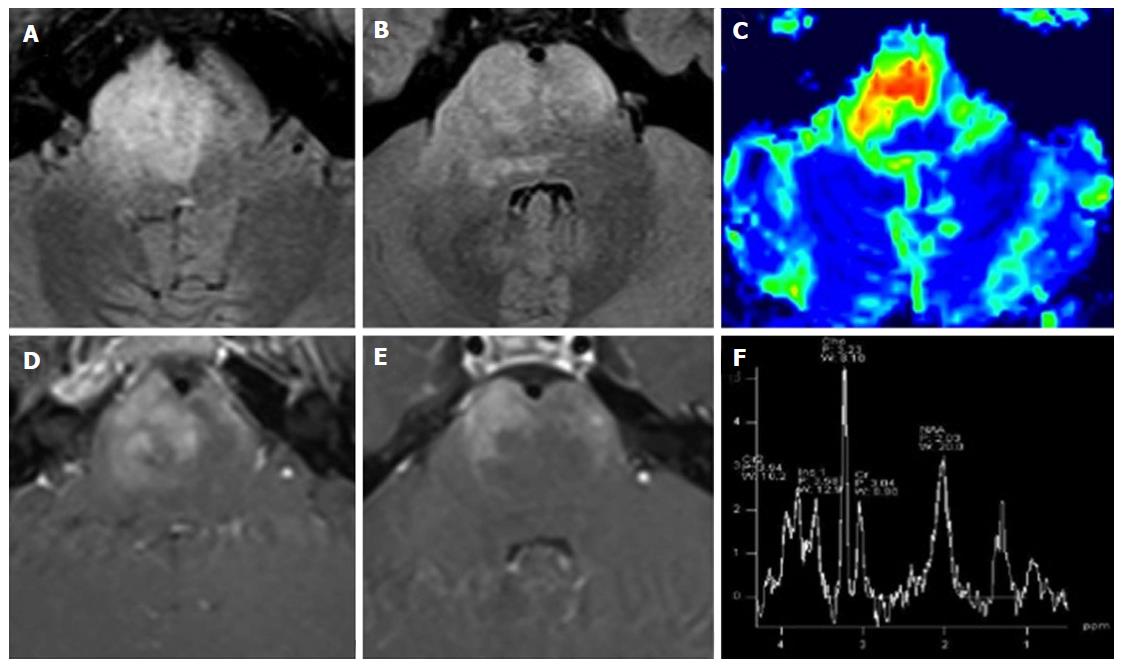
Figure 15 Diffuse intrinsic pontine glioma.
A 15-year-old boy with sudden onset of diplopia and right VI cranial nerve paresis. A T2 hyperintense infiltrating mass occupies more than two-thirds of the pontine transverse area. Note enlargement of the ventral portion of the brainstem (A and B). As an atypical pattern, the mass lesion in this case shows inhomogeneous enhancement on post-contrast T1 weighted images (D and E). DSC Perfusion CBV maps demonstrate relative CBV approximately 4.5 times higher than normal appearing cerebellar deep white matter (C). 1H spectroscopy demonstrates significant reduction of the NAA/Ch ratio (F). CBV: Cerebral blood volume; NAA/Ch: N-acetyl-aspartate/choline; DSC Perfusion CBV maps: Dynamic susceptibility contrast enhanced perfusion cerebral blood volume maps.
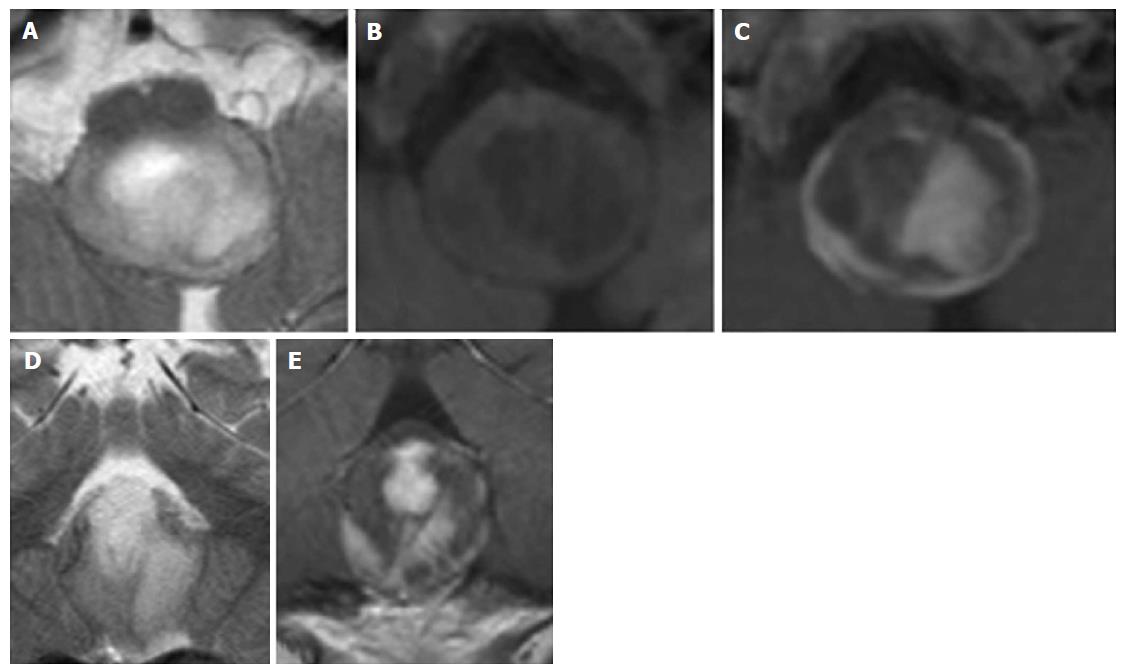
Figure 16 Pylocitic astrocytoma.
A 2-year-old boy with vomiting, respiratory distress and a dorsal exophytic medullary glioma Axial (A) and Coronal (D) T2 weighted images show a solid-cystic mass with an epicenter at the level of the medulla oblongata. Axial unenhanced (B) and axial (C) and coronal (E) enhanced T1 weighted images show inhomogeneous contrast enhancement.
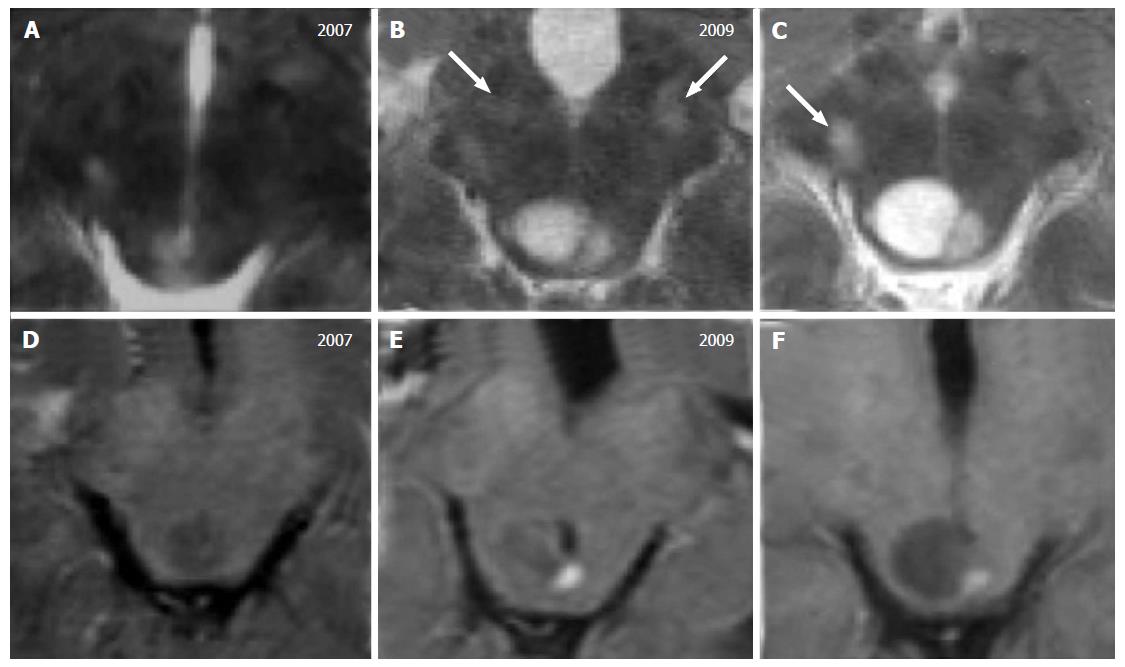
Figure 17 Tectal glioma in neurofibromatosis type 1.
A 7-year-old boy with a diagnosis of Neurofibromatosis type 1. T2 weighted images (A-C) show a small area of hyperintense signal, increasing in size over time with a cystic component. Contrast enhanced T1-weighted images (D-F) show a mural nodule of enhancement 2 and 3 years after the initial diagnosis. Note the multiple focal hyperintense lesions located at the basilar portion of the midbrain (white arrows in B and C) that are stable over time, defined as typical unidentified bright objects, observed in these patients.
Figure 18 Unidentified bright objects in neurofibromatosis type 1.
A 11-year-old girl with NF1. Multiple bilateral symmetric or asymmetric T2 hyperintense lesions, diffuse and confluent across the brainstem, in the cerebellar white matter and at supratentorial level may be encountered in these patients. These lesions do not enhance after contrast agent injection. Axial (A-F) and coronal (G) T2 weighted images of the medulla (A,B), pons (C,D) and midbrain (E,F) are presented. Coronal image (G) shows the involvement of infra- and supra-tentorial areas.
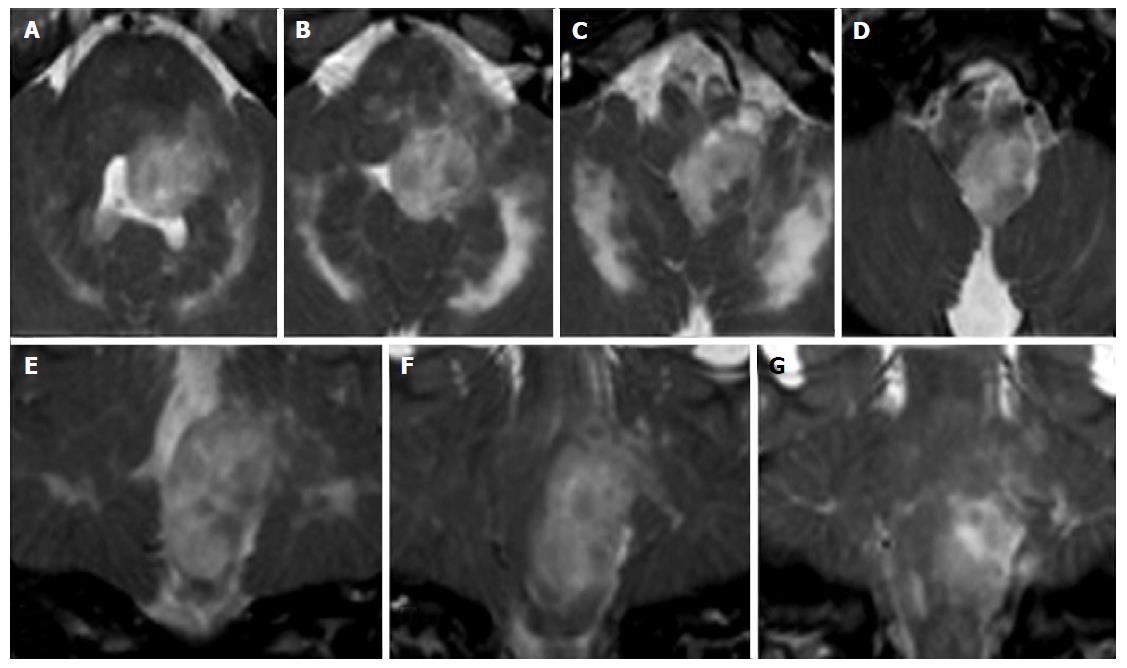
Figure 19 Isolated tumorous Langerhans cell histiocytosis.
A posterior cranial fossa mass in a 5-year-old boy is observed. Axial (A-D) and coronal (E-G) T2 weighted images show a inhomogeneous solid mass, with an epicenter apparently located in the left postero-lateral portion of the pons. Histology of a surgical specimen led to the definite diagnosis of histiocytosis.
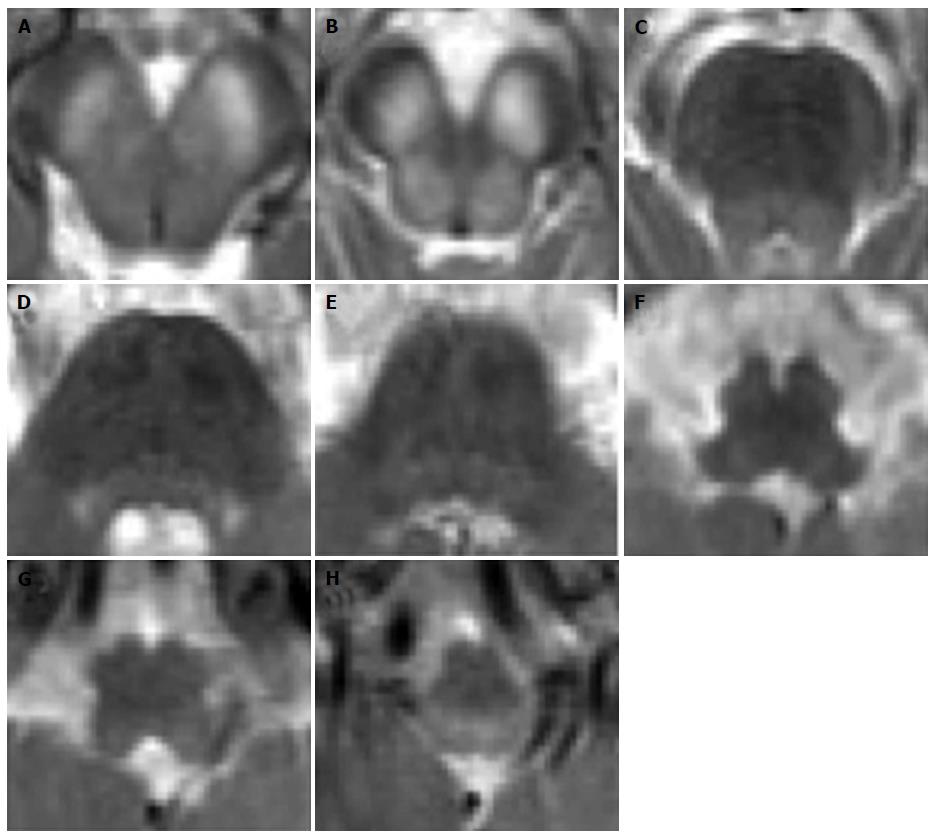
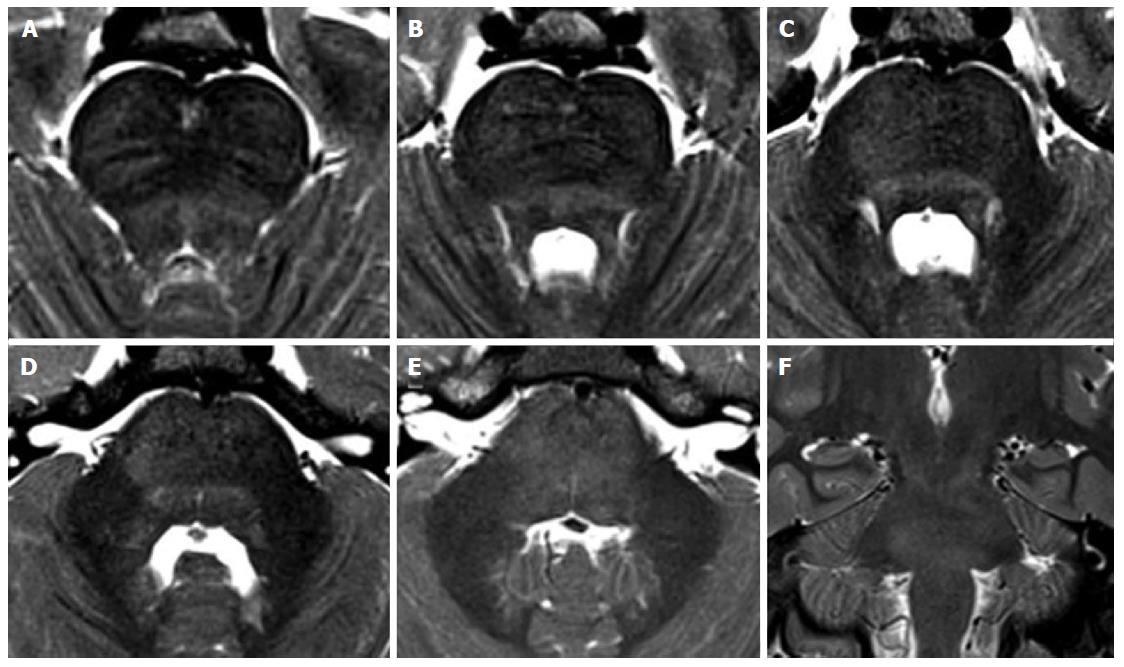
Figure 20 Non-tumorous degenerative T2 hyperintensities in Langerhans cell histiocytosis.
A 8-year-old boy with the diagnosis of Langerhans cell histiocytosis who developed ataxia. Diffuse T2 hyperintensity of the brainstem white matter is seen on axial (A-E) and coronal (F) images, with partial involvement of cerebellar peduncles.
- Citation: Quattrocchi CC, Errante Y, Rossi Espagnet MC, Galassi S, Della Sala SW, Bernardi B, Fariello G, Longo D. Magnetic resonance imaging differential diagnosis of brainstem lesions in children. World J Radiol 2016; 8(1): 1-20
- URL: https://www.wjgnet.com/1949-8470/full/v8/i1/1.htm
- DOI: https://dx.doi.org/10.4329/wjr.v8.i1.1


