Copyright
©The Author(s) 2015.
World J Radiol. Sep 28, 2015; 7(9): 266-278
Published online Sep 28, 2015. doi: 10.4329/wjr.v7.i9.266
Published online Sep 28, 2015. doi: 10.4329/wjr.v7.i9.266
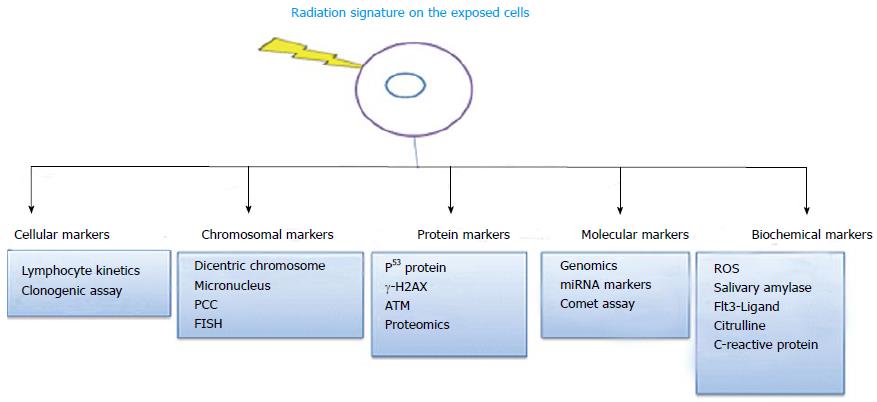
Figure 1 Various biomarkers of ionizing radiation exposure.
FISH: Fluorescence in situ hybridization; PCC: Premature chromosome condensation; ROS: Reactive oxygen species; ATM: Ataxia telangiectasia mutated.
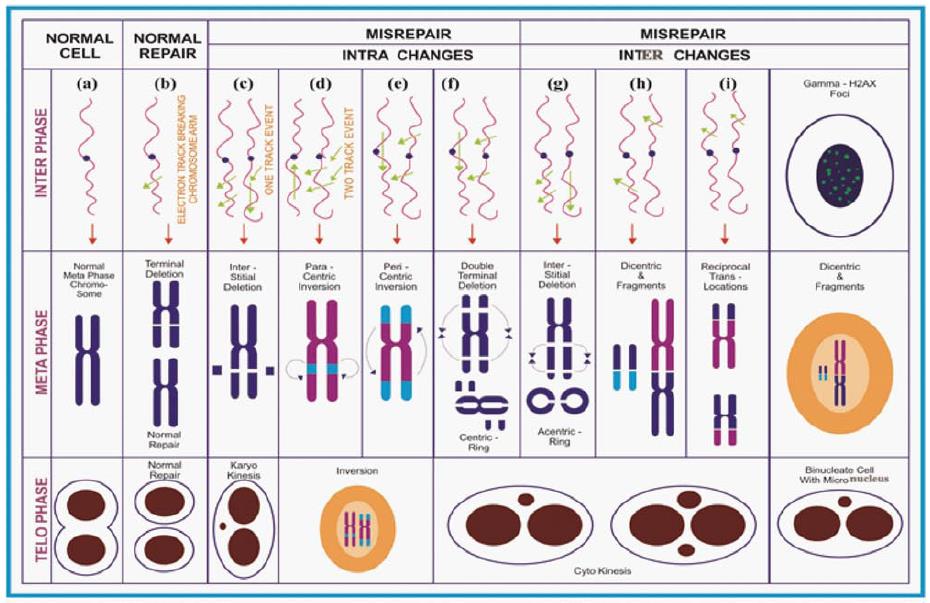
Figure 2 Diagrammatic illustration on the formation of ionizing radiation induced chromosome aberrations.
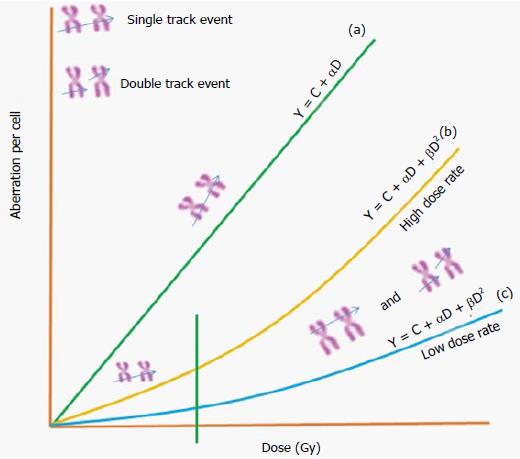
Figure 3 General dose response relationship for chromosome aberrations induced by different types of ionizing radiations.
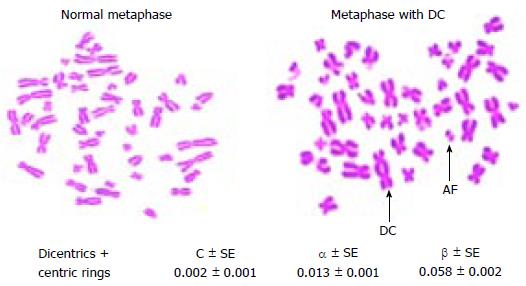
Figure 4 Metaphase chromosomes with (or) without dicentric chromosomes and dose response curve coefficients obtained from peripheral blood lymphocytes.
AF: Acentric fragment; DC: Dicentric chromosome.
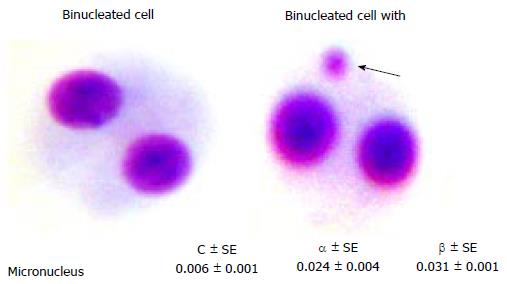
Figure 5 Binucleated cell with (or) without micronucleus and dose response curve coefficients obtained from peripheral blood lymphocytes.
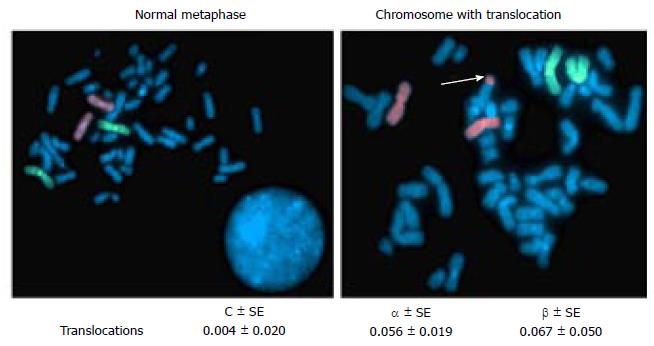
Figure 6 Metaphase chromosomes with (or) without translocation and dose response curve coefficients after whole chromosome painting.
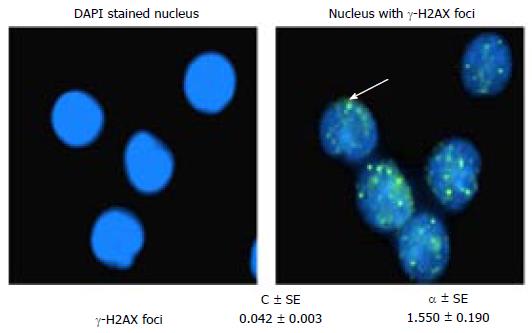
Figure 7 4’,6-diamidino-2-phenylindole, dihydrochloride stained nucleus with (or) without γ-H2AX foci and their coefficients obtained from peripheral blood lymphocytes.
- Citation: Perumal V, Sekaran TSG, Raavi V, Basheerudeen SAS, Kanagaraj K, Chowdhury AR, Paul SF. Radiation signature on exposed cells: Relevance in dose estimation. World J Radiol 2015; 7(9): 266-278
- URL: https://www.wjgnet.com/1949-8470/full/v7/i9/266.htm
- DOI: https://dx.doi.org/10.4329/wjr.v7.i9.266


