Copyright
©The Author(s) 2015.
World J Radiol. Jul 28, 2015; 7(7): 170-179
Published online Jul 28, 2015. doi: 10.4329/wjr.v7.i7.170
Published online Jul 28, 2015. doi: 10.4329/wjr.v7.i7.170
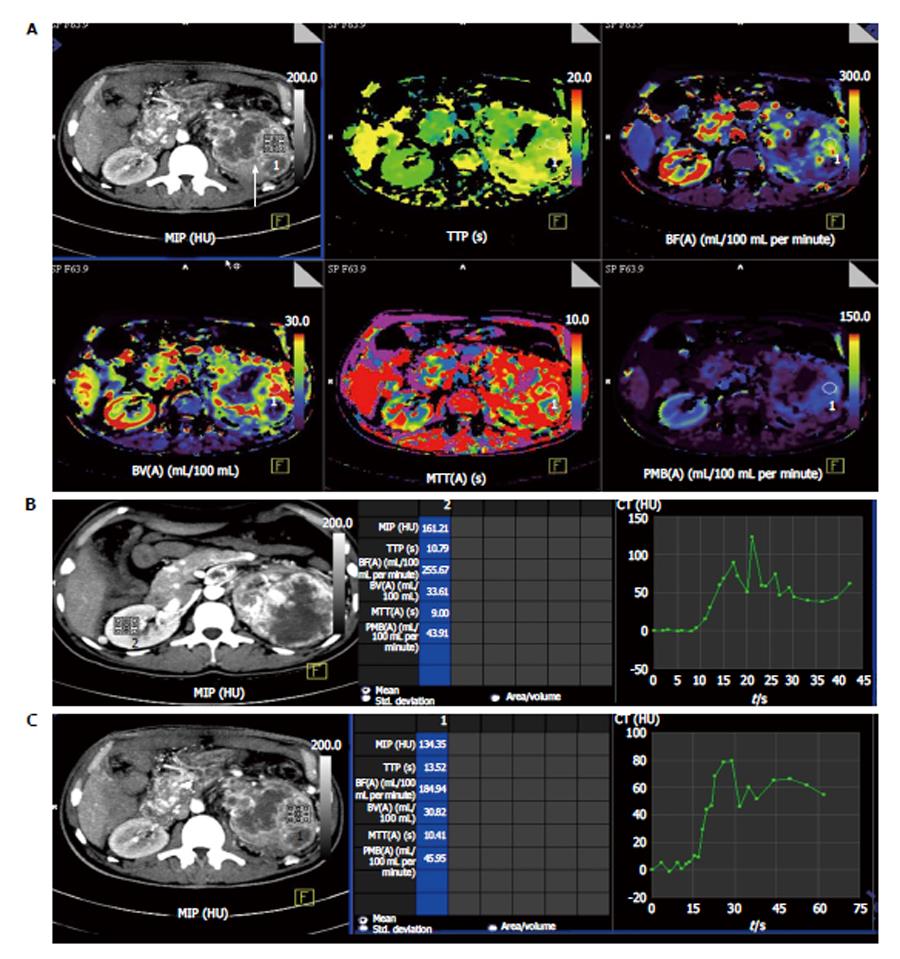
Figure 1 Perfusion computed tomography in normal renal parenchyma vs renal cell carcinoma in a 50-year-old man with left renal cell carcinoma (clear cell type).
A: Contrast computed tomography (CT) images showed a large, hyperenhancing mass in left kidney with central necrosis (arrow). Colour-coded perfusion maps show various perfusion parameters in normal right kidney and diseased left kidney. Red being the region with highest perfusion parameter with purple being the least; B: Time attenuation curve and the perfusion parameters in normal right kidney. Normal renal parenchyma is seen to have high perfusion in the range of 255 mL/100 mL per minute; C: Time attenuation curve and perfusion parameters in the left renal cell carcinoma. There is delayed wash-out of contrast in the region of the tumour as depicted in the graph. MIP: Maximum peak intensity; TTP: Time to peak; BF: Blood flow; BV: Blood volume; MTT: Mean transit time; PMB: Permeanbility.
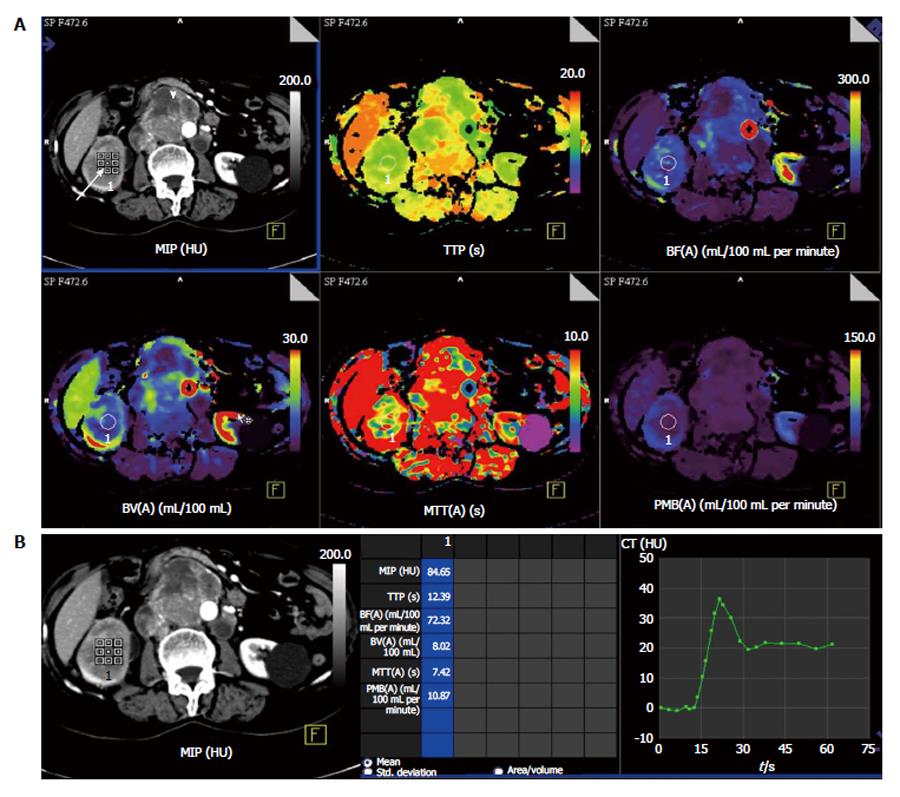
Figure 2 Perfusion computed tomography in a 63-year-old lady with right renal cell carcinoma (chromophobe type).
A: Contrast computed tomography (CT) images show tumor in right kidney (white arrow) with retroperitoneal nodal metastases (arrowhead). Colour-coded perfusion maps show the perfusion parameters; B: Time attenuation curve and perfusion parameters with region-of-interest in the right renal cell carcinoma depict delayed wash-out of contrast. MIP: Maximum peak intensity; TTP: Time to peak; BF: Blood flow; BV: Blood volume; MTT: Mean transit time; PMB: Permeanbility.
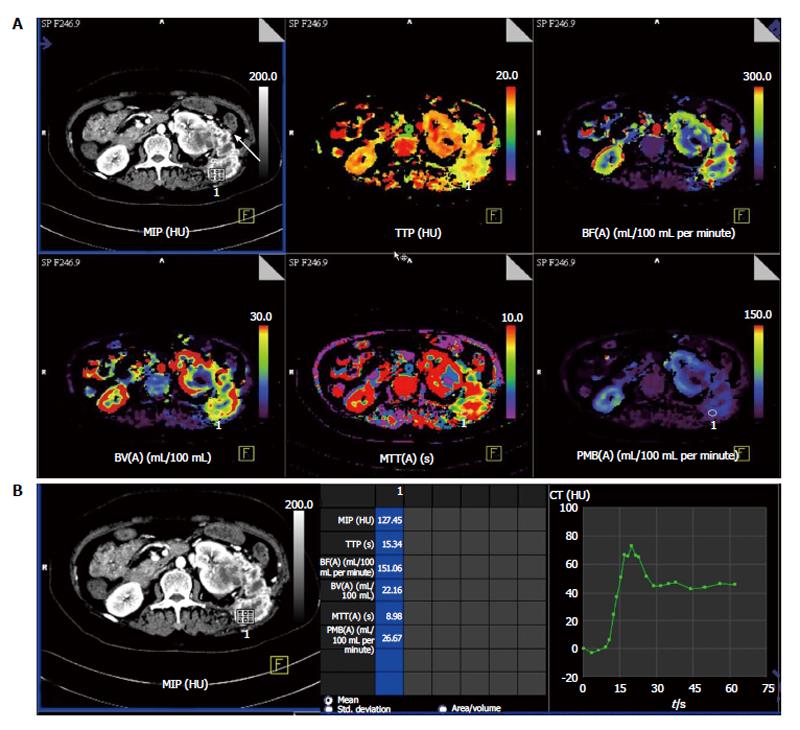
Figure 3 Perfusion computed tomography in a 55-year-old lady with metastatic left renal cell carcinoma.
A: Contrast computed tomography (CT) images show heterogeneous necrotic mass in left kidney with abdominal wall metastatic deposit in left lumbar region (arrow) and colour-coded perfusion maps show the perfusion parameters; B: Time attenuation curve and perfusion parameters with region-of-interest placed in the metastatic left lumbar lesion depict delayed wash-out of contrast from the tumour deposit. MIP: Maximum peak intensity; TTP: Time to peak; BF: Blood flow; BV: Blood volume; MTT: Mean transit time; PMB: Permeanbility.
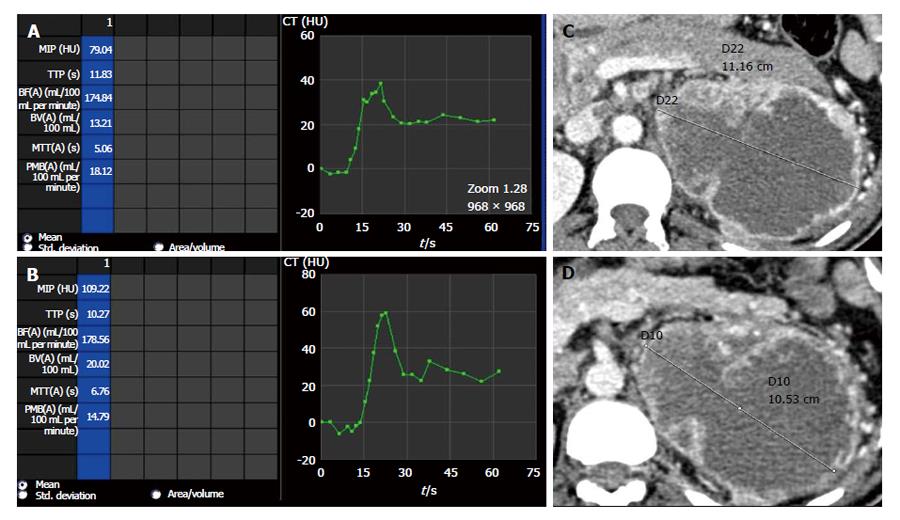
Figure 4 Perfusion parameters vs size evaluation in depicting partial response.
Comparison of perfusion parameters in a case of left side clear cell renal cell carcinoma after start of anti-angiogenic therapy. Follow-up scan at 6 mo interval (B) showed at 6 mo interval shows decrease in permeability as compared to baseline scan (A) suggestive of partial response. However, no change in size of lesion noted between baseline (C) and follow-up (D) scans which would have been labelled as stable disease. MIP: Maximum peak intensity; TTP: Time to peak; BF: Blood flow; BV: Blood volume; MTT: Mean transit time; PMB: Permeanbility; CT: Computed tomography.
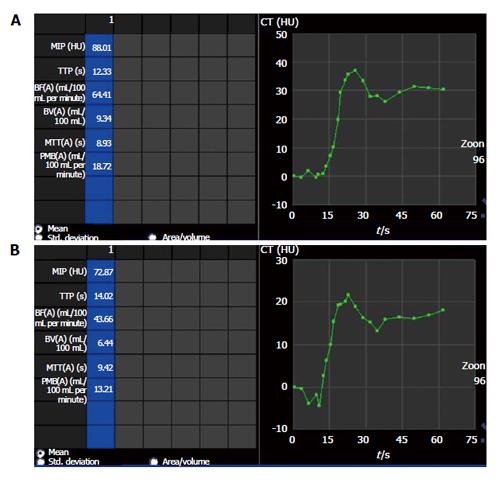
Figure 5 Perfusion parameters showing partial response with anti-angiogenic therapy.
Comparison of perfusion parameters in right side chromophobe renal cell carcinoma (same patient as shown in Figure 2) after start of anti-angiogenic therapy shows partial response as permeability (PMB) in follow-up scan (B) at 6 mo interval decreased compared to baseline scan (A). The PMB measured 18.72 mL/100 mL per minute at baseline (A) while in follow-up scan (B), PMB was 13.2 mL/100 mL per minute. There was no interval change in lesion size and would have been labeled as stable disease in absence of perfusion parameters. MIP: Maximum peak intensity; TTP: Time to peak; BF: Blood flow; BV: Blood volume; MTT: Mean transit time; CT: Computed tomography.
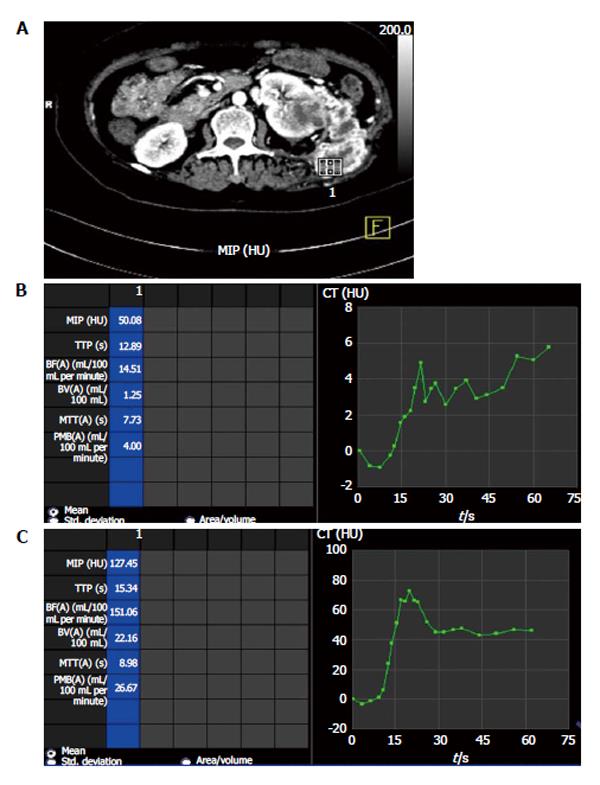
Figure 6 Perfusion parameters showing progressive disease with anti-angiogenic therapy.
Comparison of perfusion parameters in left metastatic renal cell carcinoma (A) after start of anti-angiogenic therapy at 6 mo interval shows progressive disease as permeability (PMB) at baseline scan (B) was 4.00 mL/10 mL per minute which increased to 26.67 mL/100 mL per minute in follow-up scan (C). There was also increase in size and extent of lesions during this interval (not shown). MIP: Maximum peak intensity; TTP: Time to peak; BF: Blood flow; BV: Blood volume; MTT: Mean transit time; CT: Computed tomography.
- Citation: Das CJ, Thingujam U, Panda A, Sharma S, Gupta AK. Perfusion computed tomography in renal cell carcinoma. World J Radiol 2015; 7(7): 170-179
- URL: https://www.wjgnet.com/1949-8470/full/v7/i7/170.htm
- DOI: https://dx.doi.org/10.4329/wjr.v7.i7.170


