Copyright
©The Author(s) 2015.
World J Radiol. Dec 28, 2015; 7(12): 509-520
Published online Dec 28, 2015. doi: 10.4329/wjr.v7.i12.509
Published online Dec 28, 2015. doi: 10.4329/wjr.v7.i12.509
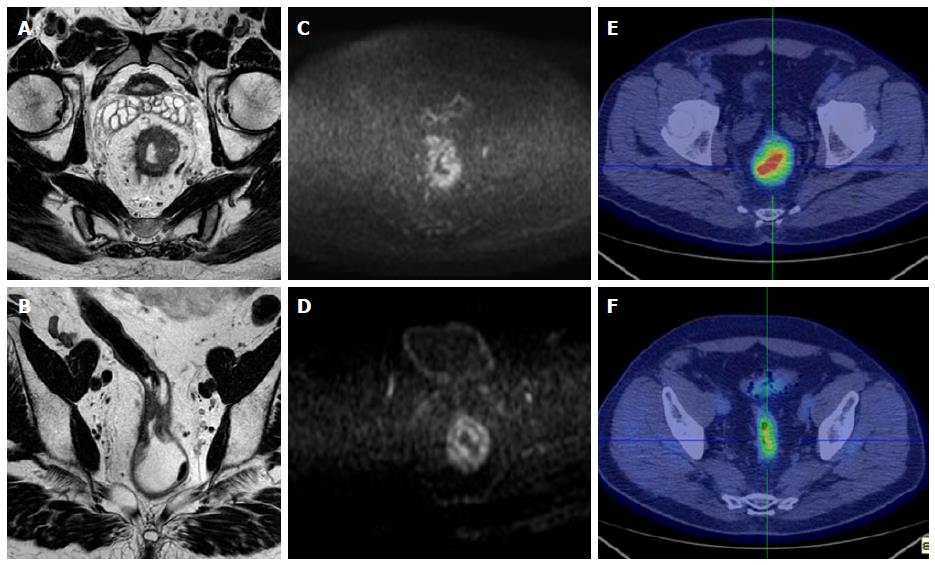
Figure 1 A 72-year-old man with pathologically proven proximal rectal cancer, classified as non-responder after chemoradiation treatment.
A: Pre-CRT T2-weighted axial MR image shows a circumferential pathological rectal mass, with largest thickening from 12 to 6 o’clock position, narrowing rectal lumen and with corresponding mesorectal fat spread around; B: Post-CRT T2- weighted axial MR image shows incomplete decrease in rectal wall thickening, with irregular and inhomogeneous neoplastic tissue still determining lumen narrow; C: Pre-CRT DWI image shows the presence of hyperintense area at the corresponding level of tumor mass (ADC: 0.63 × 10⁻³ mm²/s); D: Post-CRT DWI image demonstrated partial response, with focal hyperintense area still detectable (ADC: 1.25 × 10⁻³ mm²/s); E: Pre-CRT axial pelvic scan examination image demonstrates a significant radiotracer uptake in the hight rectum, corresponding tumor region (SUVmax: 19.4); F: The partial metabolic response is also confirmed by CRT PET/CT scans, in particular a significant tumor uptake is still present (SUVmax: 4.3). CRT: Chemoradiation treatment; DWI: Diffusion weighted imaging; ADC: Apparent diffusion coefficient; SUV: Standardized uptake value.
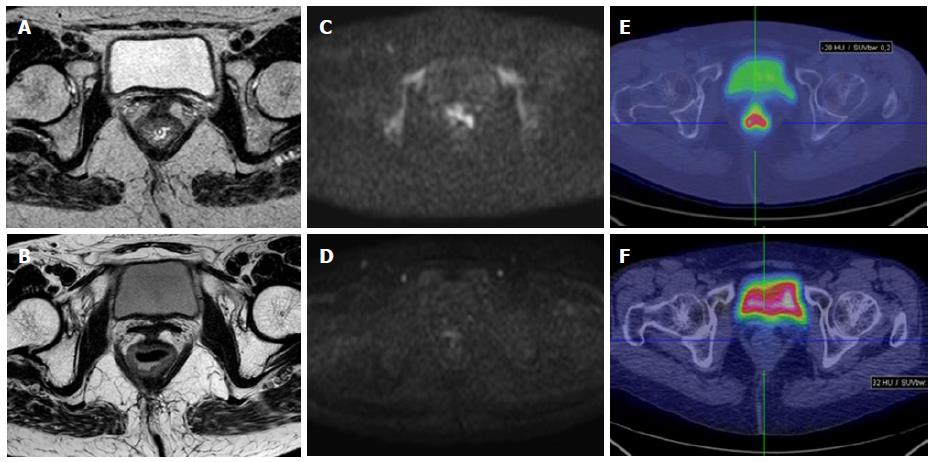
Figure 2 A 63-year-old woman with pathologically proven cancer in low rectum.
It was difficult to evaluated correctly the response after CRT treatment by using only the T2 morphological information. After the additional reading of DWI images, the radiologist changed his evaluation and correctly classified the patient as responder. A: Pre-CRT T2-weighted axial MR image shows a ulcerative narrowing rectal neoplastic lesion from 11 to 3 o’clock position; B: Post-CRT T2-weighted axial MR image shows a residual homogeneous rectal wall thickening, isointense and not clearly definable as fibrotic tissue; C: Pre-CRT axial DWI image shows a focal hyperintense area in the corresponding site of rectal mass (ADC: 0.84 × 10⁻³ mm2/s); D: Post-CRT axial DWI shows no residual hyperintense signal in the corresponding site of rectal wall (ADC: 1.39 × 10⁻³ mm²/s); E: Pre-CRT axial pelvic scan of PET/CT examination image demonstrated a significant focal radiotracer uptake in correspondence of rectal mass (SUVmax: 9.3); F: Post-CRT axial pelvic scan of PET/CT examination image shows no significant uptake (SUVmax: 2.6). CRT: Chemoradiation treatment; DWI: Diffusion weighted imaging; ADC: Apparent diffusion coefficient; SUV: Standardized uptake value.
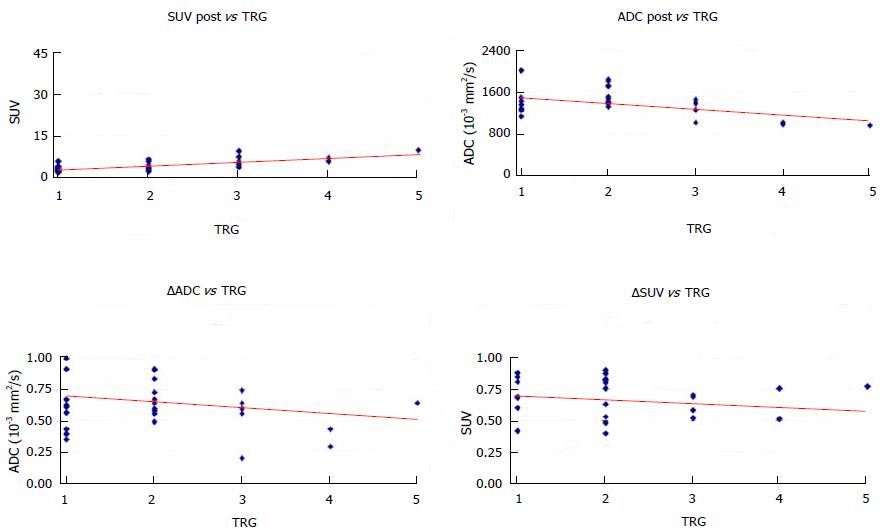
Figure 3 Univariate linear regression analysis comparing mean standardized uptake value post and apparent diffusion coefficient post with tumor regression grade.
ADC: Apparent diffusion coefficient; SUV: Standardized uptake value; TRG: Tumor regression grade.
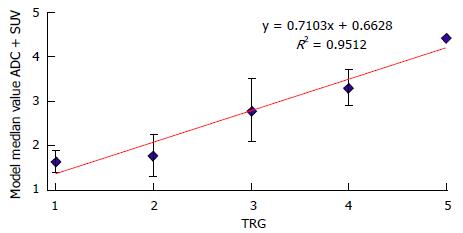
Figure 4 Univariate linear regression analysis of combined model with median value of standardized uptake value post and apparent diffusion coefficient post, in comparison with tumor regression grade.
ADC: Apparent diffusion coefficient; SUV: Standardized uptake value; TRG: Tumor regression grade.
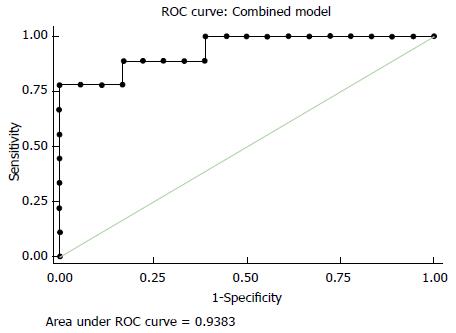
Figure 5 Receiver operating characteristic curve of combined model with median value of standardized uptake value post and apparent diffusion coefficient post, in comparison with tumor regression grade.
ROC: Receiver operating characteristic.
- Citation: Ippolito D, Fior D, Trattenero C, Ponti ED, Drago S, Guerra L, Franzesi CT, Sironi S. Combined value of apparent diffusion coefficient-standardized uptake value max in evaluation of post-treated locally advanced rectal cancer. World J Radiol 2015; 7(12): 509-520
- URL: https://www.wjgnet.com/1949-8470/full/v7/i12/509.htm
- DOI: https://dx.doi.org/10.4329/wjr.v7.i12.509


