Copyright
©The Author(s) 2015.
World J Radiol. Dec 28, 2015; 7(12): 438-447
Published online Dec 28, 2015. doi: 10.4329/wjr.v7.i12.438
Published online Dec 28, 2015. doi: 10.4329/wjr.v7.i12.438
Figure 1 Anatomy of the middle cerebellar peduncles.
A: Diagram shows the pontine crossing fibers (PCF) (red and pink long arrows) originating from the contralateral pontine nuclei and conforming the middle cerebellar peduncles (MCP) (only afferent fibers constitute MCP); B and C: Diffusion tensor imaging (DTI) tractography after seed ROIs placed in the bilateral MCP. Note the representation of the PCF (red on B). Here, we can envision the origin of well described signs on conventional T2 sequences such as the “hot cross bun sign” or “trident sign” where there is involvement of the PCF or central pons and sparing of the corticospinal tracts (CST) and tegmentum. Sagittal DTI (C) including the main efferent pathway (purple ascending fibers, arrow) through the pontine tegmentum and superior cerebellar peduncles which constitutes part of the dentate-rubro-thalamic tract. (DTI was acquired on a GE-3T Magnet, b = 0 and 1000 s/mm2 with 25 directions; Brain Lab Software was used to fuse T2-WI with DTI acquisition; and tractography was performed using a tensor deflection algorithm). ROIs: Regions of interest.
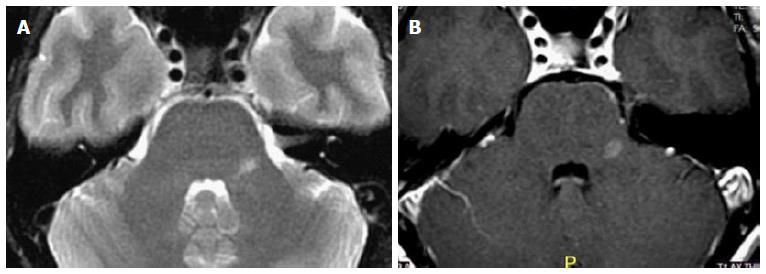
Figure 2 Multiple sclerosis.
A 40-year-old female with 2 mo history of left facial pain/numbness and difficulty talking (scanning speech). Axial T2 (A) and axial post-contrast MR (B) images show isolated lesion in the left MCP. Due to suspicion for demyelinating disease MRI of the spine and CSF analysis was recommended. Additional lesion found in the thoracic cord (not shown) and CSF led to the diagnosis of MS. MCP: Middle cerebellar peduncles; CSF: Cerebrospinal fluid; MRI: Magnetic resonance imaging; MS: Multiple sclerosis.
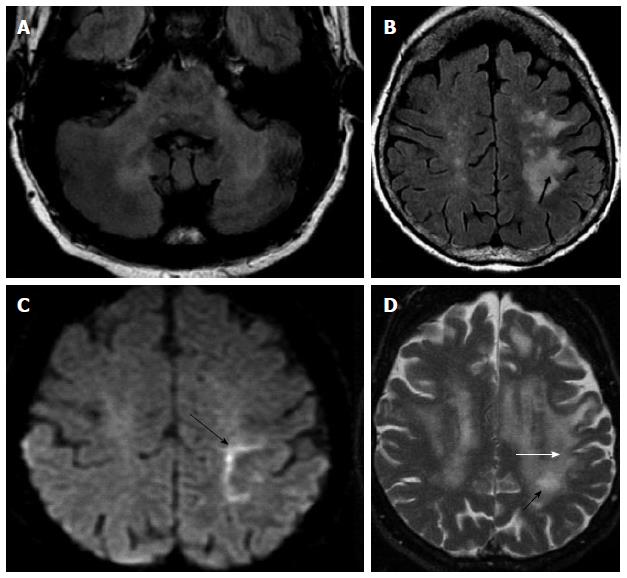
Figure 3 Progressive multifocal leucoencephalopathy.
HIV patient with + JC virus on PCR-CSF. Bilateral involvement of MCP on axial FLAIR (A); with no enhancement (not shown); Axial FLAIR (B) and axial DWI (C) images show asymmetric confluent areas of increased signal in the subcortical WM with involvement of the u-fibers (arrow) and linear “edge” on DWI (arrow on C) consistent with advancing demyelinated edge; D: Three months f/u images better depict involvement of u-fibers (white arrow) as well as progression of WM disease with formation of small central cavitation/micro cyst, characteristic of PML (black arrow). PML: Progressive multifocal leucoencephalopathy; MCP: Middle cerebellar peduncles; CSF: Cerebrospinal fluid; DWI: Diffusion weighted-imaging; PCR: Polymerase chain reaction; HIV: Human immunodeficiency virus.
Figure 4 Immune reconstitution inflammatory syndrome and progressive multifocal leukoencephalopathy.
HIV + JC virus, irregular antiretroviral therapy, with confusion and right sided weakness. Axial FLAIR (A) and axial post contrast (B) show abnormal signal in the bilateral MCP, greater on the right with associated enhancement; Axial post contrast (C) 2 mo after treatment with steroids and antiretroviral therapy show significant improvement of abnormal enhancement. IRIS might or might not be associated with an infectious process, in this case the abnormal enhancement in a patient with positive JC virus lead to the suspicious of a superimposed neoplastic process (lymphoma), other fungal or bacterial infection. Ultimately, the response to steroid gives the diagnosis of IRIS. IRIS: Immune reconstitution inflammatory syndrome; MCP: Middle cerebellar peduncles; HIV: Human immunodeficiency virus.
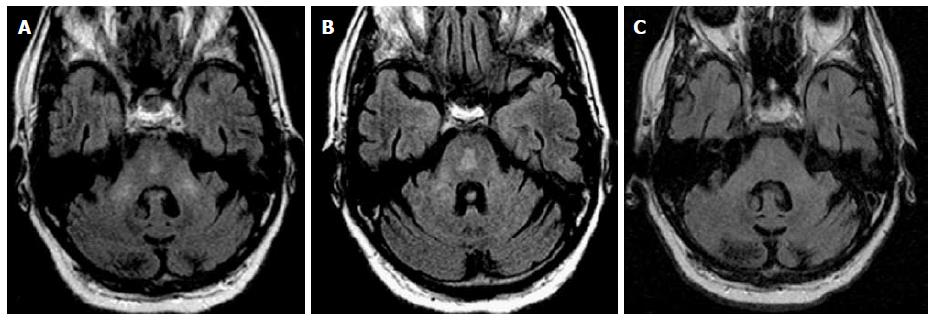
Figure 5 Osmotic demyelination syndrome.
History of ethanol abuse and rapid correction of hyponatremia. A and B: Axial FLAIR images at two different levels of the pons show abnormal signal in the bilateral MCP as well as abnormal signal in the central pons with subtle “trident” appearance; C: Three months f/u demonstrate resolution of abnormal signal in the MCP and pons. ODS characteristically involve the central pons with sparing of the corticospinal tract, peripheral pons and tegmentum. In some acute cases, restricted diffusion is possible, differing from ischemic insult, which extends to the periphery of the pons with sparing of the midline (see Figure 9B). ODS: Osmotic demyelination syndrome; MCP: Middle cerebellar peduncles.
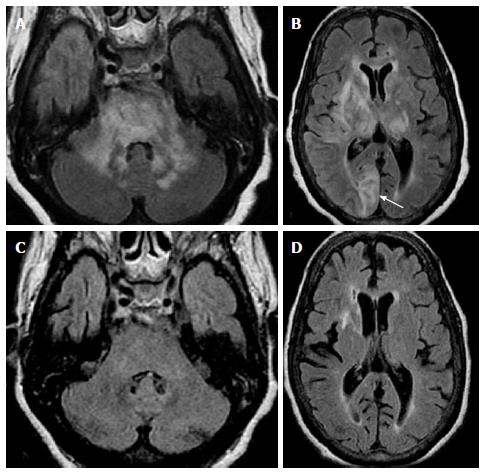
Figure 6 Posterior reversible encephalopathy.
A and B: Axial FLAIR images in an hypertense encephalopathic patient show symmetric bilateral areas of abnormal signal in the MCP and pons. Concomitant involvement of supratentorial subcortical white matter in a “vasogenic type pattern” as well as cortical involvement (arrow on B) was noted; C and D: Three months f/u after control of hypertensive crisis show almost complete resolution of abnormal signal in MCP, pons and supratentorial regions to include the basal ganglia/thalami. Given the asymmetric distribution of supratentorial lesions, PML could be included in the differential. However, cortical involvement is not characteristic for PML. This case could be considered “atypical PRES” and proved by resolution of abnormal white matter disease (compare with Figure 3 where no resolution is noted). PRES: Posterior reversible encephalopathy; MCP: Middle cerebellar peduncles; PML: Progressive multifocal leucoencephalopathy.
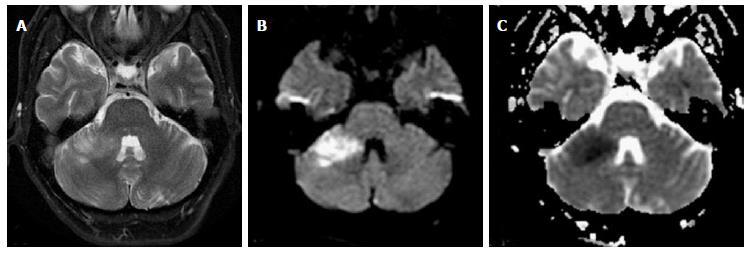
Figure 7 Anterior inferior cerebellar artery infarct.
Patient with acute cerebellar ataxia and right-sided weakness. Axial T2 (A), DWI (B) and ADC maps (C) show well-defined area of high T2 signal and restricted diffusion consistent with ischemia. DWI: Diffusion weighted-imaging.
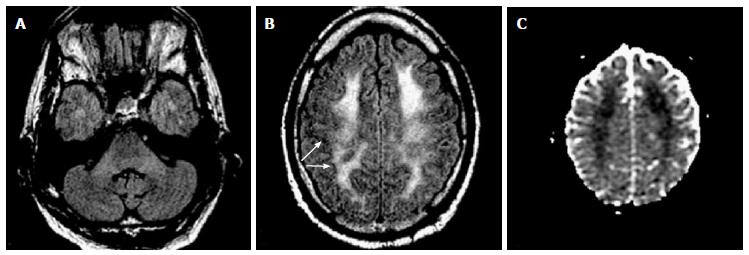
Figure 8 Acute heroin induced leukoencephalopathy (“chasing the dragon”).
Twenty-year-old patient found down, history of recent heroin inhalation. A: Axial FLAIR shows subtle increased signal of MCP; Axial FLAIR (B) and ADC maps (C) show concomitant diffuse and confluent increased white matter signal and restricted diffusion with overall sparing of the subcortical u-fibers (arrows on B) and cortex. Though difficult to differentiate from hypoxic-ischemic event, the cortical sparing is more common in toxic leukoencephalopathies. Restricted diffusion has been described not only in the acute stage of toxic heroin inhalation, but in other hypoxic-toxic-metabolic states and could represent acute intramyelinic or excitotoxic edema, in some cases reversible. Evolution could lead to a chronic “chasing the dragon”, spongiform leukoencephalopathy, where the posterior white matter, pons and MCP are typically involved. MCP: Middle cerebellar peduncles.
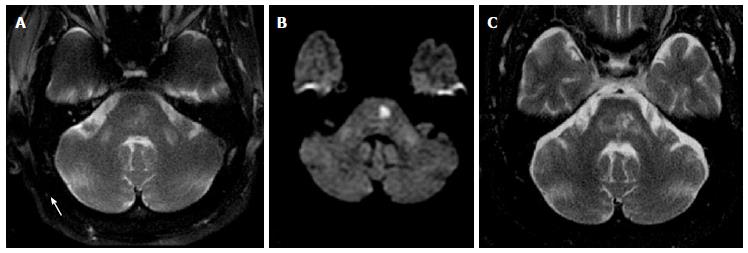
Figure 9 Wallerian degeneration of middle cerebellar peduncles.
Axial T2 (A) and DWI (B) images show symmetric areas of abnormal signal in bilateral MCP as well as focal area of restricted diffusion in the left pons (note the characteristic spare of the midline due to occlusion of para-median branches of basilar artery); Axial T2 (C), 3 years f/u, shows evolution of lacunar infarction in the pons with resolution of abnormal signal in the right MCP and persistent abnormal signal and development of volume loss in the left MCP. Findings are consistent with WD of the MCP, with “acute” early changes in the bilateral MCP and subsequent left greater than right involvement on follow up (ipsilateral to infarct). WD: Wallerian degeneration; MCP: Middle cerebellar peduncles.
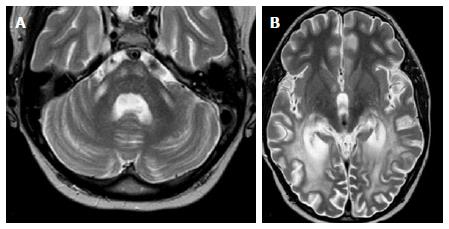
Figure 10 Adrenoleukodystrophy.
A: Axial T2 image shows symmetric increased T2 signal in the MCP and bilateral corticospinal tracts; B: Axial T2 show concomitant symmetric and confluent white matter abnormal signal in bilateral occipito-parietal regions, typical for ADL. Note the preservation of subcortical u-fibers. Images courtesy of Dr. Lily Wang. ADL: Adrenoleukodystrophy; MCP: Middle cerebellar peduncles.
Figure 11 Multiple system atrophy C type and fragile-X associated tremor-ataxia syndrome.
Axial T2 (A) in a patient with MSA-C show typical atrophy of the pons and MCP with degeneration of the pontine crossing fibers (“hot cross bun” sign, black arrow). There is also associated increased T2 signal of the MCP bilaterally. Axial T2 (B) and diffusion tensor imaging (DTI) tractography (C) in a patient with FXTAS show cerebellar volume loss and associated increased T2 signal and volume loss of MCP. Due to decreased fractional anisotropy (white arrows on C) there is lack of fibers in the areas of abnormal T2 signal. (DTI acquisition technique similar than Figure 1, please see figure for details). Image (B) courtesy of Dr. Andrew Duker. FXTAS: Fragile-X associated tremor-ataxia syndrome; MSA-C: Multiple system atrophy C type; MCP: Middle cerebellar peduncles.
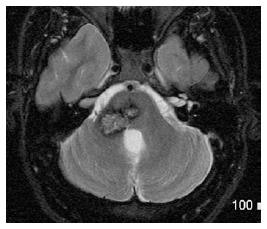
Figure 12 Cavernoma of middle cerebellar peduncle.
Axial T2-WI shows contiguous lesions involving the pons and right MCP, with a typical mixed speckled hyper-intense and hypo-intense center and peripheral halo of hypo-intensity due to chronic hemosiderin deposition. MCP: Middle cerebellar peduncles.
- Citation: Morales H, Tomsick T. Middle cerebellar peduncles: Magnetic resonance imaging and pathophysiologic correlate. World J Radiol 2015; 7(12): 438-447
- URL: https://www.wjgnet.com/1949-8470/full/v7/i12/438.htm
- DOI: https://dx.doi.org/10.4329/wjr.v7.i12.438


