Copyright
©The Author(s) 2015.
World J Radiol. Nov 28, 2015; 7(11): 361-374
Published online Nov 28, 2015. doi: 10.4329/wjr.v7.i11.361
Published online Nov 28, 2015. doi: 10.4329/wjr.v7.i11.361
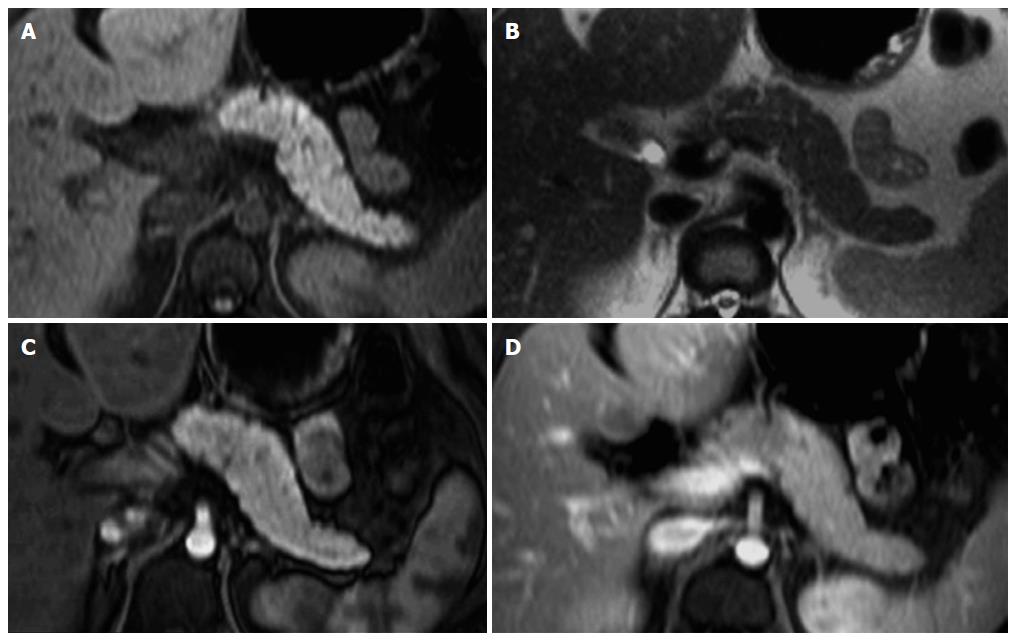
Figure 1 Normal pancreas.
Axial T2-weighted SS-ETSE (A), pre-contrast fat-suppressed T1-weighted (B) GRE and post-gadolinium fat-suppressed T1-weighted gradient echo images acquired in the arterial (C) and venous (D) phases of enhancement. The normal pancreas is high in signal intensity on T1-weighted images (B) due to the presence of aqueous protein in the pancreatic acini. A uniform capillary blush is apparent on the immediate post-gadolinium image (C). T2-weighted sequences allow the depiction of the pancreatic duct. SS-ETSE: Single-shot echo train spin echo; GRE: Gradient echo.
Figure 2 Pancreatic ductal adenocarcinoma.
Axial post-gadolinium fat-suppressed T1-weighted images obtained in the arterial phase (A) and interstitial phase (B) image, and coronal maximum intensity projection image of MRCP (C). There is a hypovascular tumor arising in the pancreatic head (arrow, A) that obstructs the common bile duct and pancreatic duct (double duct sign). This sign is well depicted in the MRCP images (C). MRCP: Magnetic resonance cholangiopancreatography.
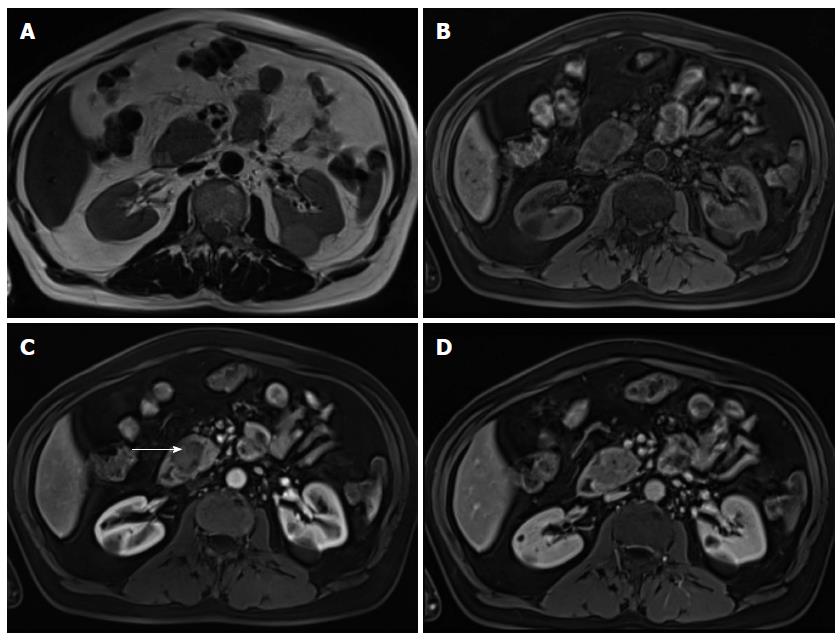
Figure 3 Pancreatic ductal adenocarcinoma.
Axial T2-weighted single-shot echo train spin echo (A), pre-contrast fat-suppressed T1-weighted (B) gradient echo (GRE) and post-gadolinium fat-suppressed T1-weighted GRE images acquired in the arterial (C) and venous (D) phases of enhancement. There is a solid nodule in the head of the pancreas, which is more conspicuous in the pre-contrast and arterial phase T1-weighted images (B, arrow, C), consistent with ductal adenocarcinoma. Note that this lesion might be imperceptible on T2-weighted images (A) and venous phase images (D).
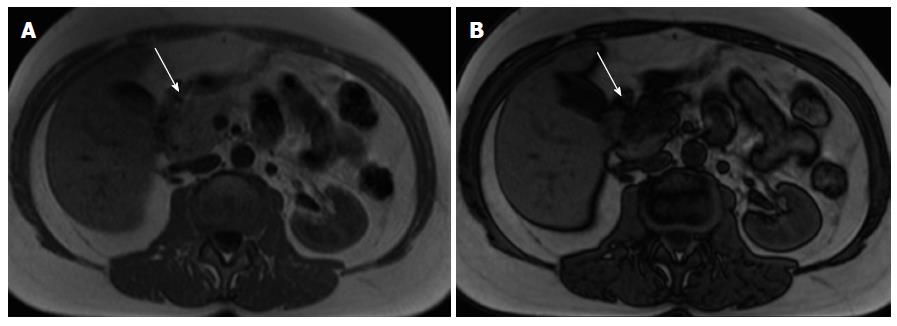
Figure 4 Pancreatic lipomatosis.
Axial in-phase (A) and out-of-phase (B) T1-weighted GRE images. There is a focal fat infiltration in the region of the pancreatic head (arrows), only noticeable in the out-of-phase images, which is diagnostic for this entity. Focal fat infiltration is a benign condition that can simulate pancreatic adenocarcinoma especially on CT. GRE: Gradient echo; CT: Computed tomography.
Figure 5 Acute pancreatitis.
Axial in-phase (A) T1-weighted GRE image and arterial phase (B) fat-suppressed T1-weighted GRE image (B) in a patient with elevated amylase. There is a nodular area in the uncinate process showing mild T1-weighted hypointensity due to edema, however showing arterial enhancement (arrow, B) and with preservation of marbled pancreatic texture. This was compatible with focal acute pancreatitis. GRE: Gradient echo.
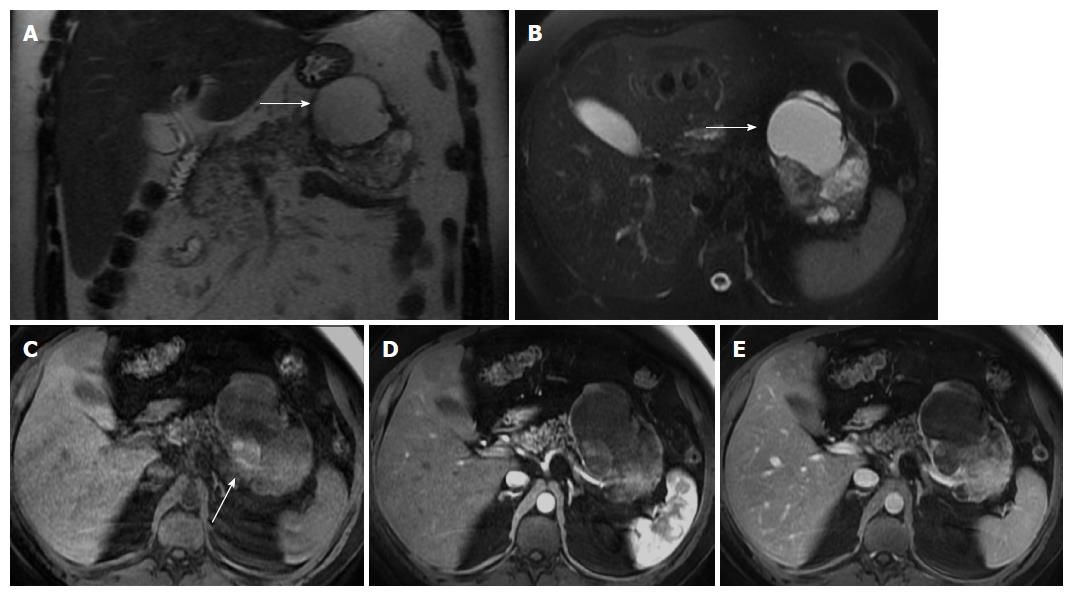
Figure 6 Solid pseudopapillary tumor.
Coronal (A) and axial fat-suppressed (B) T2-weighted SS-ETSE, pre-contrast fat-suppressed T1-weighted (C) GRE and post-gadolinium fat-suppressed T1-weighted GRE images acquired in the arterial (D) and venous (E) phases of enhancement. A large well-demarcated and encapsulated mass is located in the tail and body of the pancreas. The mass shows heterogeneous signal intensity, with cystic (arrows, A and B) and hemorrhagic areas (arrow, C). The solid component of the lesion shows progressive enhancement over time. A mass with these characteristics, appearing in a young patient is most likely related with solid pseudopapillary tumor. SS-ETSE: Single-shot echo train spin echo; GRE: Gradient echo.
Figure 7 Pancreatic neuroendocrine tumor.
Axial fat-suppressed T2-weighted SS-ETSE (A), pre-contrast fat-suppressed T1-weighted (B) GRE and arterial phase fat-suppressed T1-weighted GRE image (C). There is a small solid lesion in the tail of the pancreas (arrow, A-C), showing moderate signal intensity on T2-weighted images (arrow, A) and demonstrates marked enhancement in the arterial phase of enhancement (arrow, C). This was an insulinoma. SS-ETSE: Single-shot echo train spin echo; GRE: Gradient echo.
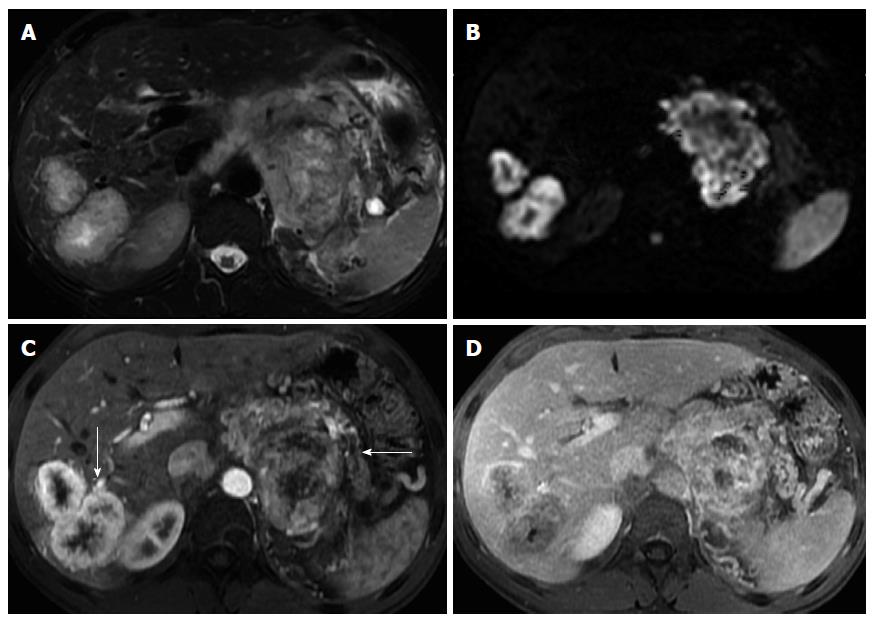
Figure 8 Pancreatic neuroendocrine tumor and liver metastases.
Axial T2-weighted SS-ETSE (A), diffusion weighted images (b = 500) (B) and post-gadolinium fat-suppressed T1-weighted GRE images acquired in the arterial (C) and venous (D) phase of enhancement. A large mass is seen arising in the body and tail of the pancreas, showing moderate signal intensity on T2-weighted images (A) and restriction to diffusion (B). This lesion shows hypervascular characteristics (C). This mass was diagnosed as poorly differentiated neuroendocrine tumor. Note that the liver metastases show similar signal characteristics on T2- and diffusion-weighted images and demonstrate the characteristic arterial wash-in (arrow, C) and late washout (D) seen with neuroendocrine tumor metastases. SS-ETSE: Single-shot echo train spin echo; GRE: Gradient echo.
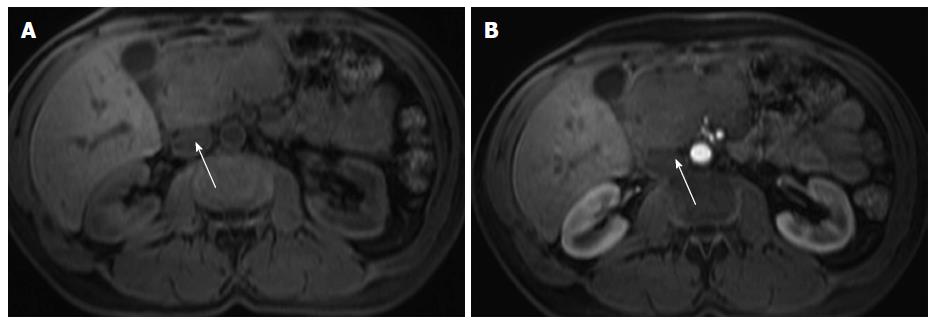
Figure 9 Pancreatic lymphoma.
Pre-contrast fat-suppressed axial T1-weighted gradient - echo images (A) and acquired in the arterial phase after gadolinium injection (B). There is a large hypointence and hypovascular mass (arrows) localized in the pancreatic head, however showing no significant duct dilatation. There was evidence of enlarged lymph nodes. This mass was diagnosed as pancreatic lymphoma.
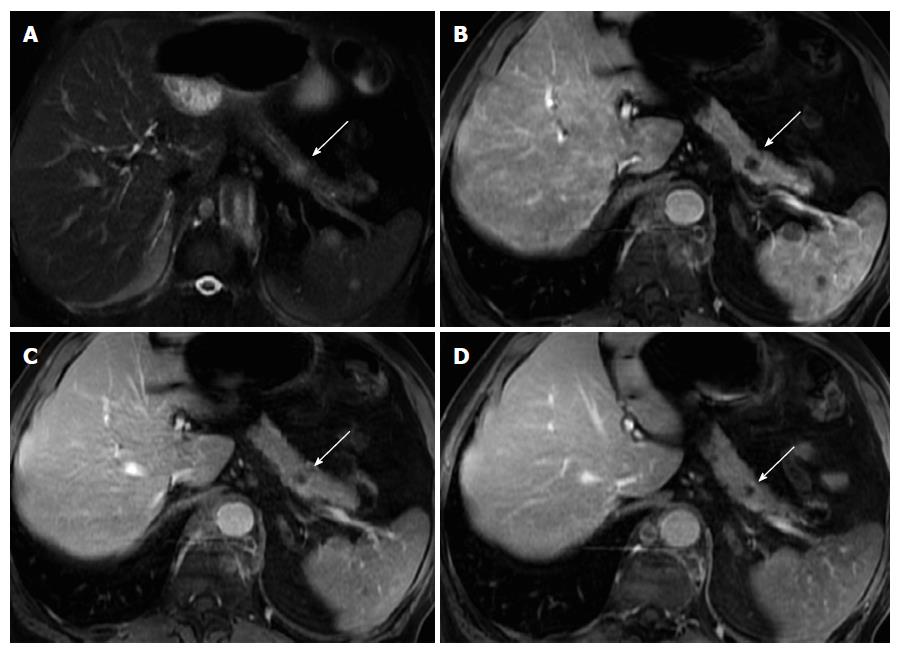
Figure 10 Solitary pancreatic metastasis.
Axial T2-weighted SS-ETSE (A) and post-gadolinium fat-suppressed T1-weighted GRE images acquired in the arterial (B), venous (C) and interstitial (D) phases of enhancement. There is a nodular lesion in the pancreatic body showing moderate signal intensity on T2-weighted images (arrow, A) and showing hypovascular characteristics, with no pancreatic duct dilatation. These are typical features of a solitary pancreatic metastasis (arrows). Note additional splenic metastases (lung cancer). SS-ETSE: Single-shot echo train spin echo; GRE: Gradient echo.
Figure 11 Intra-pancreatic splenule.
Axial T2-weighted SS-ETSE (A), pre-contrast fat-suppressed T1-weighted (B) GRE and post-gadolinium fat-suppressed T1-weighted GRE images acquired in the arterial (C) and venous (D) phases of enhancement. There is a well-marginated and lobulated round intra-pancreatic splenule (arrows, A and B) that shows isointense signal to the pancreas on T2- and T1-weighted images (A and B). This nodule is hypointense compared to the background pancreas on the precontrast T1-weighted image (B) and demonstrates lesser enhancement relative to the pancreas on the arterial phase (C) and hepatic venous phase (D). The enhancement pattern was homogenous on the postgadolinium images and similar to that of the pancreas. SS-ETSE: Single-shot echo train spin echo; GRE: Gradient echo.
- Citation: Al Ansari N, Ramalho M, Semelka RC, Buonocore V, Gigli S, Maccioni F. Role of magnetic resonance imaging in the detection and characterization of solid pancreatic nodules: An update. World J Radiol 2015; 7(11): 361-374
- URL: https://www.wjgnet.com/1949-8470/full/v7/i11/361.htm
- DOI: https://dx.doi.org/10.4329/wjr.v7.i11.361


