Copyright
©2014 Baishideng Publishing Group Inc.
World J Radiol. Sep 28, 2014; 6(9): 716-725
Published online Sep 28, 2014. doi: 10.4329/wjr.v6.i9.716
Published online Sep 28, 2014. doi: 10.4329/wjr.v6.i9.716
Figure 1 Classification of abnormalities on conventional magnetic resonance imaging sequences in suspected central nervous system infections.
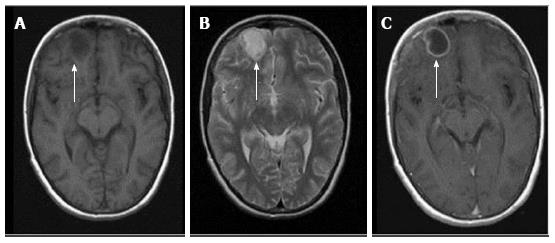
Figure 2 Ring enhancing lesions.
T1 (A), T2 (B) and T1 (C) post gadolinium images from the magnetic resonance of an acutely ill child with fever. A ring enhancing lesion is seen in the right frontal lobe. This patient had a bacterial brain abscess. The differential diagnosis of this appearance would include a brain abscess of any etiology.
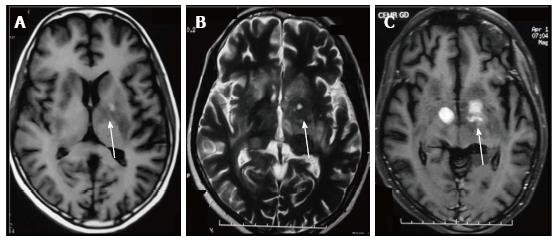
Figure 3 T1 (A), T2 (B) and Post gadolinium T1 (C) weighted images in an human immunodeficiency virus-positive patient with space occupying lesions in bilateral basal ganglia.
Differentials for this appearance in such a patient would include Toxoplasmosis, Cryptococcosis as well as central nervous system (CNS) lymphoma. This patient had CNS lymphoma.
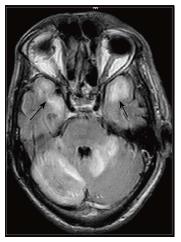
Figure 4 Fluid Attenuated Inversion Recovery Sequence in a patient with fever and altered sensorium shows hyperintensity predominantly in the grey matter of both temporal lobes and also in cerebellum.
This patient was diagnosed with Japanese B Encephalitis. A similar picture may be seen in other viral encephalitis including herpes encephalitis.
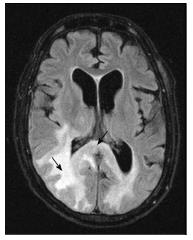
Figure 5 Fluid Attenuated Inversion Recovery Sequence image of a human immunodeficiency virus-positive patient shows hyperintensity predominantly involving the occipital white matter and splenium.
The differential diagnosis for such an appearance would include human immunodeficiency virus encephalopathy, progressive multifocal leukoencephalopathy (PML) as well as other demyelinating conditions. This patient had PML.
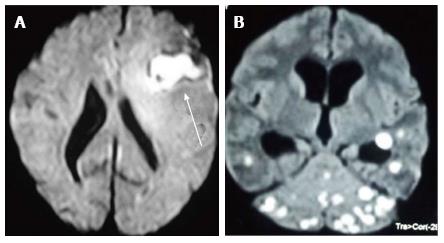
Figure 6 Diffusion weighted images show central restriction of diffusion in bacterial abscess (A) and tuberculomas (B) arrow.
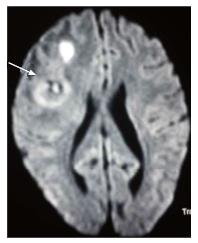
Figure 7 Diffusion weighted image in a diabetic patient shows diffusion restriction in the wall and intra-cavitary projection (arrow) in the centre of a fungal abscess.
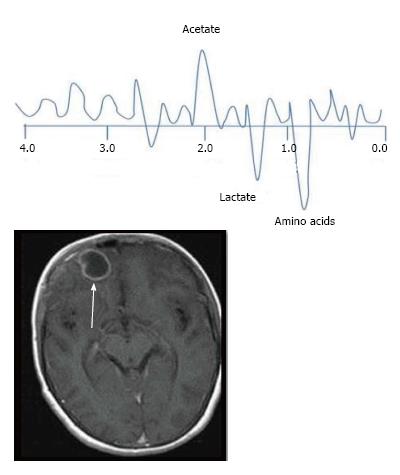
Figure 8 Representation of spectrum of metabolites in a bacterial abscess.
Proton magnetic resonance spectroscopy obtained at a time of echo of 30 milliseconds shows the presence of amino acids. Succinate and acetate are seen in anaerobic abscesses.
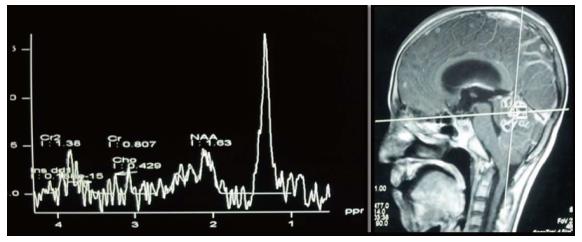
Figure 9 Proton spectroscopy at echo time of 135 ms from a tuberculoma shows a lipid peak at 1.
3 ppm.
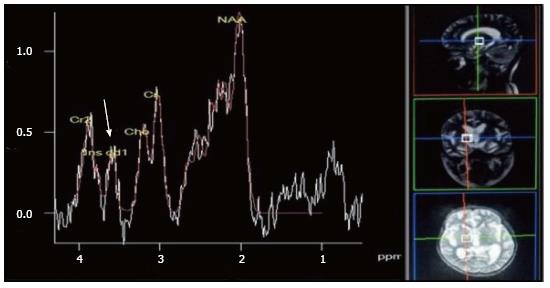
Figure 10 Proton magnetic resonance spectroscopy at time of echo of 30 ms shows multiple peaks between 3.
6 and 3.8 ppm in the spectrum obtained from a cryptococcoma (fungus) representative of trehalose peak (arrow).
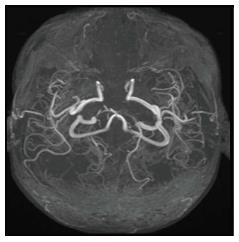
Figure 11 Time of Flight magnetic resonance angiography in a patient with tubercular meningitis.
Bilateral anterior cerebral arteries are not seen whereas bilateral middle cerebral arteries are markedly attenuated suggesting vasculitis. The patient presented with extensive cerebral infarction.
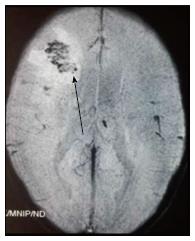
Figure 12 Foci of blooming (arrow) noted within the abscess is suggestive of haemorrhage and points to a fungal cause.
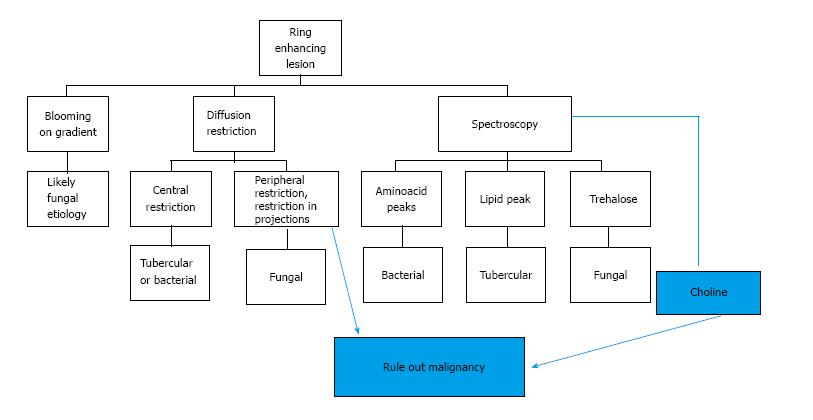
Figure 13 Approach to ring enhancing lesions.
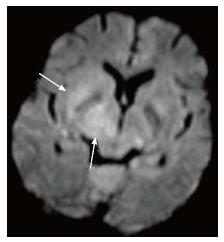
Figure 14 Diffusion weighted image from the Brain magnetic resonance imaging of an human immunodeficiency virus-positive patient with lymphoma shows restriction in the right lentiform nucleus and the thalamus (arrow).
Figure 15 Apparent diffusion coefficient map showing free diffusion within a cryptococcoma (arrow) in a human immunodeficiency virus-positive patient.
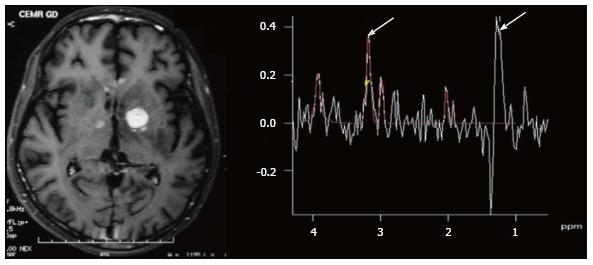
Figure 16 Proton magnetic resonance spectroscopy at echo time of 30 ms in a patient with toxoplasmosis shows a lipid lactate peak with diminished levels of all other metabolites (arrow).
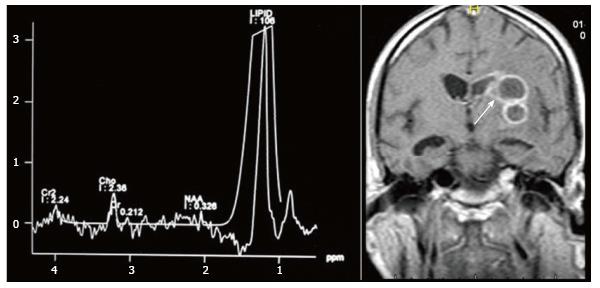
Figure 17 Proton magnetic resonance spectroscopy at echo time of 135 ms in a patient with primary central nervous system Lymphoma of basal ganglia showing elevated lipid, lactate (white arrow) and choline (open arrow).
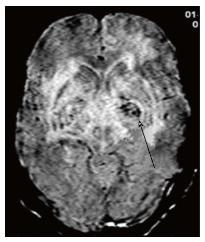
Figure 18 Gradient echo image in a patient with toxoplasmosis shows foci of blooming (arrow) suggestive of haemorrhage.
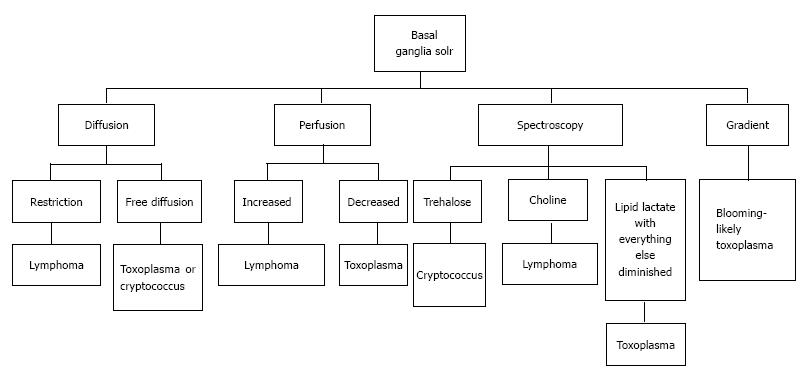
Figure 19 Approach to space occupying lesions in the basal ganglia.
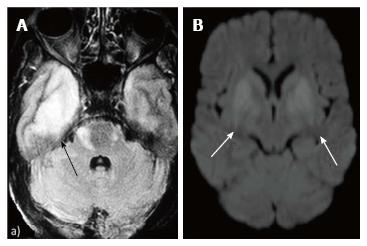
Figure 20 Fluid Attenuated Inversion Recovery Sequence hyperintensity (A) involving right temporal lobe (black arrow) in a patient with Herpes simplex virus encephalitis, diffusion weighted imaging (B) in a patient with Japanese encephalitis showing restricted diffusion in bilateral basal ganglia.
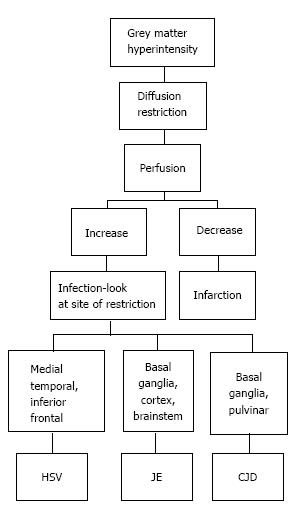
Figure 21 Approach to lesions presenting with hyperintensity predominantly involving the Grey matter.
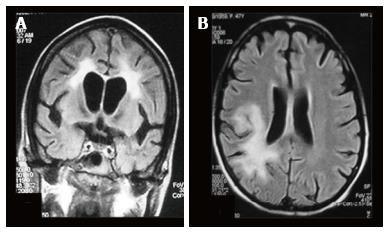
Figure 22 Fluid Attenuated Inversion Recovery Sequence image of a patient with (A) human immunodeficiency virus encephalopathy showing symmetrical periventricular white matter hyperintensity and (B) progressive multifocal leukoencephalopathy showing asymmetrical involvement of white matter, predominantly posterior subcortical white matter, with extension into the periventricular region.
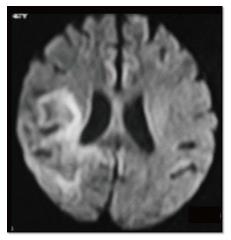
Figure 23 Diffusion weighted image in a patient with progressive multifocal leukoencephalopathy showing peripheral diffusion restriction.
Figure 24 Approach to lesions presenting with hyperintensity predominantly involving the white matter.
PML: Progressive multifocal leukoencephalopathy; HIV: Human immunodeficiency virus.
- Citation: Rangarajan K, Das CJ, Kumar A, Gupta AK. MRI in central nervous system infections: A simplified patterned approach. World J Radiol 2014; 6(9): 716-725
- URL: https://www.wjgnet.com/1949-8470/full/v6/i9/716.htm
- DOI: https://dx.doi.org/10.4329/wjr.v6.i9.716


