Copyright
©2014 Baishideng Publishing Group Inc.
World J Radiol. Sep 28, 2014; 6(9): 693-707
Published online Sep 28, 2014. doi: 10.4329/wjr.v6.i9.693
Published online Sep 28, 2014. doi: 10.4329/wjr.v6.i9.693
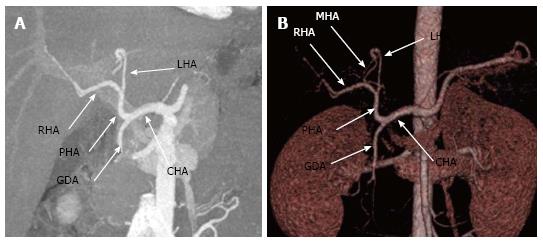
Figure 1 Conventional hepatic arterial anatomy depicted in (A) maximum intensity projection and (B) 3D volume-rendered images generated from a computed tomography angiogram.
The CHA comes off the celiac axis, gives off the GDA to become the PHA which then bifurcates into the RHA and LHA. Note the MHA (the slender branch arising from left hepatic artery as seen in 1B) arising from LHA. CHA: Common hepatic artery; GDA: Gastroduodenal artery; PHA: Proper hepatic artery; RHA: Right hepatic artery; LHA: Left hepatic artery; MHA: Middle hepatic artery.
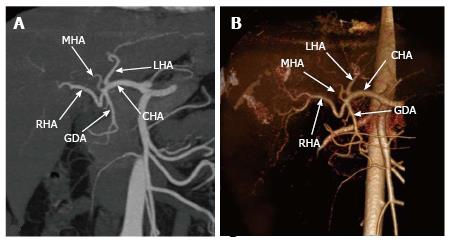
Figure 2 Maximum intensity projection (A) and volume rendered (B) images generated from a computed tomography angiogram shows a variant arterial anatomy.
The CHA arises from the celiac trunk, it gives off the LHA followed by the GDA and MHA; thereafter it continues as the RHA in (A) MIP and (B) volume rendered images generated from a CT angiogram. CHA: Common hepatic artery; LHA: Left hepatic artery; GDA: Gastroduodenal artery; RHA: Right hepatic artery; MHA: Middle hepatic artery.
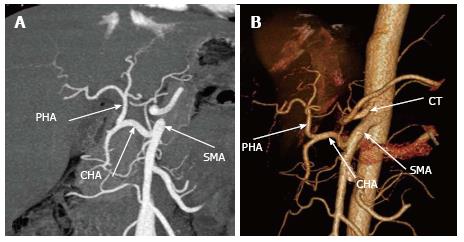
Figure 3 Michel type IX variant is shown in the (A) maximum intensity projection and (B) volume rendered images generated from a computed tomography angiogram.
There is a replaced CHA that comes off the SMA. CHA: Common hepatic artery; SMA: Superior mesenteric artery; PHA: Proper hepatic artery; CT-celiac trunk).
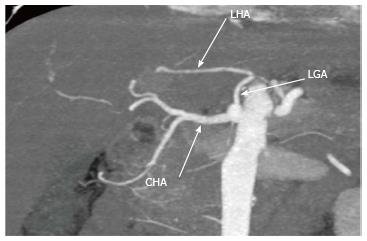
Figure 4 Coronal maximum intensity projection generated from a computed tomography angiogram shows Michel type II variant with a replaced left hepatic artery coming off the left gastric artery.
LHA: Left hepatic artery; LGA: Left gastric artery; CHA: Common hepatic artery.
Figure 5 Coronal maximum intensity projection generated from a computed tomography angiogram shows Michel type V variant where an accessory left hepatic artery arises from the left gastric artery.
LHA: Left haptic artery; LGA: Left gastric artery; aLHA: Accessory left hepatic artery.
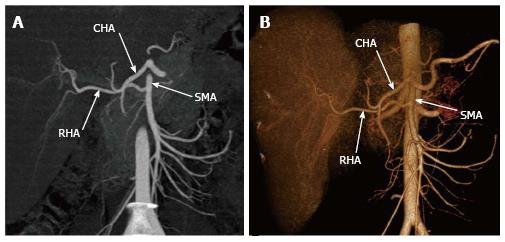
Figure 6 Maximum intensity projection (A) and volume rendered (B) images generated from a computed tomography angiogram shows Michel type III variant with a replaced right hepatic artery arising from the superior mesenteric artery.
RHA: Right hepatic artery; SMA: Superior mesenteric artery; CHA: Common hepatic artery.
Figure 7 Normal portal and hepatic venous anatomy is demonstrated in this 3D volume rendered image.
The MPV divides into RPV and LPV. The RPV then divides into the RAPV and RPPV. The three hepatic veins open into the IVC. MPV: Main portal vein; LPV: Left portal vein; RPV: Right portal vein; RAPV: Right anterior portal vein; RPPV: Right posterior portal vein.
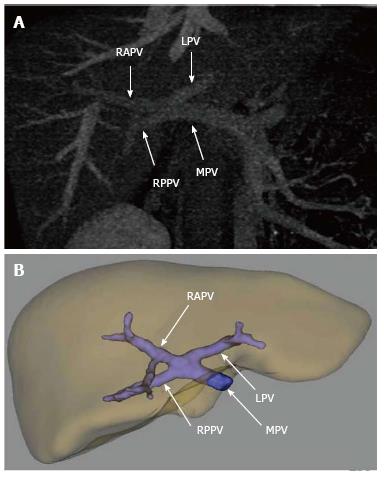
Figure 8 (A) Maximum intensity projection and (B) 3 D volume rendered image generated using dedicated software demonstrates trifurcation of the main portal vein into the right anterior portal vein, right posterior portal vein and left portal vein.
MPV: Main portal vein; RAPV: Right anterior portal vein; RPPV: Right posterior portal vein; LPV: Left portal vein.
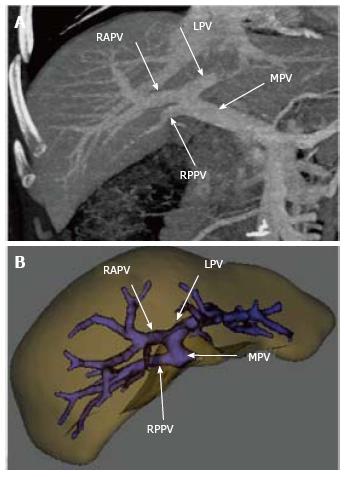
Figure 9 (A) maximum intensity projection and (B) 3 D volume rendered image generated using dedicated software shows an early origin of right posterior portal vein from the main portal vein that later bifurcates in to the right anterior portal vein and left portal vein.
RPPV: Right posterior portal vein; MPV: Main portal vein; RAPV: Right anterior portal vein; LPV: Left portal vein.
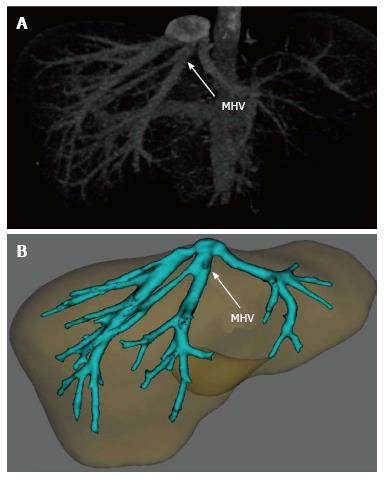
Figure 10 (A) maximum intensity projection and (B) 3 D volume rendered image generated using dedicated software demonstrates early bifurcation of the middle hepatic vein with large veins draining into it from the right hepatic lobe.
MHV: Middle hepatic vein.
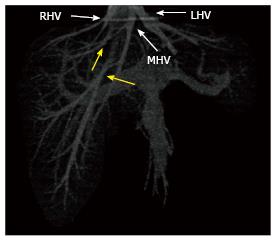
Figure 11 Three-dimensional volume rendered image generated from venous phase computed tomography scan show a relatively small right hepatic vein draining only the dome of the right lobe and two accessory right hepatic veins (yellow arrows).
In this case, the caudal accessory right hepatic vein drains the bulk of the right lobe. RHV: Right hepatic vein; MHV: Middle hepatic vein; LHV: Left hepatic vein.
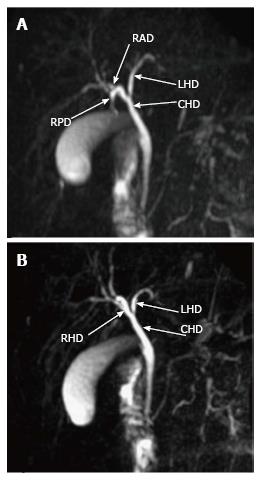
Figure 12 Thick slab magnetic resonance cholangiopancreatography images in different coronal planes demonstrates the normal biliary anatomy where right hepatic duct is formed by fusion of the right anterior duct and right posterior duct.
The RHD then joins the LHD to form the CHD. RHD: Right hepatic duct; RAD: Right anterior duct; RPD: Right posterior duct; LHD: Left hepatic duct; CHD: Common hepatic duct.
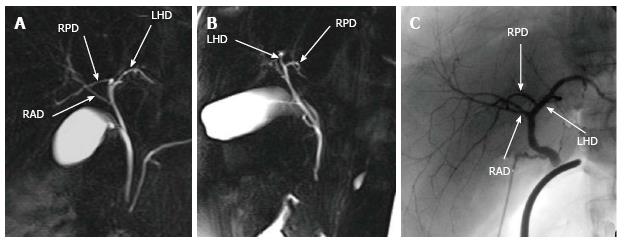
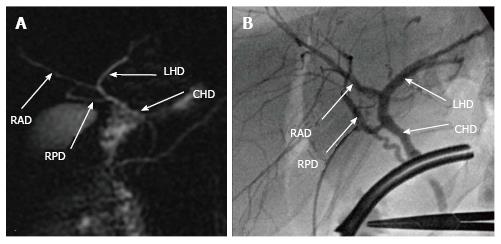
Figure 13 Thick slab coronal magnetic resonance cholangiopancreatography images at 15 degrees left anterior oblique (A) and 80 degrees right anterior oblique (B) projections demonstrate a variant biliary anatomy- the magnetic resonance cholangiopancreatography drains into the magnetic resonance cholangiopancreatography, note the intra-operative cholangiographic appearance of the same variant (C).
RHD: Right hepatic duct; RAD: Right anterior duct; RPD: Right posterior duct; LHD: Left hepatic duct; CHD: Common hepatic duct.
Figure 14 Thick slab magnetic resonance cholangiopancreatography shows a variant biliary anatomy- trifurcation pattern with a common confluence of the right posterior duct right anterior duct and left hepatic duct.
RPD: Right posterior duct; RAD: Right anterior duct; LHD: Left hepatic duct.
Figure 15 (A) Magnetic resonance cholangiopancreatography and (B) intra-operative cholangiogram in the same patient demonstrates a variant biliary anatomy-the right posterior duct drains directly into the common hepatic duct.
RPD: Right posterior duct; RAD: Right anterior duct; LHD: Left hepatic duct; CHD: Common hepatic duct.
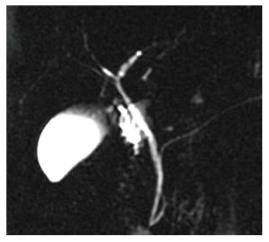
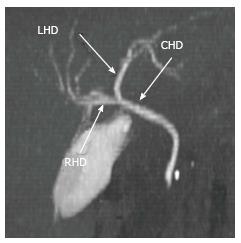
Figure 16 Maximum intensity projection image generated from a computed tomography cholangiogram.
Normal biliary anatomy is demonstrated here. LHD: Left hepatic duct; RHD: Right hepatic duct; CHD: Common hepatic duct.
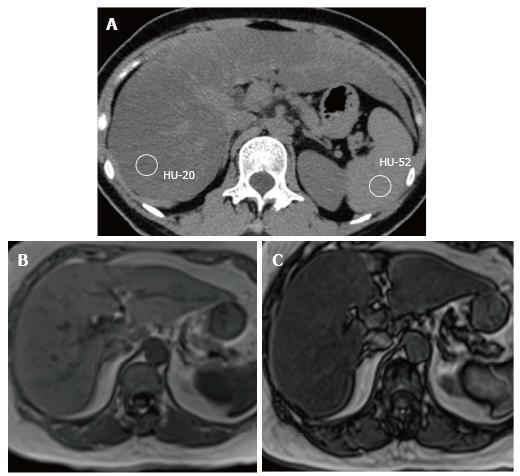
Figure 17 Diffuse hepatic steatosis is demonstrated here.
In the non-enhanced computed tomography scan (A) the hepatic parenchyma has significantly lower attenuation than spleen. The out phase magnetic resonance imaging image (C) shows a drop in the hepatic signal intensity compared to that in the in-phase image (B).
- Citation: Hennedige T, Anil G, Madhavan K. Expectations from imaging for pre-transplant evaluation of living donor liver transplantation. World J Radiol 2014; 6(9): 693-707
- URL: https://www.wjgnet.com/1949-8470/full/v6/i9/693.htm
- DOI: https://dx.doi.org/10.4329/wjr.v6.i9.693


