Copyright
©2014 Baishideng Publishing Group Inc.
World J Radiol. Sep 28, 2014; 6(9): 669-676
Published online Sep 28, 2014. doi: 10.4329/wjr.v6.i9.669
Published online Sep 28, 2014. doi: 10.4329/wjr.v6.i9.669
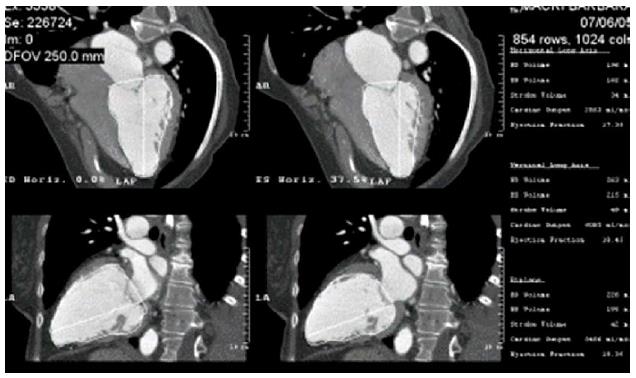
Figure 1 Multi-planar reconstruction of left ventricular cavity in 4 chamber and 2 chamber views and semi-automated calculation of left ventricular volume in both end-systole and end-diastole in biplane and 4 and 2 chamber views by the area length method.
Patient with cardiomyopathy and a very low left ventricular ejection fraction of 0.20.
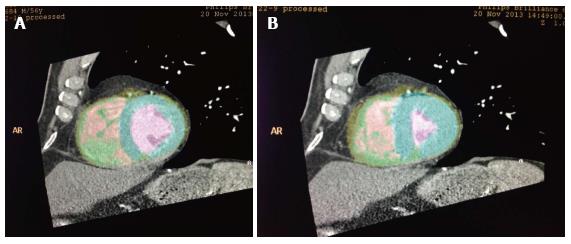
Figure 2 Automatic recognition of left ventricular cavity by automated software to calculate left ventricular volumes in end-diastole (A) and end-systole (B) to calculate left ventricular ejection fraction.
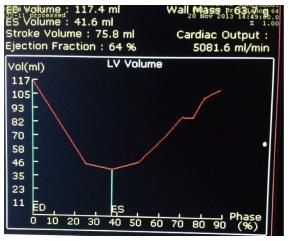
Figure 3 Time-volume curve display of left ventricular volume over different phases of the cardiac cycle (R-R interval) and calculation of left ventricular ejection fraction is displayed automatically.
Please note the smooth normal curve without registration artifact.
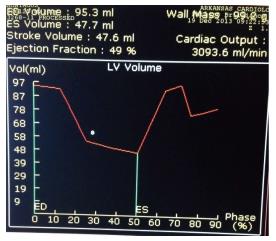
Figure 4 Shows some compromise in the time volume data as shown by the lack of smooth transition of the volume curve, and this likely represents some registration artifact towards the later part of diastole due to arrhythmias such as atrial fibrillation or frequent PVCs.
This can lead to errors in the calculation of Left ventricular ejection fraction (LVEF). A quick look at the analysis of this time volume curve data is helpful to assess the quality of the data obtained for LVEF assessment and its limitations.
- Citation: Singh RM, Singh BM, Mehta JL. Role of cardiac CTA in estimating left ventricular volumes and ejection fraction. World J Radiol 2014; 6(9): 669-676
- URL: https://www.wjgnet.com/1949-8470/full/v6/i9/669.htm
- DOI: https://dx.doi.org/10.4329/wjr.v6.i9.669


