Copyright
©2014 Baishideng Publishing Group Inc.
World J Radiol. Aug 28, 2014; 6(8): 598-606
Published online Aug 28, 2014. doi: 10.4329/wjr.v6.i8.598
Published online Aug 28, 2014. doi: 10.4329/wjr.v6.i8.598
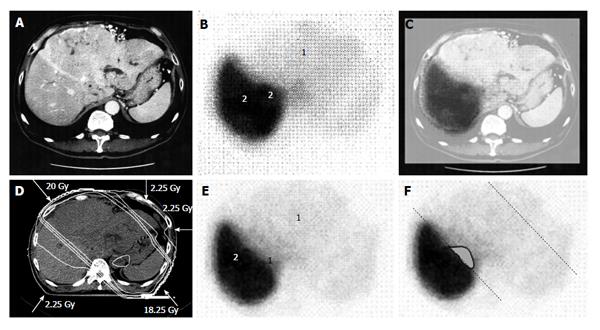
Figure 1 A 58-year-old man with hepatocellular carcinoma with a maximum diameter of 18.
0 cm. A: Contrast-enhanced computed tomography; B: Single photon emission computed tomography with Tc-99m-galactosyl human serum albumin before radiotherapy; C: The merged image of A and B. The regions (1) without GSA accumulation in B correspond to main tumor located in the left lobe. The regions (2) of high accumulation in B correspond to functional liver. These regions were identified using the merged image (C); D: Dose distribution based on the CT simulation; E: GSA-SPECT image obtained 2 mo after RT shows regions without GSA accumulation (1) along the two high-dose beams, with preservation of functional liver (2); F: The extent of radiation-induced dysfunctional liver is shown as the gray area with a black border and was determined by comparing B and E. GSA: Galactosyl human serum albumin; SPECT: Single photon emission computed tomography; CT: Computed tomography; RT: Radiotherapy.
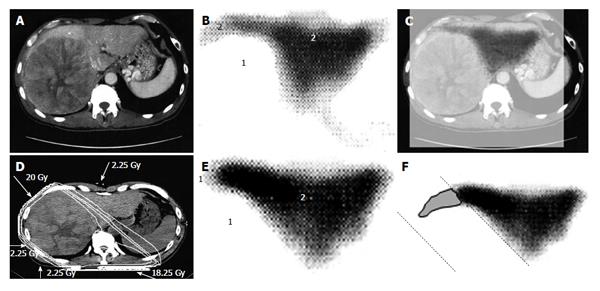
Figure 2 A 53-year-old man with hepatocellular carcinoma with a maximum diameter of 16.
5 cm. A: Contrast-enhanced computed tomography; B: Single photon emission computed tomography with Tc-99m-galactosyl human serum albumin before radiotherapy; C: The merged image of A and B; The regions (1) without GSA accumulation in B correspond to main tumor located in the right lobe. The regions (2) of high accumulation in B correspond to functional liver. These regions were identified using the merged image (C); D: Dose distribution based on the CT simulation; E: GSA-SPECT image obtained 2 mo after RT shows regions without GSA accumulation (1) along the two high-dose beams, with preservation of functional liver (2); F: The extent of radiation-induced dysfunctional liver is shown as the gray area with a black border and was determined by comparing B and E. GSA: Galactosyl human serum albumin; SPECT: Single photon emission computed tomography; CT: Computed tomography; RT: Radiotherapy.
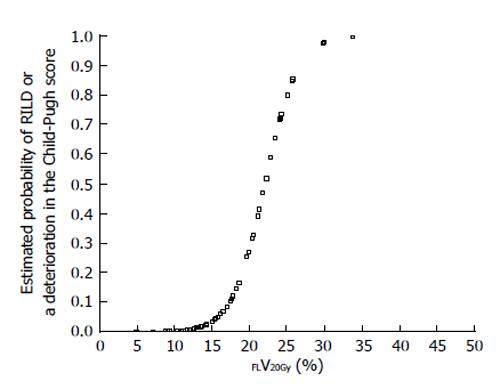
Figure 3 Estimated probability of radiation-induced liver disease or a deterioration in the Child-Pugh score by ≥ 1 point according to percentage of functional liver irradiated with ≥ 20 Gy (FLV20Gy).
Probability values were estimated by logistic regression analysis. RILD: Radiation-induced liver disease.
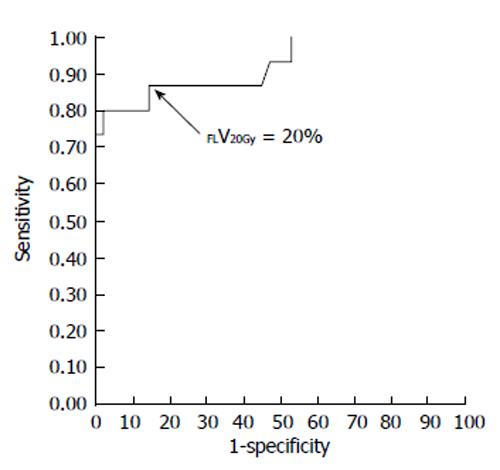
Figure 4 Receiver-operating characteristic curve for the percentage of functional liver volume irradiated with ≥ 20 Gy (FLV20Gy).
The optimal cutoff value for FLV20Gy was 20% for predicting radiation-induced liver disease or a deterioration in the Child-Pugh score of ≥ 1 point. At this cutoff value, sensitivity and specificity were 0.867 and 0.857, respectively. The area under the receiver-operating characteristic curve was 0.923 (P < 0.001). Journal of Gastroenterology and Hepatology Research gave assurance that the copyright for this figure is retained by the authors.
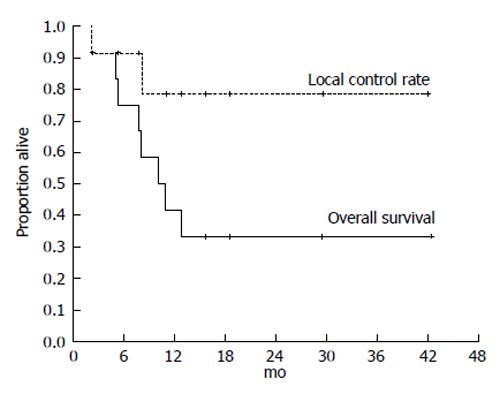
Figure 5 Kaplan-Meier analysis of the local control rate of the irradiated tumor and the survival in 12 cases of hepatocellular carcinoma exceeding 14 cm following single photon emission computed tomography-based three-dimensional radiotherapy.
Cancer and Clinical oncology gave assurance that the copyright for this figure is retained by the authors.
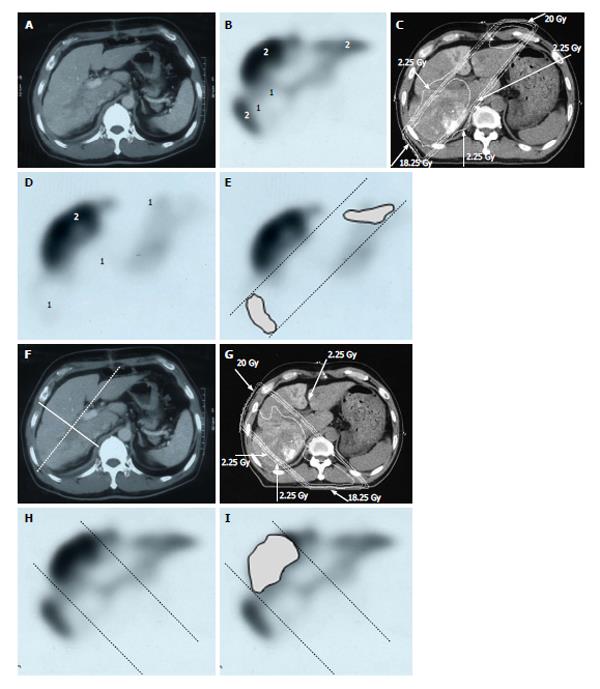
Figure 6 Distribution of functional liver and treatment planning for a 60-year-old male with hepatocellular carcinoma and liver cirrhosis of Child-Pugh grade A.
A: Contrast-enhanced computed tomography shows a PVTT in the right first portal vein originating from the right posterior sub-segment branch of the portal vein; B: GSA-SPECT taken before RT at the same level as A confirms that functional liver (2) is unevenly distributed between the anterior and lateral sides of the right PVTT. 1 = dysfunctional liver; C: The two main radiation beams were angled in the left-anterior to right-posterior direction (20 Gy) and in the right-posterior to left-anterior direction (18.25 Gy beam); D: GSA-SPECT image obtained 2 mo after RT shows functional liver (2) and preservation of the right anterior sub-segment. This image also shows that the extent of dysfunctional liver has increased in the right posterior and left medial sub-segments; E: The extent of radiation-induced dysfunctional liver is shown as the dark gray area; F-I: Hypothetical treatment planning; F: The hypothetical main beams are angled in the right-anterior to left-posterior direction (solid lines), unlike the actual beams (dotted lines); G: The hypothetical radiation beams are angled in the right-anterior to left-posterior direction (20 Gy) and in the left-posterior to right-anterior direction (18.25 Gy). Although the radiation-induced destruction of normal liver can be estimated, it is difficult to predict the extent of radiation-induced destruction of functional liver from CT simulation alone; H: GSA-SPECT image together with the hypothetical main beams; I: The gray area indicates the extent of radiation-induced dysfunctional liver likely to be induced by the hypothetical main beams. The relative difference in the destruction of functional liver between the real and the hypothetical treatment plans can be estimated by comparing E and I. PVTT: Portal vein tumor thrombus; GSA-SPECT: Galactosyl human serum albumin-single photon emission computed tomography with Tc-99m-galactosyl human serum albumin image; RT: Radiotherapy; CT: Computed tomography.
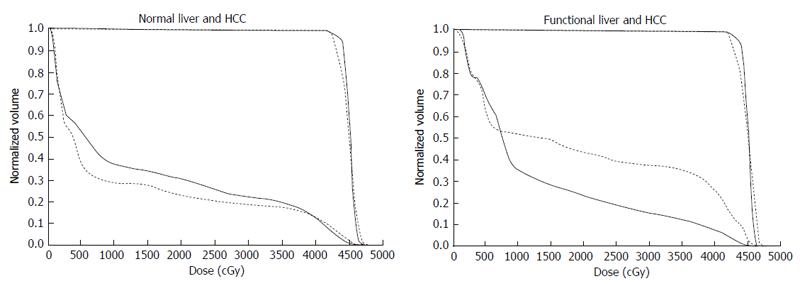
Figure 7 Comparison of dose-volume histograms between actual treatment plans (solid lines) and hypothetical treatment plans (dotted lines).
A: Comparison of the DVH for normal liver. In this case, the percentage of the normal liver irradiated with ≥ 20 Gy (NLV20Gy) was 23.1% for the hypothetical treatment plan vs 30.8% for the actual treatment plan. Therefore, irradiation of normal liver is lower for the hypothetical treatment plan than for the actual treatment plan; B: Comparison of the DVH for functional liver. In this case, the percentage of functional liver irradiated with ≥ 20 Gy (FLV20Gy) was 43.7% for the hypothetical treatment plan vs 23.8% for the actual treatment plan. Therefore, irradiation of functional liver is lower for the actual treatment plan than for the hypothetical treatment plan. The difference between NLV20Gy and FLV20Gy in these two settings is due to the uneven distribution of functional liver. DVH: Dose-volume histograms; HCC: Hepatocellular carcinoma.
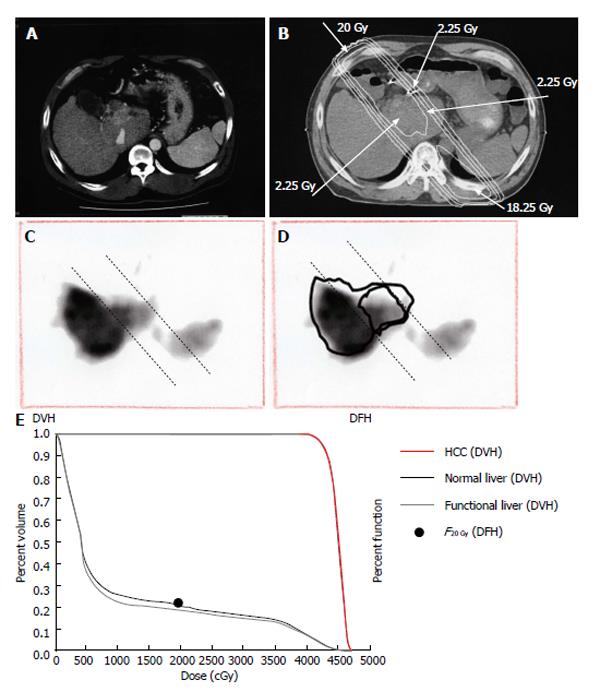
Figure 8 Quantitative analysis of radiation-induced dysfunctional liver.
A: Computed tomographic image of a 52-year-old man with a recurrent tumor thrombus in the main portal vein after undergoing left hepatectomy for hepatocellular carcinoma; B: Isodose curves used for treatment planning; C: F20Gy was calculated from the GSA count of the entire liver and the area within the 20 Gy isodose curve; D: F20 Gy was calculated from a single photon emission computed tomography with Tc-99m-galactosyl human serum albumin image using the formula: F20 Gy = 100 × (GSA count in the area of the liver within the 20 Gy isodose curve)/(GSA count for the entire liver); E: In this patient, F20Gy was 22.2%. GSA: Galactosyl human serum albumin; DVH: Dose volume histogram; DFH: Dose function histogram; HCC: Hepatocellular carcinoma.
- Citation: Shirai S, Sato M, Noda Y, Kumayama Y, Shimizu N. Incorporating GSA-SPECT into CT-based dose-volume histograms for advanced hepatocellular carcinoma radiotherapy. World J Radiol 2014; 6(8): 598-606
- URL: https://www.wjgnet.com/1949-8470/full/v6/i8/598.htm
- DOI: https://dx.doi.org/10.4329/wjr.v6.i8.598


