Copyright
©2014 Baishideng Publishing Group Inc.
World J Radiol. Jun 28, 2014; 6(6): 329-343
Published online Jun 28, 2014. doi: 10.4329/wjr.v6.i6.329
Published online Jun 28, 2014. doi: 10.4329/wjr.v6.i6.329
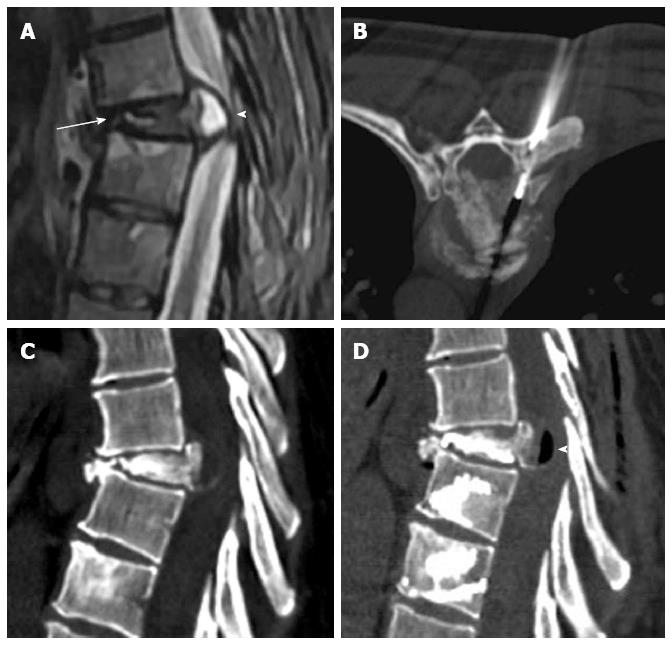
Figure 1 Sagittal T2 weighted (A) image shows metastatic compression fracture with intravertebral cleft (arrow) and epidural cyst (arrowhead), computed tomography guided biopsy (B), Sagittal computed tomography before (C) and after (D) vertebroplasty showing air filling of the cyst (arrowhead).
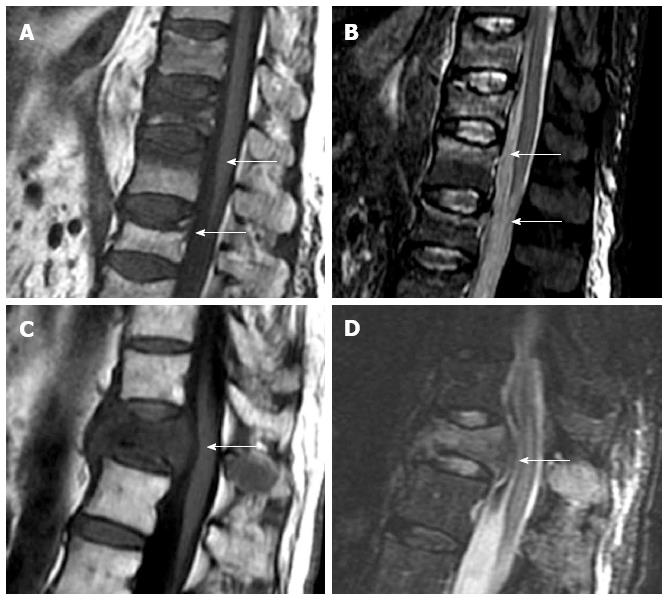
Figure 2 Sagittal T1 weighted (A) and STIR (B) images of osteoporotic fractures with typical band-like subchondral edema (arrows), sagittal T1 weighted (C) and STIR images (D) of a pathologic fracture, due to vertebral metastases, with typical convex border (arrows).
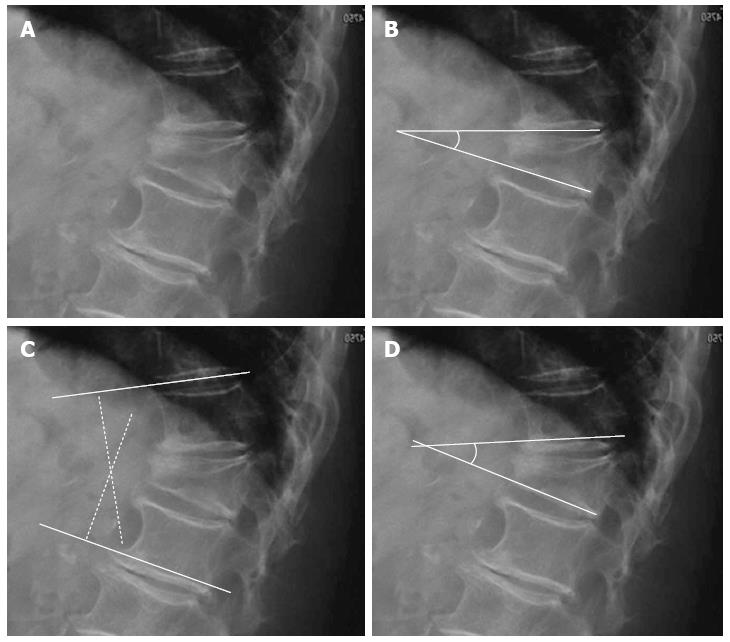
Figure 3 Segmental kyphotic deformity.
A: Wedge fracture of T12; B: Local vertebral kyphosis angle; C: Regional kyphosis; D: Segmental kyphosis (SK). One vertebra, one disc=one segment. Sagittal index (SI): SI = SK-X (X = +5 in the thoracic spine, X = -10 in the lumbar spine, X = 0 in T12-L1).
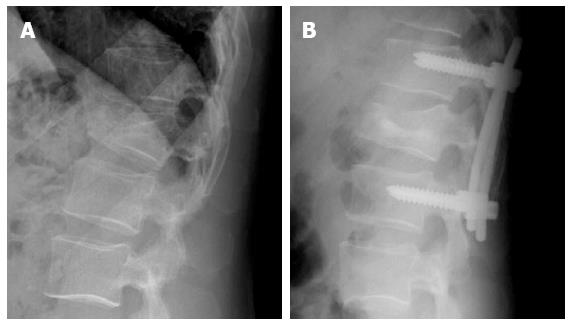
Figure 4 Forty-five years old man with acute Wedge impaction fracture of L1 (A) treated by posterior instrumentation and vertebral body kyphoplasty using biological cement (B).
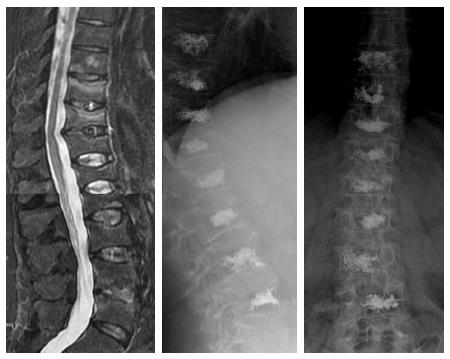
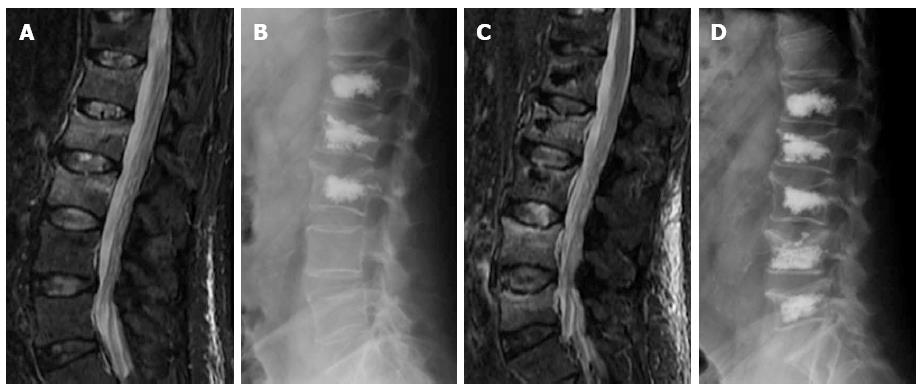
Figure 5 Sagittal STIR image (A) in a patient with multiple thoracolumbar compression fractures, eight vertebrae were treated in the same procedure (B and C).
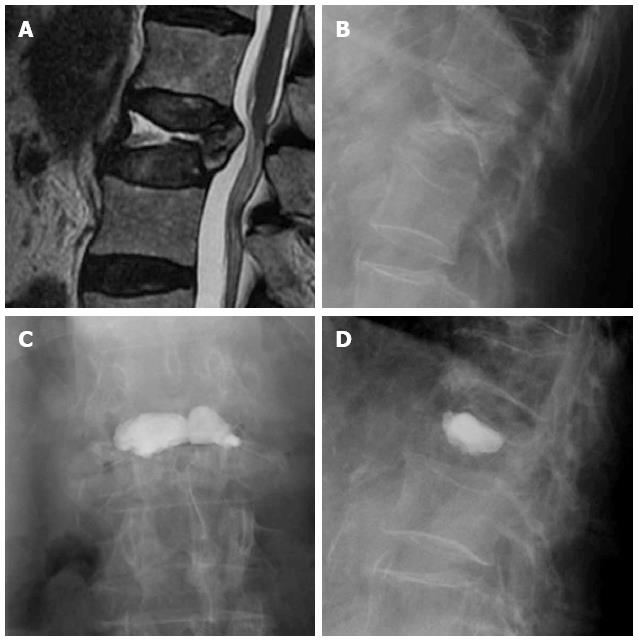
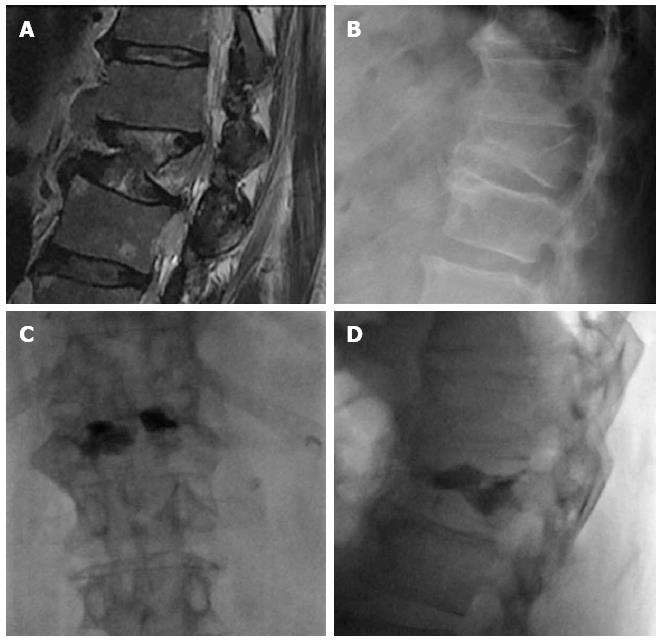
Figure 6 Sagittal T2 weighted image (A) and lateral X-ray film (B) of a vertebral fracture with intravertebral cleft, AP (C) and lateral (D) view after vertebroplasty.
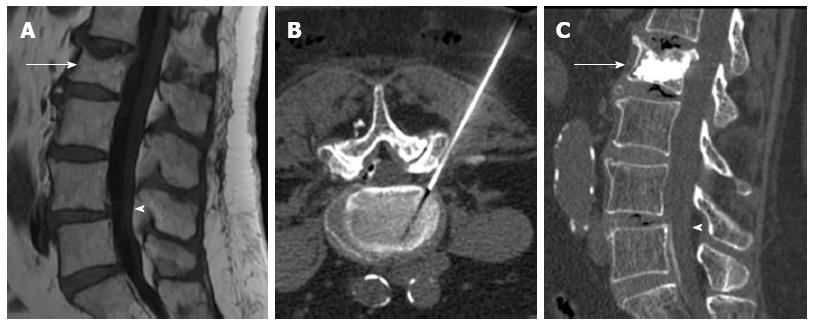
Figure 7 Sagittal T1 weighted image (A) showing vertebral compression fracture of L2 (arrow) and degenerative spondylolisthesis of L4 (arrowhead), computed tomography guided transforaminal epidural injection (B), Sagittal computed tomography after vertebroplasty (arrow) and epidural injection (arrowhead) (C).
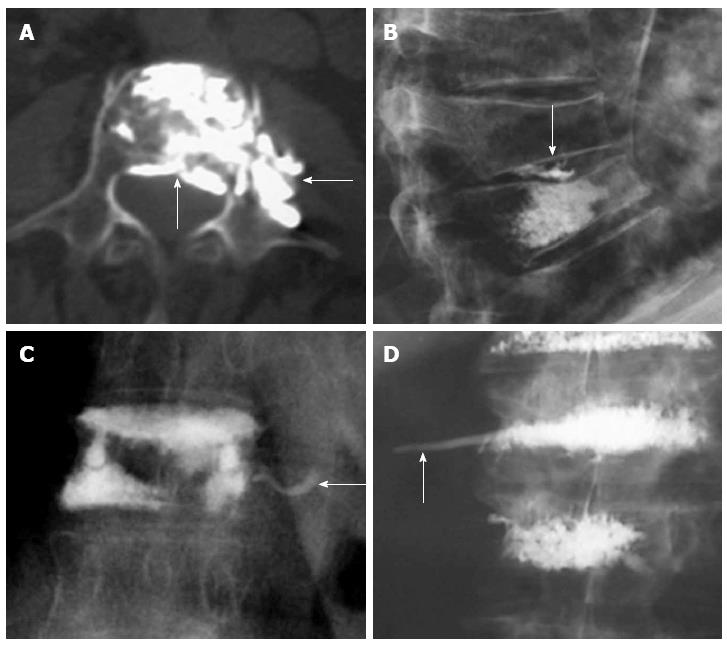
Figure 8 Axial computed tomography shows extravasations to epidural space and paravertebral area (arrows) (A), leakage to the intervertebral disc (arrow) (B), venous leakage (arrow) (C), tail of cement in the path of the needle (arrow) (D).
Figure 9 Sagittal STIR magnetic resonance image (A) shows fractures with edema of L1 to L3.
Kyphoplasty was performed in these vertebrae (B), 3 wk later back pain returned and magnetic resonance imaging showed development of new fractures in L4 and L5 (C), vertebroplasty was performed at these levels (D).
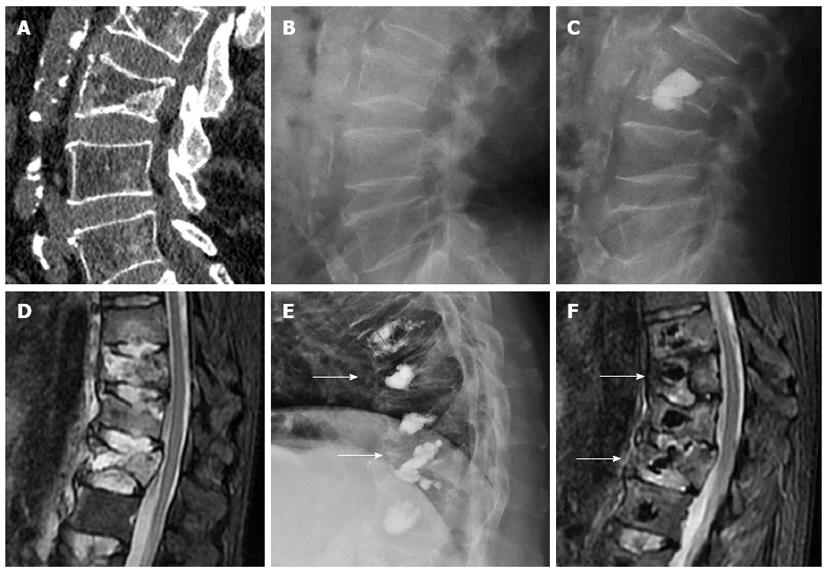
Figure 10 Sagittal computed tomography (A) a lateral radiography (B) showing fracture of L3 with intravertebral cyst (arrow), after Kyphoplasty (C) the ball of cement is not incorporated to the instable vertebral fracture, sagittal STIR image showing multiple thoracolumbar fractures with edema (D), treated with vertebroplasty, the cement do not stabilized the fracture of T10 and T12 (arrows) with persistent edema 6 mo after the procedure (E, F).
Figure 11 Sagittal T2 magnetic resonance weighted image (A) and lateral X-ray film (B) showing a severe collapse of L1, AP (C) and lateral (D) view after vesselplasty.
Figure 12 Sagittal magnetic resonance imaging T1 weighted image of a patient with vertebral metastases (A), radiofrequency thermal ablation was performed before cementation (B, C), post procedure computed tomography (D).
- Citation: Santiago FR, Chinchilla AS, Álvarez LG, Abela ALP, García MDMC, López MP. Comparative review of vertebroplasty and kyphoplasty. World J Radiol 2014; 6(6): 329-343
- URL: https://www.wjgnet.com/1949-8470/full/v6/i6/329.htm
- DOI: https://dx.doi.org/10.4329/wjr.v6.i6.329


