Copyright
©2014 Baishideng Publishing Group Co.
World J Radiol. Apr 28, 2014; 6(4): 106-115
Published online Apr 28, 2014. doi: 10.4329/wjr.v6.i4.106
Published online Apr 28, 2014. doi: 10.4329/wjr.v6.i4.106
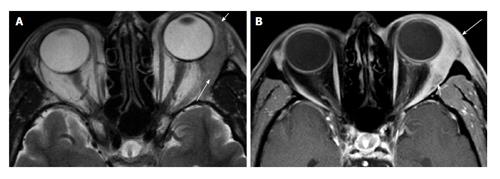
Figure 1 Dacryoadenitis.
A: Axial T2 shows diffuse enlargement of the left lacrimal gland. Note the tapered posterior margin (long arrow), as well as the involvement of the orbital lobe (short arrow). These findings suggest a lymphoid or inflammatory process rather than an epithelial neoplasm; B: Axial fat-suppressed contrast-enhanced T1 shows infiltration of the preseptal (long arrow) and post septal (short arrow) fat. These features suggest orbital inflammatory disease rather than orbital lymphoma.
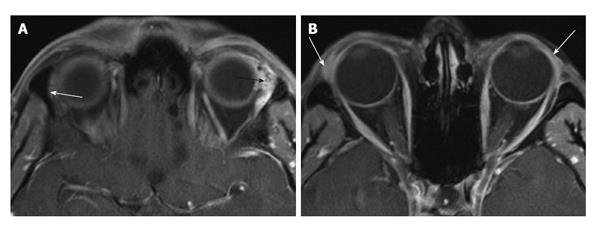
Figure 2 Adenoid cystic carcinoma of the lacrimal gland.
A: Axial T1 non-enhanced MRI showing an enlarged, heterogeneous left lacrimal gland (black arrow). Compare this to the contralateral normal gland (white arrow); B: Axial T1 non-enhanced MRI showing sparing of the palpebral lobe (arrows). MRI: Magnetic resonance imaging.
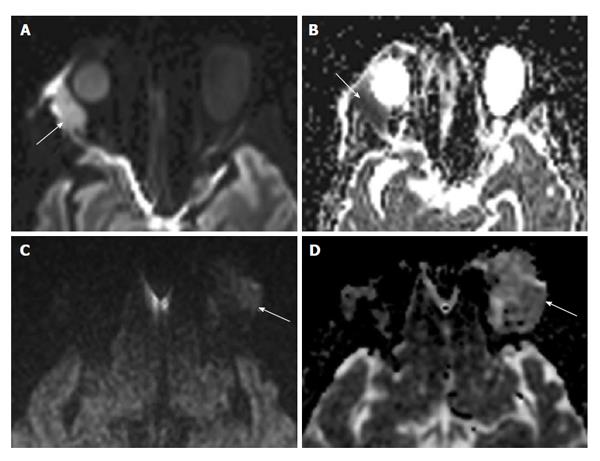
Figure 3 Lacrimal gland lymphoma (A and B) compared to inflammatory dacryoadenitis (C and D).
A: DWI image in a patient with lacrimal gland lymphoma. Note the bright signal intensity (arrow) secondary to inhibition of water movement by the densely packed lymphoma cells; B: The corresponding ADC map of this patient shows an associated reduction in ADC, represented by the dark signal just lateral to the orbit (arrow); C: DWI image in a patient with inflammatory dacryocystadenitis. Note the dark signal compared to the patient with lymphoma (arrow); D: ADC map shows bright signal in the involved lacrimal gland (arrow) as compared to normal brain parenchyma. DWI: Diffusion-weighted imaging; ADC: Apparent diffusion coefficient.
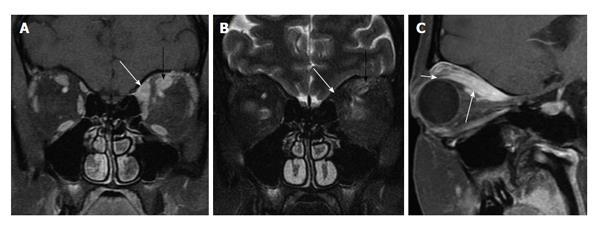
Figure 4 Myositic pseudotumor.
A: Coronal fat-suppressed contrast-enhanced T1 shows enlarged left superior oblique (white arrow) and superior rectus (black arrow) muscles, and mild infiltration of the surrounding fat; B: Coronal fat-suppressed T2 shows low signal in the superior oblique muscle (white arrow), suggesting a more chronic, burned out process, whereas the superior rectus muscle (black arrow) shows brighter signal, indicative of a more acute process; C: Parasagittal oblique fat-suppressed contrast-enhanced T1 shows an enlarged superior rectus muscle belly (long arrow). The tendinous insertion (short arrow) is uncharacteristically spared by this process. Nevertheless, unilateral disease, infiltration of the surrounding fat, and early involvement of the superior oblique muscle indicate pseudotumor ahead of thyroid eye disease.
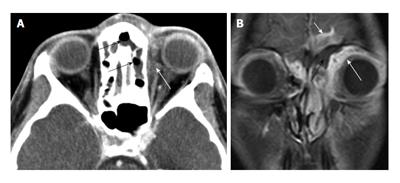
Figure 5 Infectious orbital cellulitis.
A: Axial CT showing layering fluid in the ethmoid sinus and frontal recess on the left (black arrows), and infiltration of the orbital fat (white arrow); B: Coronal T1 fat saturated post-gadolinium MRI demonstrates orbitalfat infiltration (long white arrow). Fluid in the adjacent ethmoid sinus (black arrow) and intracranial extension of the process (short white arrow) are also features that indicate infection rather than orbital inflammatory disease. CT: Computed tomography; MRI: Magnetic resonance imaging.
Figure 6 Indirect carotid-cavernous fistula.
A: Coronal T2 MRI with fat saturation demonstrating mild infiltration of orbital fat (arrowhead) and thickening with high signal intensity in the EOMs. In this image, the lateral rectus muscle appears brightest (short white arrow). Note the enlarged SOV (long white arrow), suggesting CCF over myositis; B: Axial post-gadolinium T1 MRI with fat saturation. The SOV (long white arrow) is engorged secondary to retrograde flow from the cavernous sinus. The superior oblique muscle (short white arrow) is also enlarged; C: Angiogram with lateral projection common carotid artery injection (patient facing to the right) showing abnormal early filling in the cavernous sinus and SOV (short black arrows), as well as an abnormal tangle of vessels along dorsal surface of cavernous sinus (long black arrow), representing abnormally dilated intracavernous ICA branches. MRI: Magnetic resonance imaging; EOM: Extraocular muscles; SOV: Superior ophthalmic vein; CCF: Carotid cavernous fistula; ICA: Internal carotid artery.
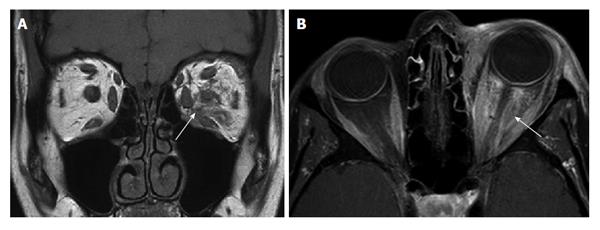
Figure 7 Diffuse cellulitic orbital inflammatory disease.
A: Coronal T1-weighted image shows diffuse infiltration of the intraconal fat on the left (arrow); B: Axial fat-suppressed contrast-enhanced T1 shows diffuse enhancement throughout the intraconal fat. No well-defined focal mass or focal fluid collection is seen.
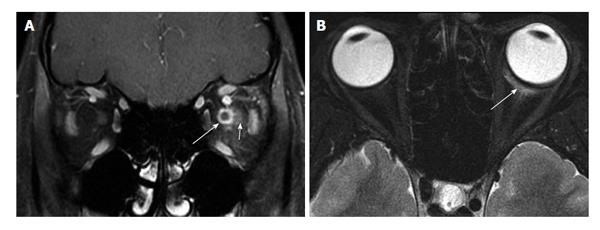
Figure 8 Perineuritic orbital inflammatory disease.
A: Coronal fat-suppressed contrast-enhanced T1 shows circumferential enhancement about the left optic nerve (long arrow), with sparing of the nerve substance. There is also mild infiltration of the surrounding soft tissues (short arrow); B: Axial fat-suppressed T2 shows a small amount of edema about Tenon’s capsule (arrow). This finding, along with clinical history of acute, painful presentation, help distinguish perineuritic pseudotumor from en plaque optic nerve sheath meningioma.
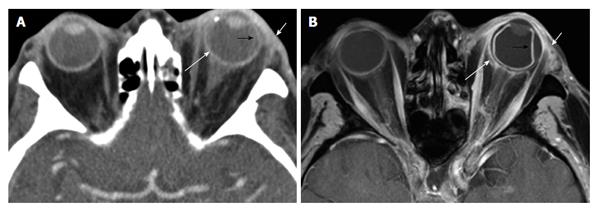
Figure 9 Periscleritic orbital inflammatory disease.
Eighty-seven-year-old immunocompromised man with left eye pain and ordering indication of “cellulitis”. A: Axial contrast-enhanced CT shows mild infiltration of the left periorbital fat (short white arrow). There is also periscleral edema (long white arrow), and subtle high density along the temporal surface of the globe that is suggestive of a subchoroidal fluid collection (black arrow); B: Axial fat-suppressed contrast-enhanced T1 shows these findings more conspicuously. Note that the elevated choroid layer (black arrow) extends anteriorly to the region of the ciliary body. Periscleral edema (long white arrow) extending to Tenon’s capsule is better seen. CT: Computed tomography.
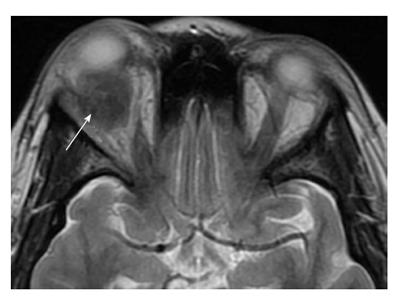
Figure 10 Orbital inflammatory disease producing a focal mass.
Axial T2 shows a well-defined, T2 hypointense mass in the right orbit, discrete from adjacent extraocular muscles and from the lacrimal gland.
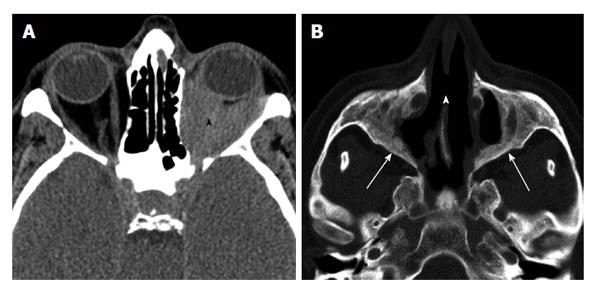
Figure 11 Wegener's granulomatosis.
A: Non-enhanced axial CT through orbit demonstrating diffuse infiltration of orbital fat (black arrowhead); B: Axial CT in through sinuses in bone window shows destruction of medial maxillary sinus walls, perforation of nasal septum (white arrowhead), and chronic neo osteogenesis along sinus walls (white arrows). CT: Computed tomography.
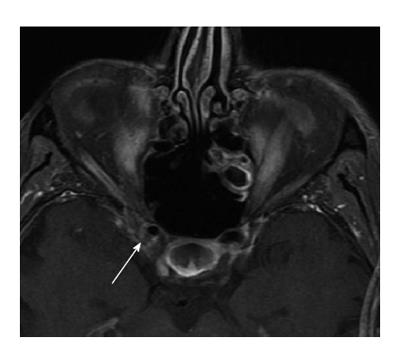
Figure 12 Orbital apicitis (Tolosa-Hunt).
Axial fat-suppressed contrast-enhanced T1 shows ill-defined enhancement involving the right orbital apex, and extending into the middle cranial fossa along the margin of the cavernous sinus (arrow).
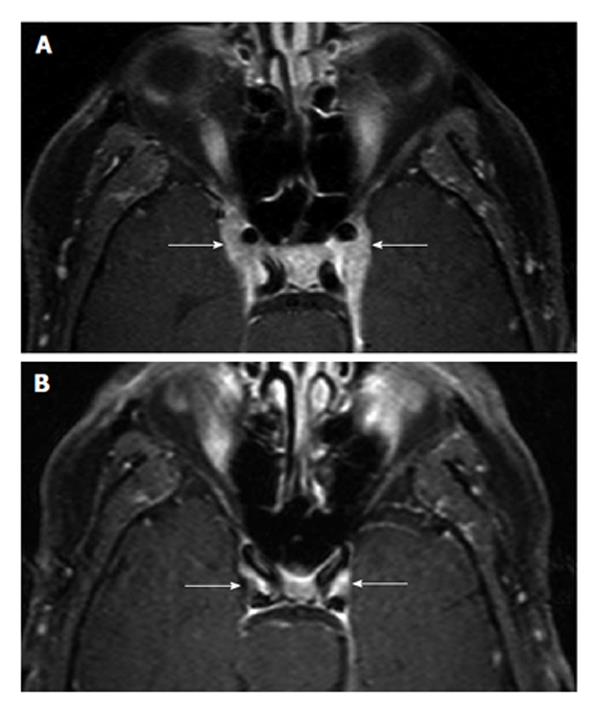
Figure 13 Tolosa-Hunt syndrome, before and after treatment.
A: Axial fat-suppressed contrast-enhanced T1 showing bilateral cavernous sinus infiltration and enhancing tissue along the lateral margins of the cavernous sinus; B: Complete resolution after treatment.
- Citation: Pakdaman MN, Sepahdari AR, Elkhamary SM. Orbital inflammatory disease: Pictorial review and differential diagnosis. World J Radiol 2014; 6(4): 106-115
- URL: https://www.wjgnet.com/1949-8470/full/v6/i4/106.htm
- DOI: https://dx.doi.org/10.4329/wjr.v6.i4.106


