Copyright
©2013 Baishideng Publishing Group Co.
World J Radiol. Apr 28, 2013; 5(4): 166-172
Published online Apr 28, 2013. doi: 10.4329/wjr.v5.i4.166
Published online Apr 28, 2013. doi: 10.4329/wjr.v5.i4.166
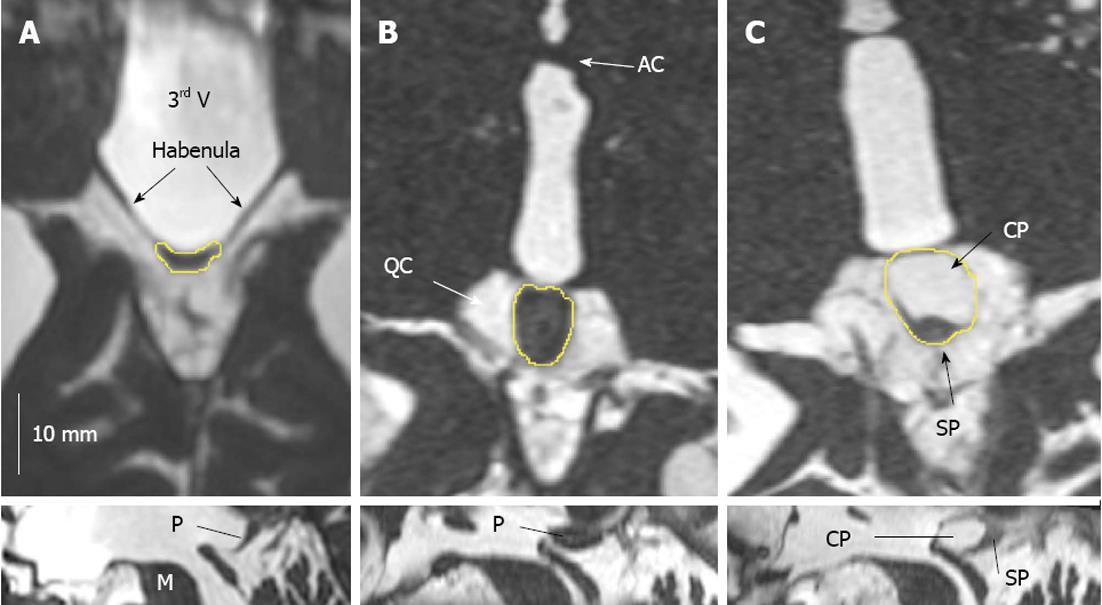
Figure 1 TrueFISP imaging of the pineal region illustrating the spectrum of pineal volumes and cysts.
A, B: Solid glands. Smallest pineal parenchyma volume (PPV), 5 mm3, the small pineal gland can hardly be demarcated from the habenula (A); largest PPV, 228 mm3 (B); C: Largest single cyst, 189 mm3. The pineal gland was axially reformatted along its long axis. the cystic part (CP) of the pineal gland is larger than the solid part (SP) and accounts for most of the pineal volume. Upper row: Axial reconstruction; Lower row: Sagittal reconstruction. 3rd V: Third ventricle; AC: Anterior commissure; M: Mesencephalon; P: Pineal gland; QC: Quadrigeminal cistern.
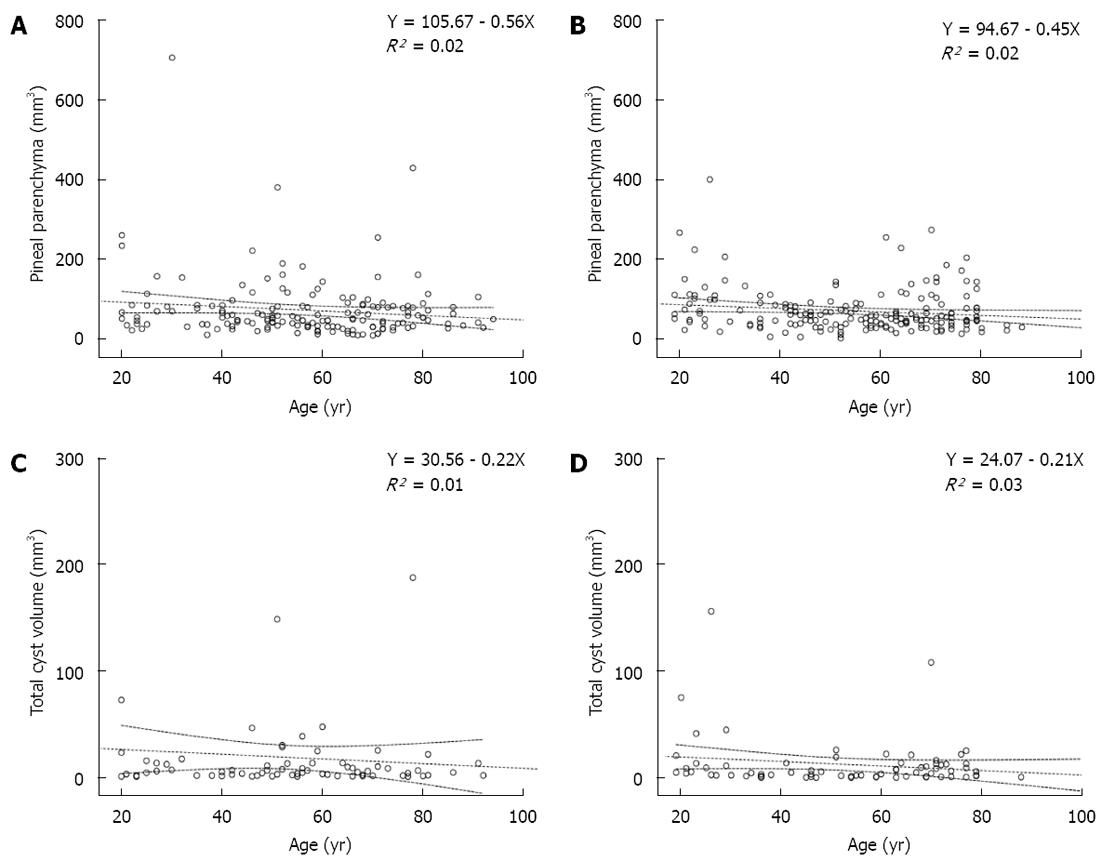
Figure 2 Regression diagram of pineal parenchyma and age.
A, B: In both females (A) and males (B), the mean pineal parenchyma volume decreased slightly with age; C, D: In both females (C) and males (D), the total cystic volume of the pineal gland decreased slightly with age. Dotted line: Linear regression and 95% mean prediction interval.
- Citation: Bumb JM, Brockmann MA, Groden C, Nolte I. Microstructural analysis of pineal volume using trueFISP imaging. World J Radiol 2013; 5(4): 166-172
- URL: https://www.wjgnet.com/1949-8470/full/v5/i4/166.htm
- DOI: https://dx.doi.org/10.4329/wjr.v5.i4.166


