Copyright
©2013 Baishideng.
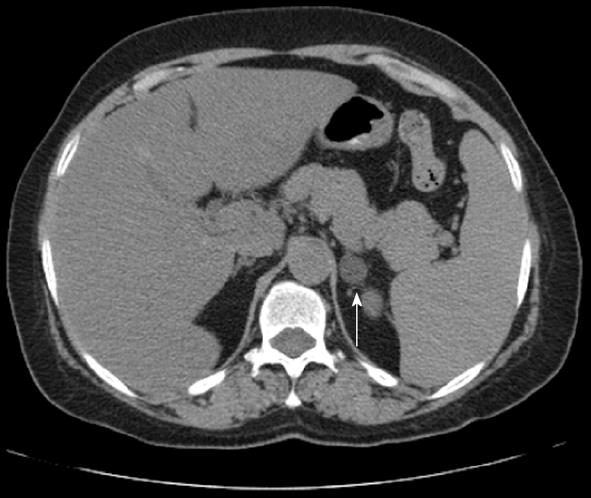
Figure 1 Axial non-contrast computed tomography demonstrates a left adrenal classic lipid-rich adenoma (arrow) with Hounsfield Units of -1.
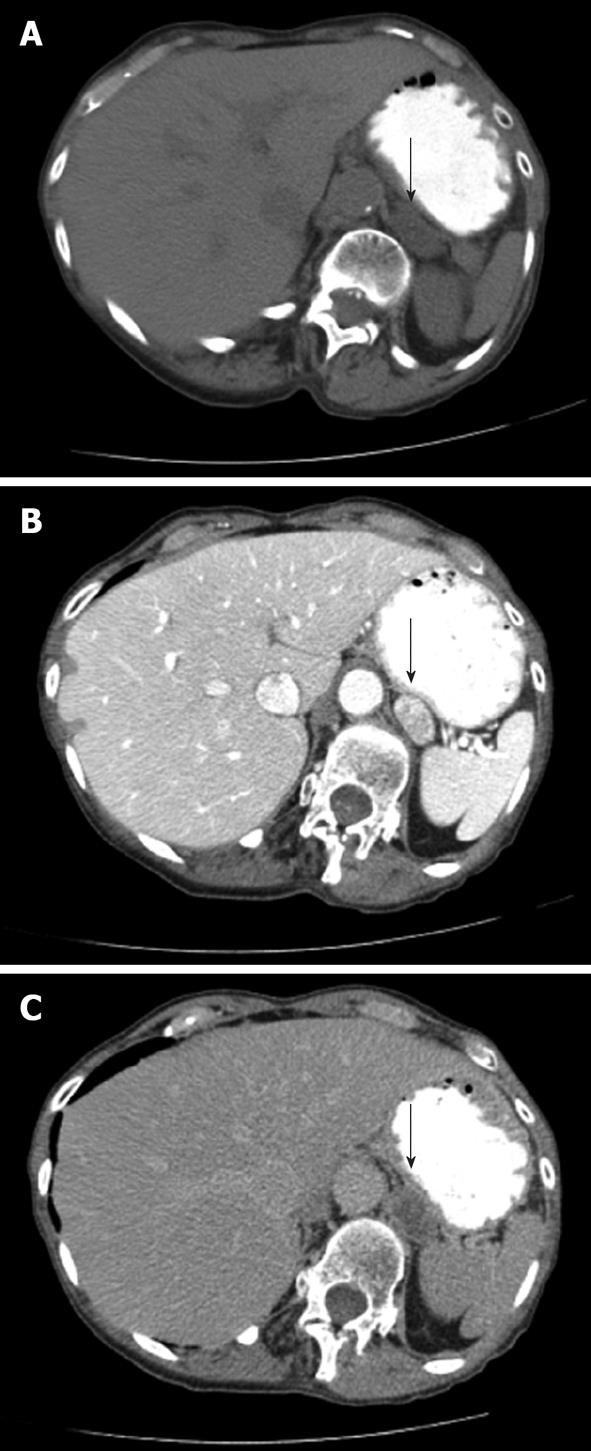
Figure 2 A patient presents with an indeterminate left adrenal nodule (arrows) on computed tomography.
Non-contrast (A), arterial phase (B) and 15 min delayed (C) images of through the left adrenal gland demonstrate Hounsfield Units values of 19, 164 and 48, respectively. Absolute contrast enhancement wash-out (ACEW) percentage and the relative contrast enhancement wash-out (RCEW) percentage were calculated. The ACEW was [(164 - 48)/(164 - 19)] × 100 = 80%, which is greater than 60% and consistent with an adenoma. The RCEW was [(164 - 48)/164] × 100 = 70.7%, which is greater than 40% and also consistent with an adenoma.
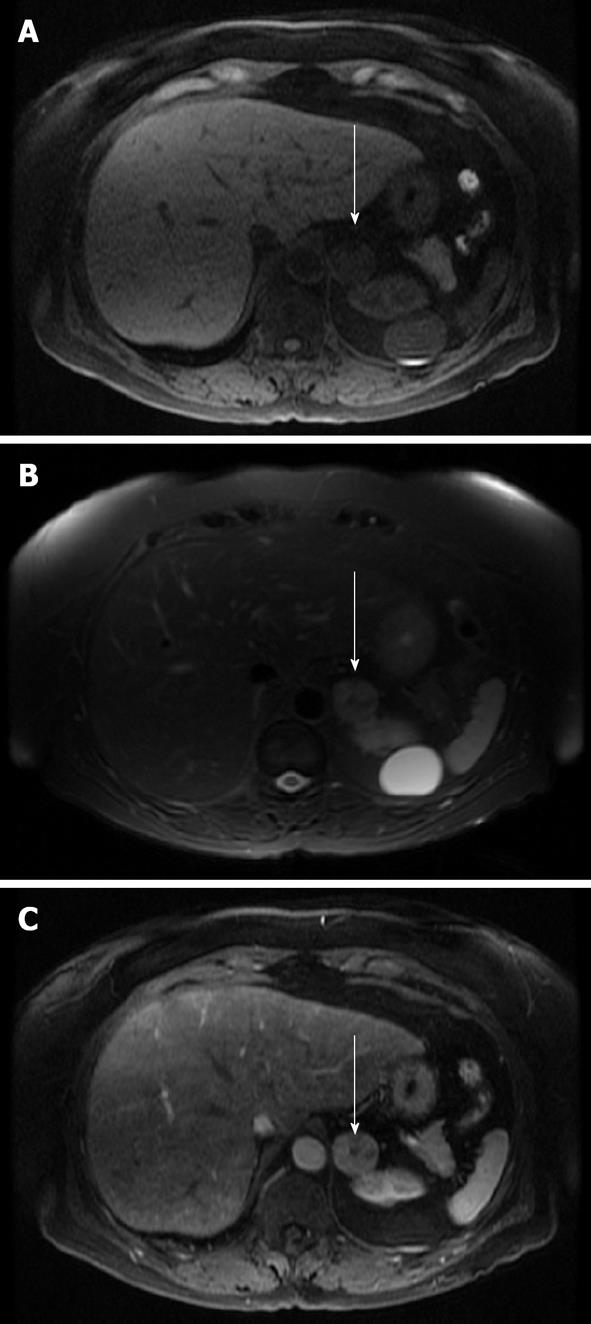
Figure 3 Magnetic resonance imaging axial images of a left adrenal adenoma (arrows).
A: T1 non-contrast image which demonstrates low T1 signal; B: A T2 image which demonstrates intermediate high T2 signal; C: A post-contrast image which demonstrates heterogeneous enhancement.
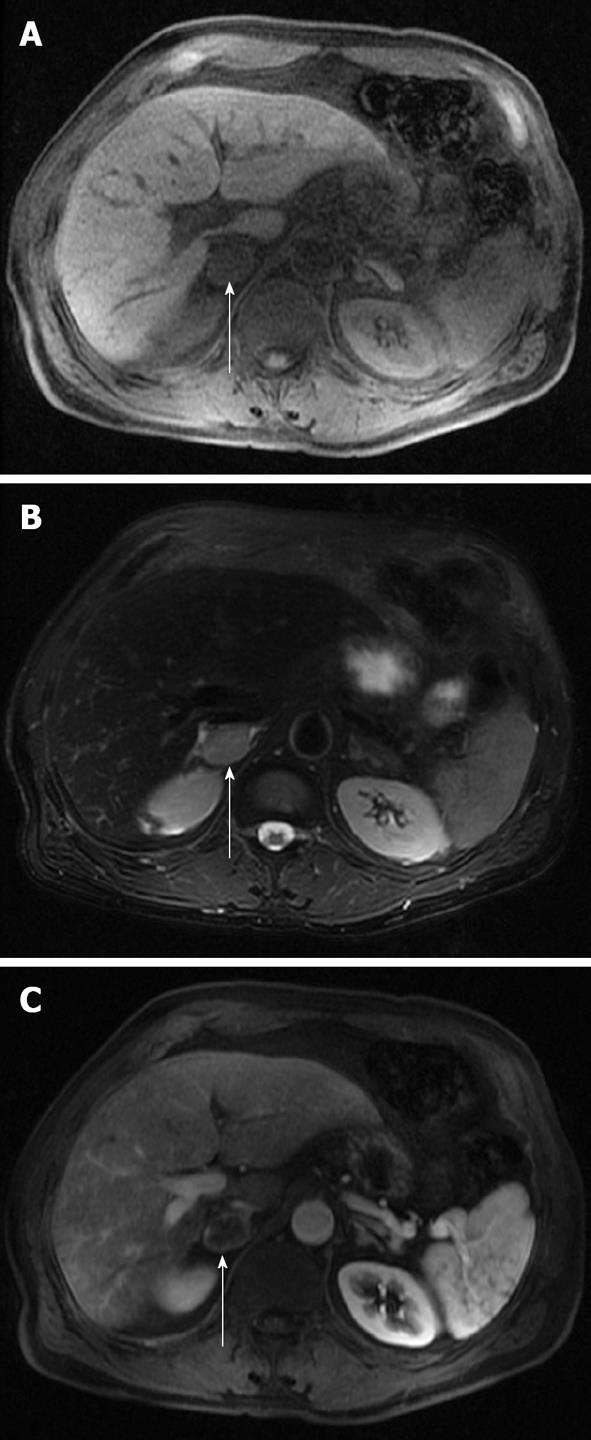
Figure 4 Magnetic resonance imaging axial images of a right adrenal metastasis (arrows) from a primary non-small cell lung cancer.
A: A non-contrast T1 image that demonstrates low T1 signal; B: A T2 image which demonstrates intermediate high T2 signal; C: A post-contrast image which demonstrates peripheral enhancement and a degree of internal signal wash-out.
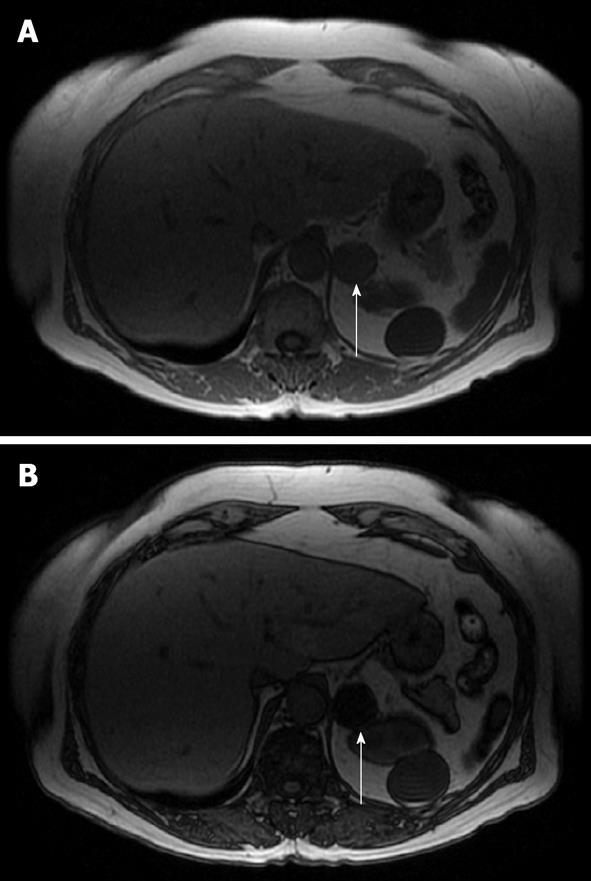
Figure 5 Magnetic resonance imaging axial in-phase (A) and out-of-phase (B) images of a left lipid-rich adenoma (arrows).
Note the near complete loss of signal on the out-of-phase image due to almost equal concentrations of fat and water in the same voxel.
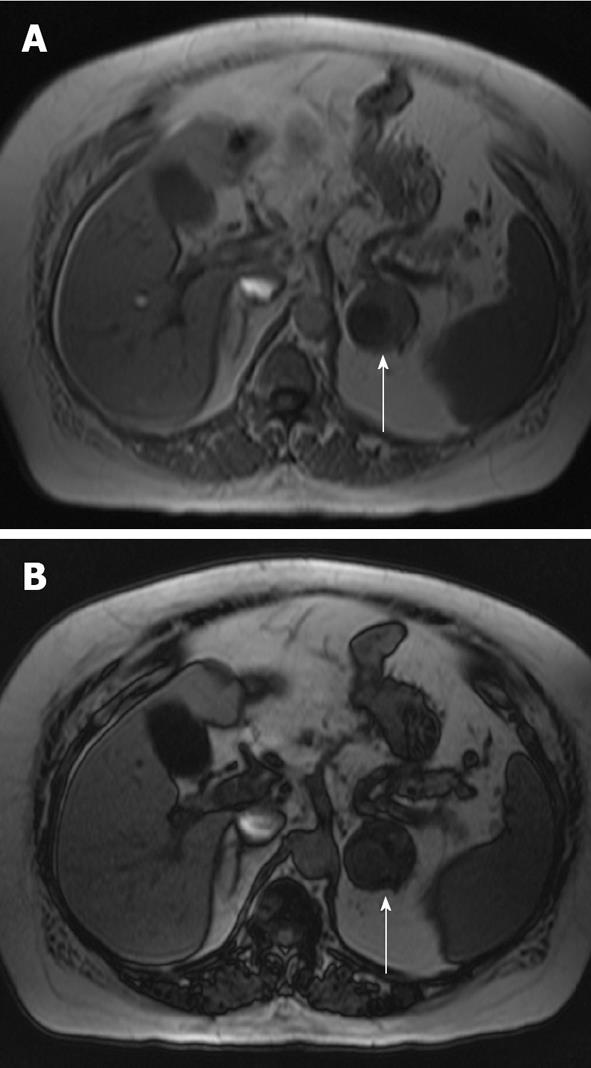
Figure 6 Magnetic resonance imaging axial in-phase (A) and out-of-phase (B) imaging of a biopsy-proven lipid poor adenoma (red arrow).
Note that the adenoma exhibits heterogeneous dropout on the out-of-phase imaging due to a low lipid-to-water proton ratio.
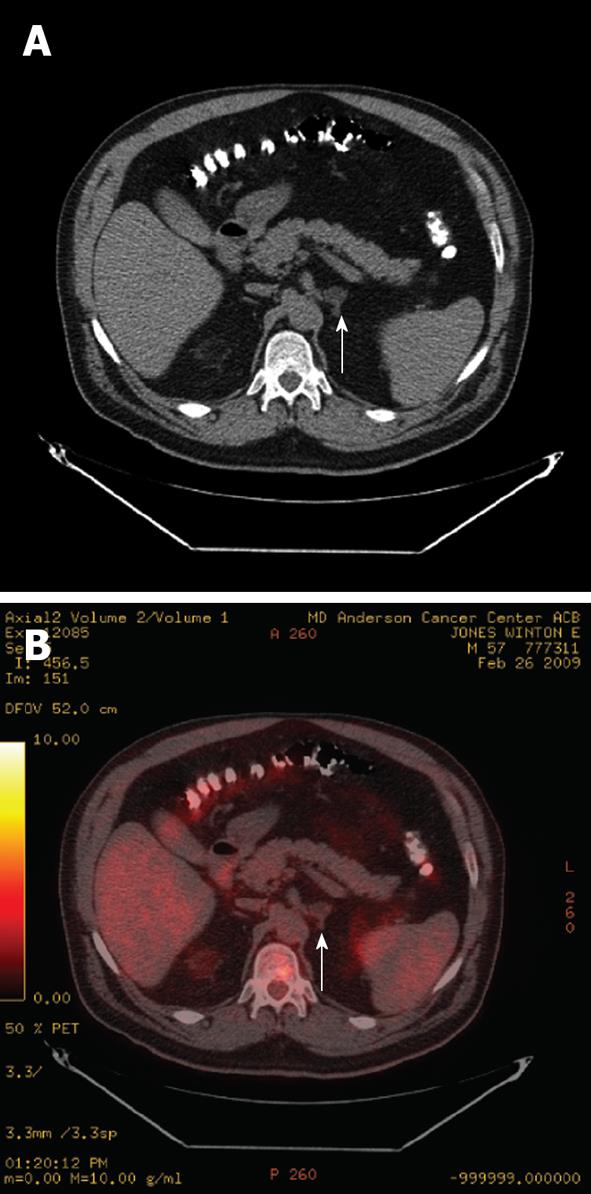
Figure 7 Axial non-contrast computed tomography image (A) and fused positron emission tomography/computed tomography image (B) of a patient with esophageal cancer with a left adrenal adenoma (arrows).
The adenoma has an Hounsfield Units of -10 on the non-contrast computed tomography (A) and demonstrates fluorodeoxyglucose uptake less than the liver (B), and is therefore not consistent with a metastasis.
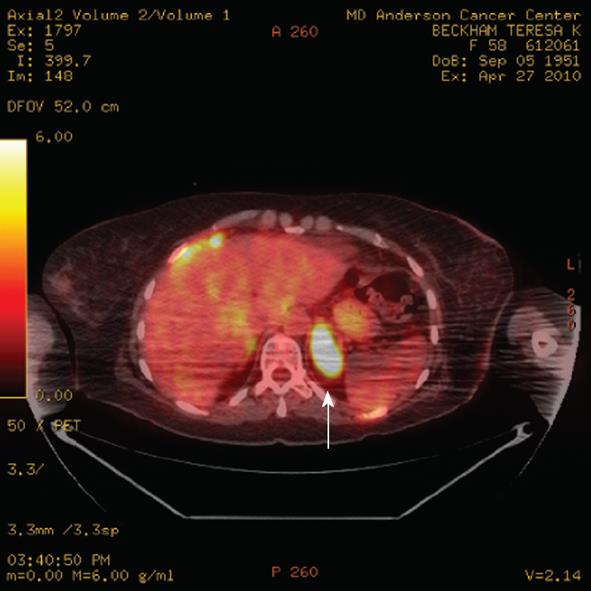
Figure 8 Axial positron emission tomography/computed tomography demonstrates a left adrenal 4.
5 cm metastasis (arrow) from breast cancer. The standardized uptake values of the metastasis was 11.9. Note the incidental streaking artifact.
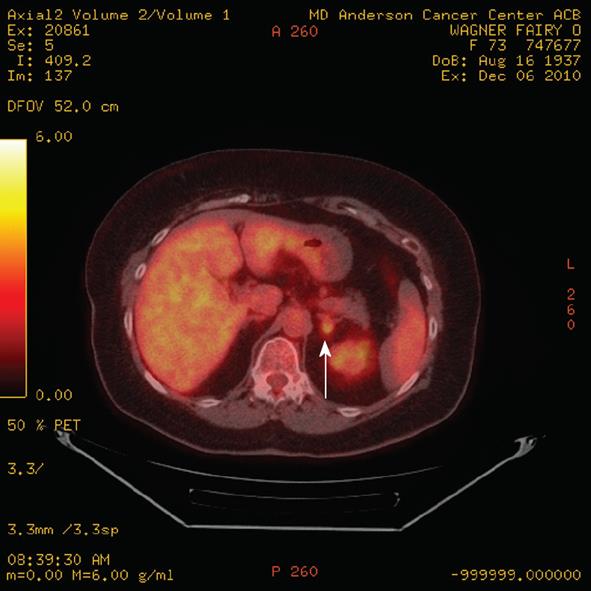
Figure 9 A positron emission tomography/computed tomography fused axial image demonstrates a left adrenal mass (arrow) with increased fluorodeoxyglucose activity slightly greater than the liver in a patient with non small cell lung cancer.
Biopsy revealed an adenoma, rendering this a false positive finding.
- Citation: Korivi BR, Elsayes KM. Cross-sectional imaging work-up of adrenal masses. World J Radiol 2013; 5(3): 88-97
- URL: https://www.wjgnet.com/1949-8470/full/v5/i3/88.htm
- DOI: https://dx.doi.org/10.4329/wjr.v5.i3.88


