Copyright
©2013 Baishideng.
World J Radiol. Mar 28, 2013; 5(3): 113-125
Published online Mar 28, 2013. doi: 10.4329/wjr.v5.i3.113
Published online Mar 28, 2013. doi: 10.4329/wjr.v5.i3.113
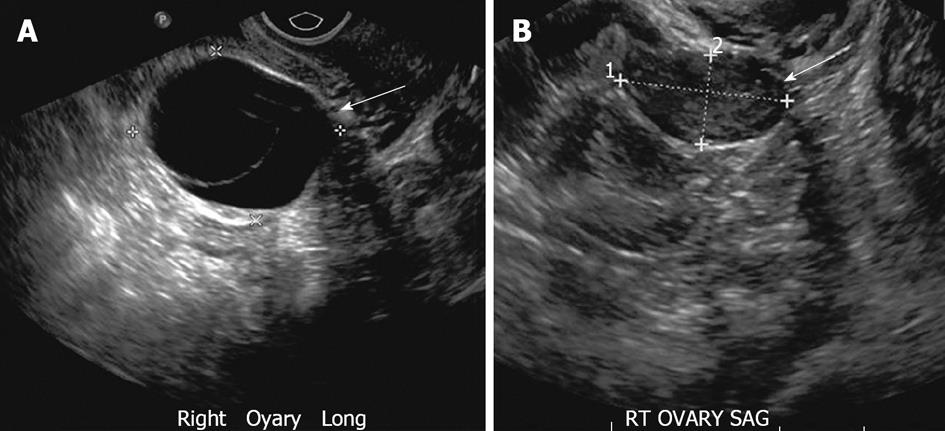
Figure 2 Functional ovarian cyst.
A 26-year-old woman with right adnexal pain. A: Transvaginal ultrasonography (TVUS) demonstrates two adjacent well defined thin walled cystic lesions (arrow) in the right ovary with no internal echoes or debris; B: TVUS (for some pelvic discomfort) in a 3 mo interval shows complete interval resolution of the right ovarian cysts, suggesting functional cysts.
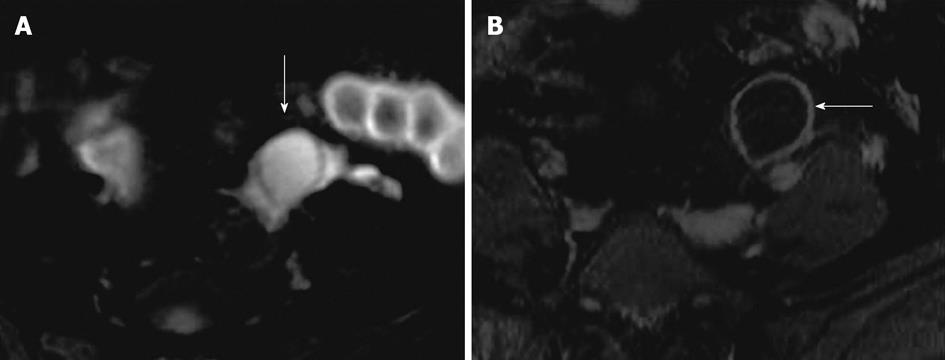
Figure 3 Functional cyst on magnetic resonance imaging.
A 31-year-old woman with magnetic resonance abdomen pelvis performed for inflammatory bowel disease evaluation. A: Axial fat suppressed T2 weighted image with fat saturation demonstrates high signal intensity focus in the left ovary (arrow), without any internal debris or septation; B: Axial post contrast fat suppressed T1 weighted image showing thin enhancing wall of the cyst without internal enhancement or septation (arrow).
Figure 4 Hemorrhagic cyst.
A 33-year-old woman for evaluation of adenomyosis. (A) Axial T1 weighted image demonstrates a high signal intensity of the lesion in the right ovary (arrow), which remains hyperintense on fat suppressed T2 weighted image (B) without internal debris or septations. The lesion remains hyperintense with no significant enhancement on post contrast fat suppressed T1 weighted images. Ut: Uterus.
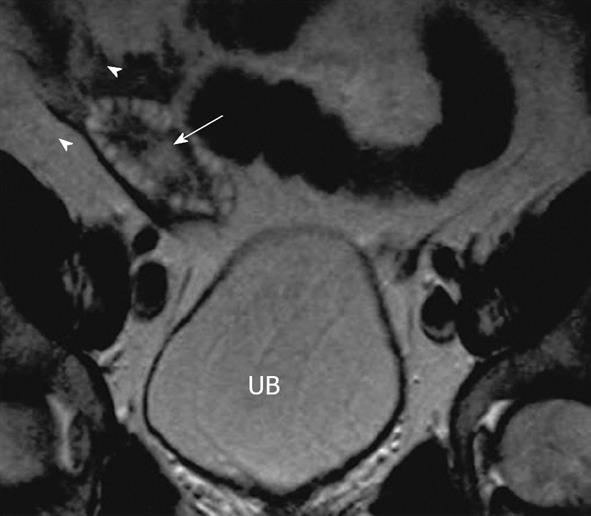
Figure 5 Polycystic ovaries.
A 25-year-old woman with obesity, infertility and altered LH/FSH ratio. Coronal T2 weighted image through the pelvis demonstrates mildly enlarged right ovary with several small symmetric peripherally arranged hyperintense cysts (arrowheads) with relatively hypointense central stroma (arrow). UB: Urinary bladder. Similar appearance of left ovary was noted.
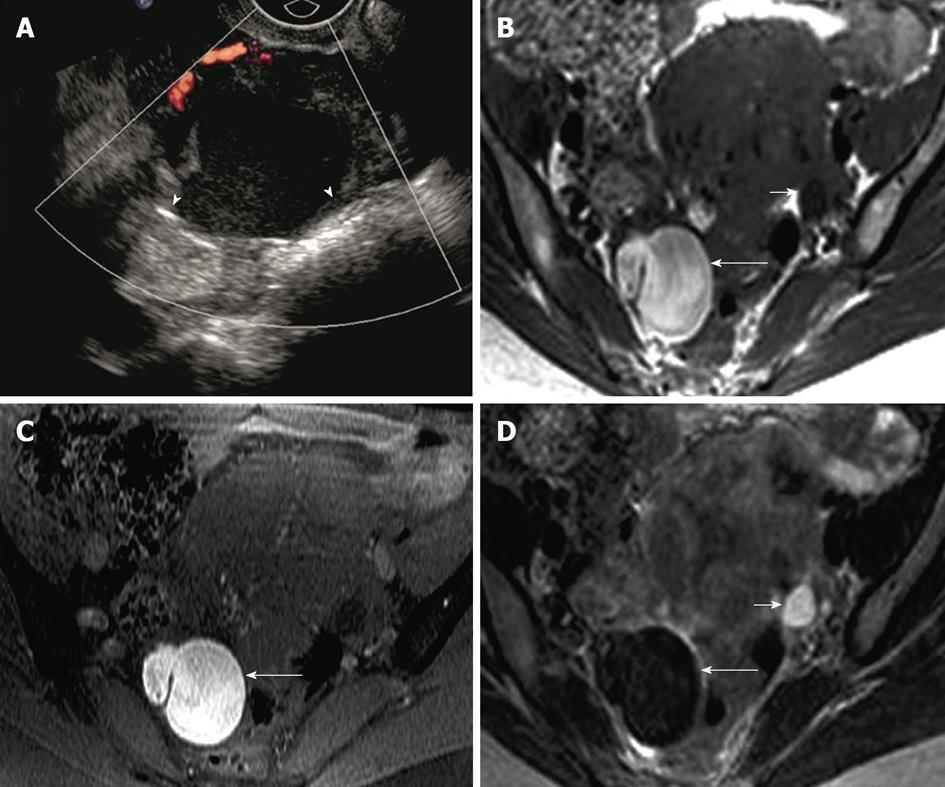
Figure 6 Endometrioma.
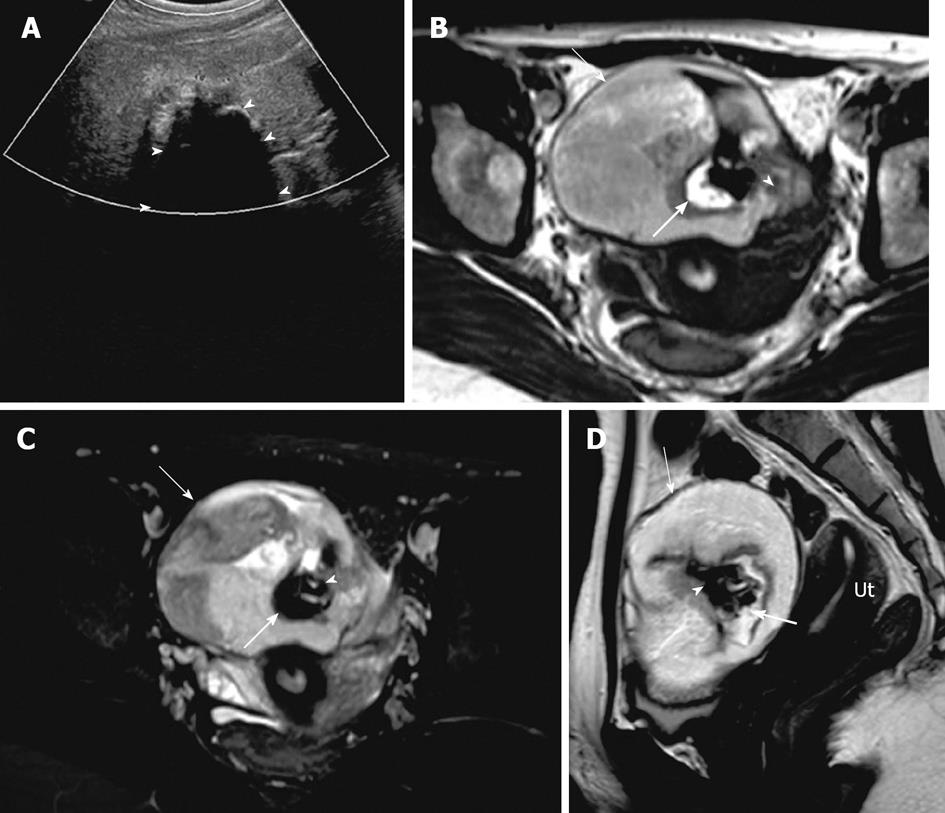
A 39-year-old woman with right adnexal pain and mass of per vaginum examination. A: Transvaginal ultrasonography showing a complex lesion in the right ovary with mildly thickened wall and uniform internal echoes (arrowheads), without intralesional vascularity; B-D: Axial fat suppressed T1 weighted image without fat saturation (B) and with fat saturation (C) demonstrate hyperintense lesion in the right ovary (long arrow) which is relatively hypointense on T2 weighted image - “T2 shading” (D). Normal left ovary with follicle (short arrow).
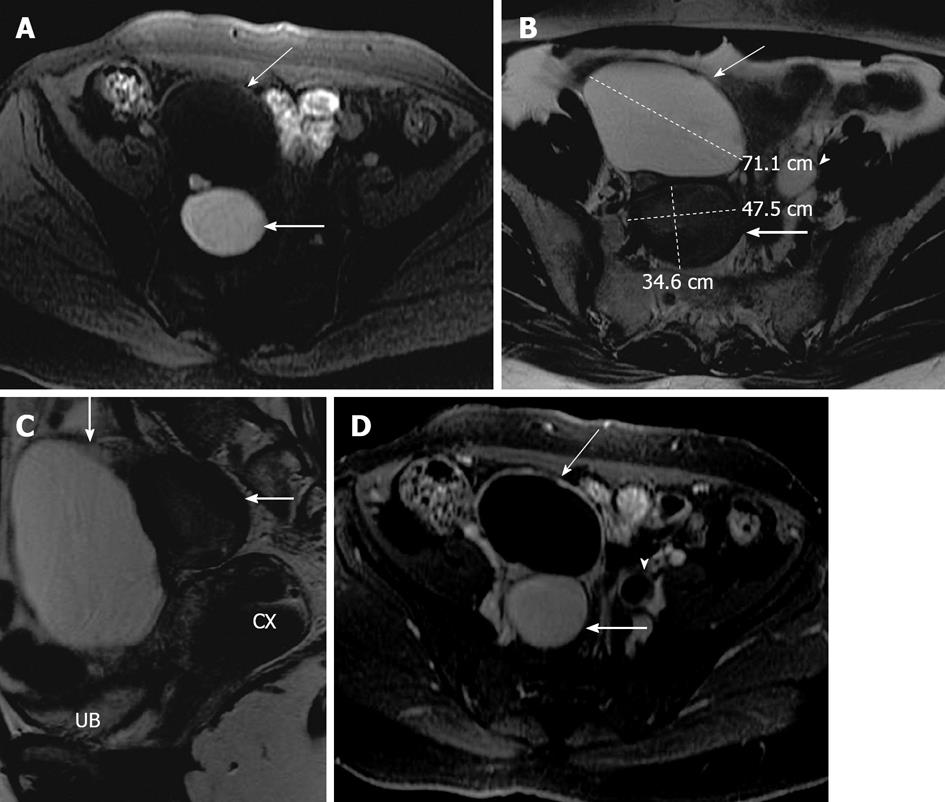
Figure 7 Ovarian serous cystadenoma and endometrioma.
A 41-year-old woman with pelvic mass. Axial fat suppressed T1 weighted image (A), axial and sagittal T2 weighted images (B and C) and axial post contrast T1 weighted image (D) showing a right adnexal lesion posteriorly (thick arrow), which has a high signal intensity on T1 weighted image, low signal intensity on T2 weighted image (T2 shading), without any internal debris or septation. Another 7.2 cm lesion in the right adnexa anteriorly (thin arrow) demonstrating low signal intensity on T1 weighted image, high signal intensity on T2 weighted image without internal septations or solid component. Both lesions demonstrate no post contrast enhancement. Left ovary with follicles also noted (arrowhead). On surgery and histopathology, two cystic lesions were seen arising from the right ovary, the posterior lesion was endometrioma and the anterior lesion was serous cystadenoma. UB: Urinary bladder; CX: Cervix.
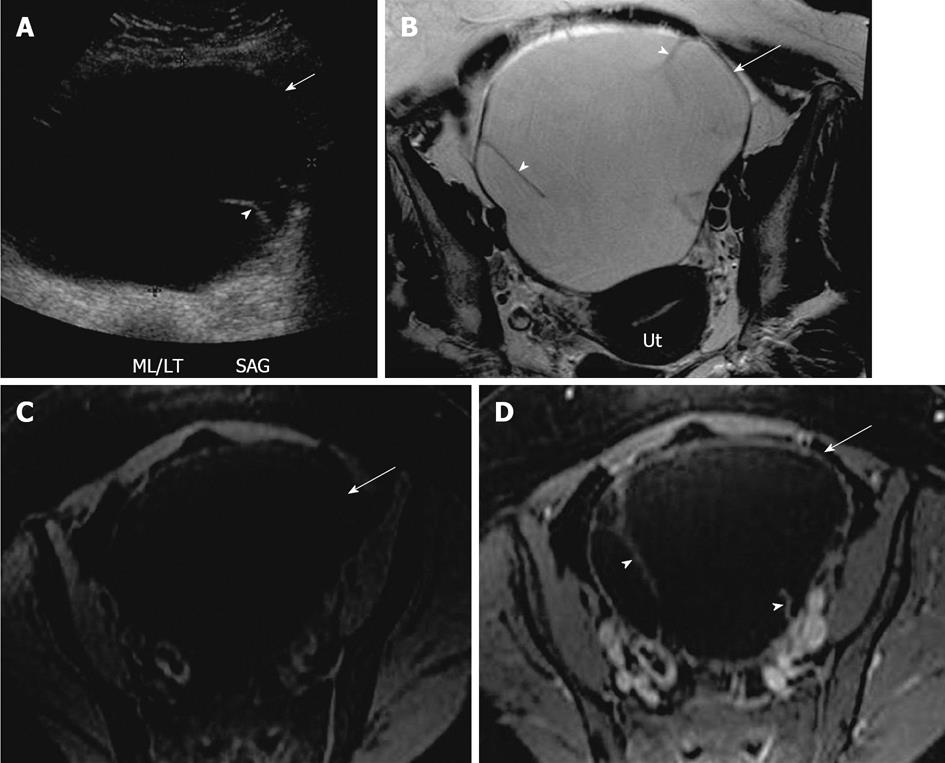
Figure 8 Mucinous cystadenoma.
A 44-year-old woman with large pelvic mass. A: Transabdominal pelvic ultrasound demonstrates a large cystic lesion (arrow) in the mid pelvis with a thin septation (arrowhead); B-D: Axial T2 weighted image (B), axial pre contrast (C) and fat saturated post contrast T1 weighted image (D), demonstrates a large left ovarian cystic lesion (arrow) with several thin septations (arrowheads). The lesion has a low signal intensity on T1 weighted image and high signal on T2 weighted image and hypointense septae, with no significant post contrast enhancement. Ut: Uterus.
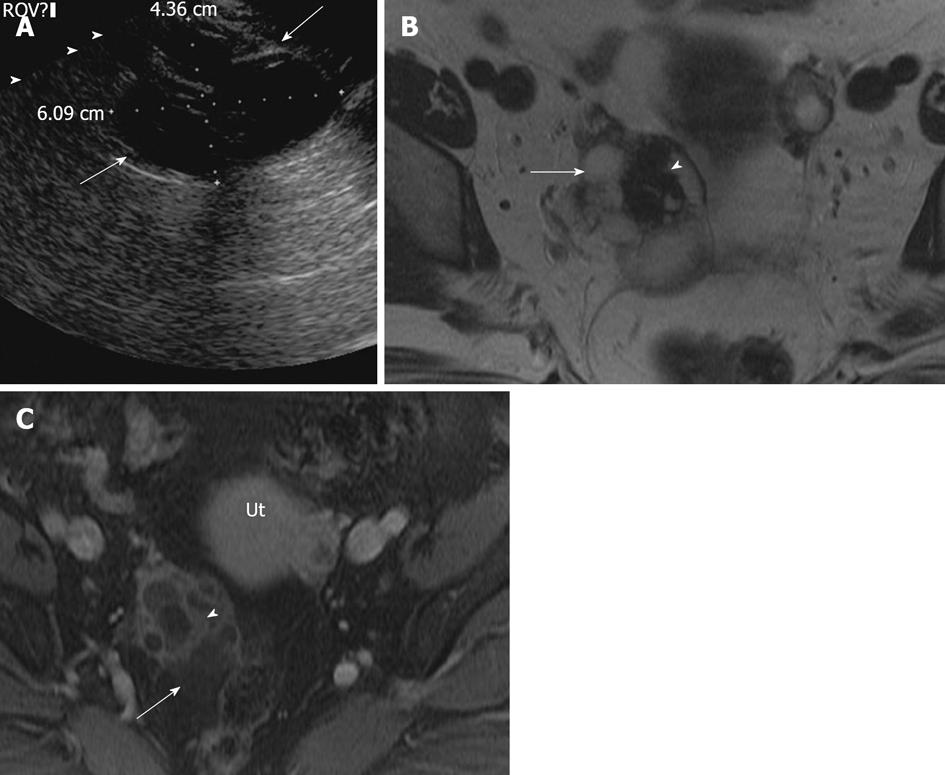
Figure 9 Ovarian cystadenofibroma.
A 35-year-old women with adnexal fullness and dysuria. (A) Transvaginal ultrasonography demonstrates a complex cystic mass in the right ovary with thick septations (arrow). Axial T2 weighted image (B), axial post contrast T1 weighted images (C) through the pelvis, shows the right ovarian complex cystic mass. The cystic component (arrow) is of high signal intensity on T2 weighted image without post contrast enhancement. The solid components demonstrate very low signal intensity on T2 weighted image (arrowhead) with mild post contrast enhancement, relative to uterus (Ut). On surgery, pathologically confirmed benign cystadenofibroma.
Figure 10 Mature cystic teratoma.
A 51-year-old woman with pelvic mass and constipation. (A) Transvaginal ultrasonography demonstrates a complex cystic mass in the right ovary with septations and solid component, causing posterior acoustic shadowing (arrowhead) suggesting calcification. Axial precontrast T1 weighted image of the pelvis without fat saturation (B), post contrast T1 weighted image with fat saturation (C) and sagittal T2 weighted image though the pelvis (D) demonstrates a left ovarian complex mass with cystic component (arrow) showing mild to moderate low signal intensity on T1 weighted image and high signal intensity on T2 weighted image. Hyperintense foci on T1 weighted image with signal loss on T1 fat saturation (thick arrow) representing fat content, T1 and T2 hypointense foci representing calcific foci (arrowhead). Ut: Uterus.
Figure 11 Endometroid carcinoma.
A 30-year-old women with abdominopelvic mass. Contrast enhanced computed tomography (A) shows a large complex cystic mass (arrow) demonstrating thick irregular enhancing septae and solid components (arrowheads). A 22-year-old women with right pelvic pain. Axial T2 weighted (B) and post contrast fat suppressed T1 weighted images (C) showing a complex cystic mass with mildly heterogenous high signal intensity cystic component and intermediate signal intensity solid components (arrow) on T2 weighted image. The cystic component is of low signal intensity on post contrast T1 weighted images and solid components demonstrate significant enhancement. A complex lesion in the right ovary (short arrow), was found to be a dermoid cyst on surgery.
Figure 12 Clear cell carcinoma.
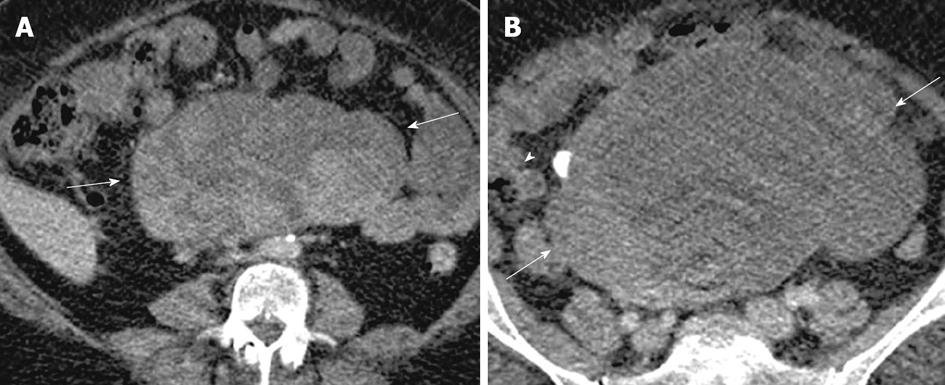
A 49-year-old woman with abdominopelvic mass. Contrast enhanced computed tomography images of the lower abdomen and pelvis (A and B), showing a large lobulated complex cystic mass with enhancing nodular and solid component (arrows) and also a calcific focus (arrowhead).
Figure 13 Serous cystadenocarcinoma.
A 53-year-old woman with lower pelvic discomfort, weight loss. Axial pre contrast T1 weighted image (A), axial T2 weighted image (B), axial fat suppressed post contrast T1 weighted image (C), showing a large complex right ovarian cystic lesion with septations, papillary projections and solid nodular components (arrowheads). Cystic component is low signal on pre contrast axial T1 weighted image and high signal on T2 weighted image (arrow). Septae, papillary projections and solid component are isointense on pre contrast T1 weighted and T2 weighted images with a significant post contrast enhancement.
Figure 14 Mucinous cystadenocarcinoma.
A 47-year-old woman with mobile pelvic mass. Axial T2 weighted image (A), axial pre contrast and post contrast T1 weighted images (B and C) demonstrating a right ovarian large heterogenous complex mass, which has a relatively high signal intensity on T2 weighted image (thick arrow) and low signal intensity on pre contrast T1 weighted image with a significant post contrast heterogenous enhancement. Another smaller lesion with similar characteristic is noted in the left adnexa (thin long arrow), representing bilateral surgically proven mucinous cystadenocarcinoma.
Figure 15 Ovarian metastases.
A 52-year-old woman with weight loss, loss of appetite and pelvic mass. Contrast enhanced computed tomography (CT) images of the lower abdomen and pelvis (A and B) shows a large complex cystic mass (arrow) with enhancing solid components (arrowhead), arising from the pelvis and extending superiorly into the abdomen. Contrast enhanced CT (C), demonstrates nodular thickening along the lesser curvature of the stomach (thick arrow) which was found to be gastric adenocarcinoma on biopsy. Also note metastatic deposits in the left hepatic lobe (thin arrows) with perihepatic ascites and omental nodularity (double arrow).
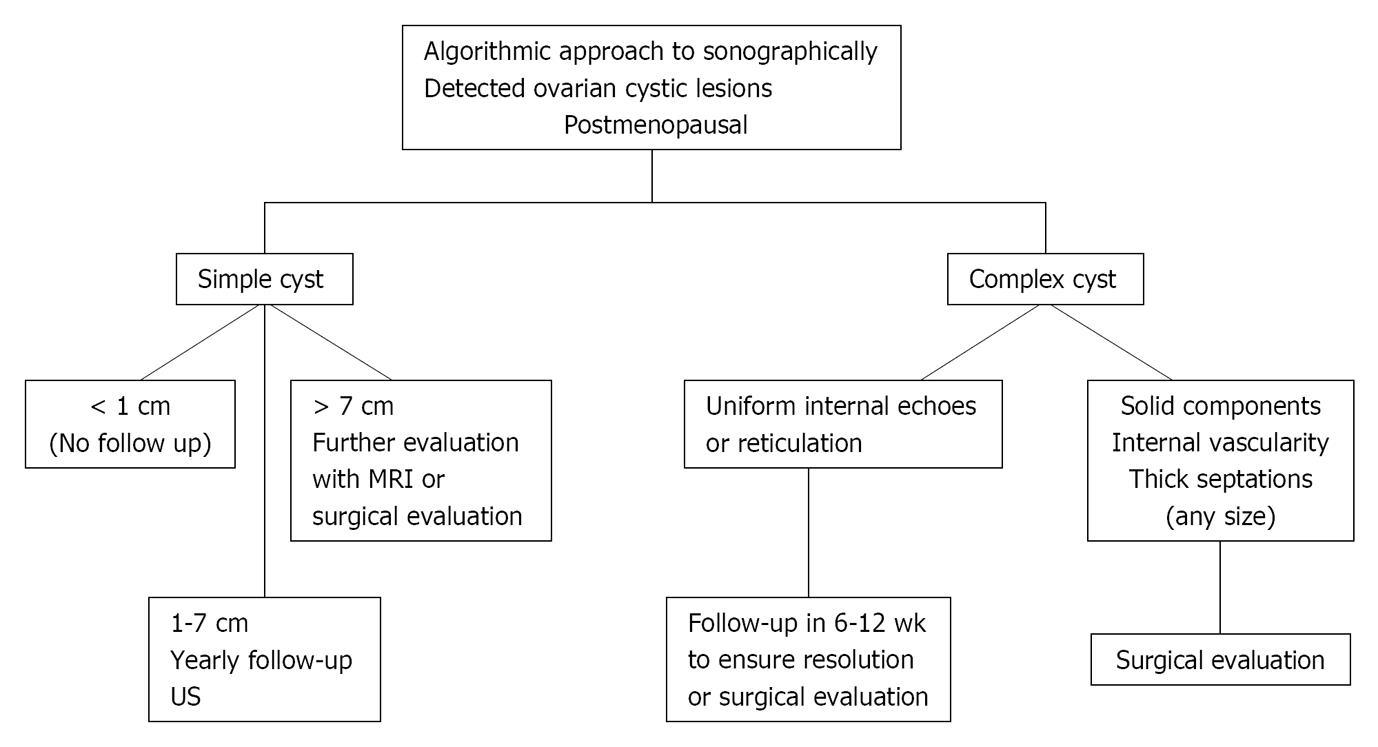
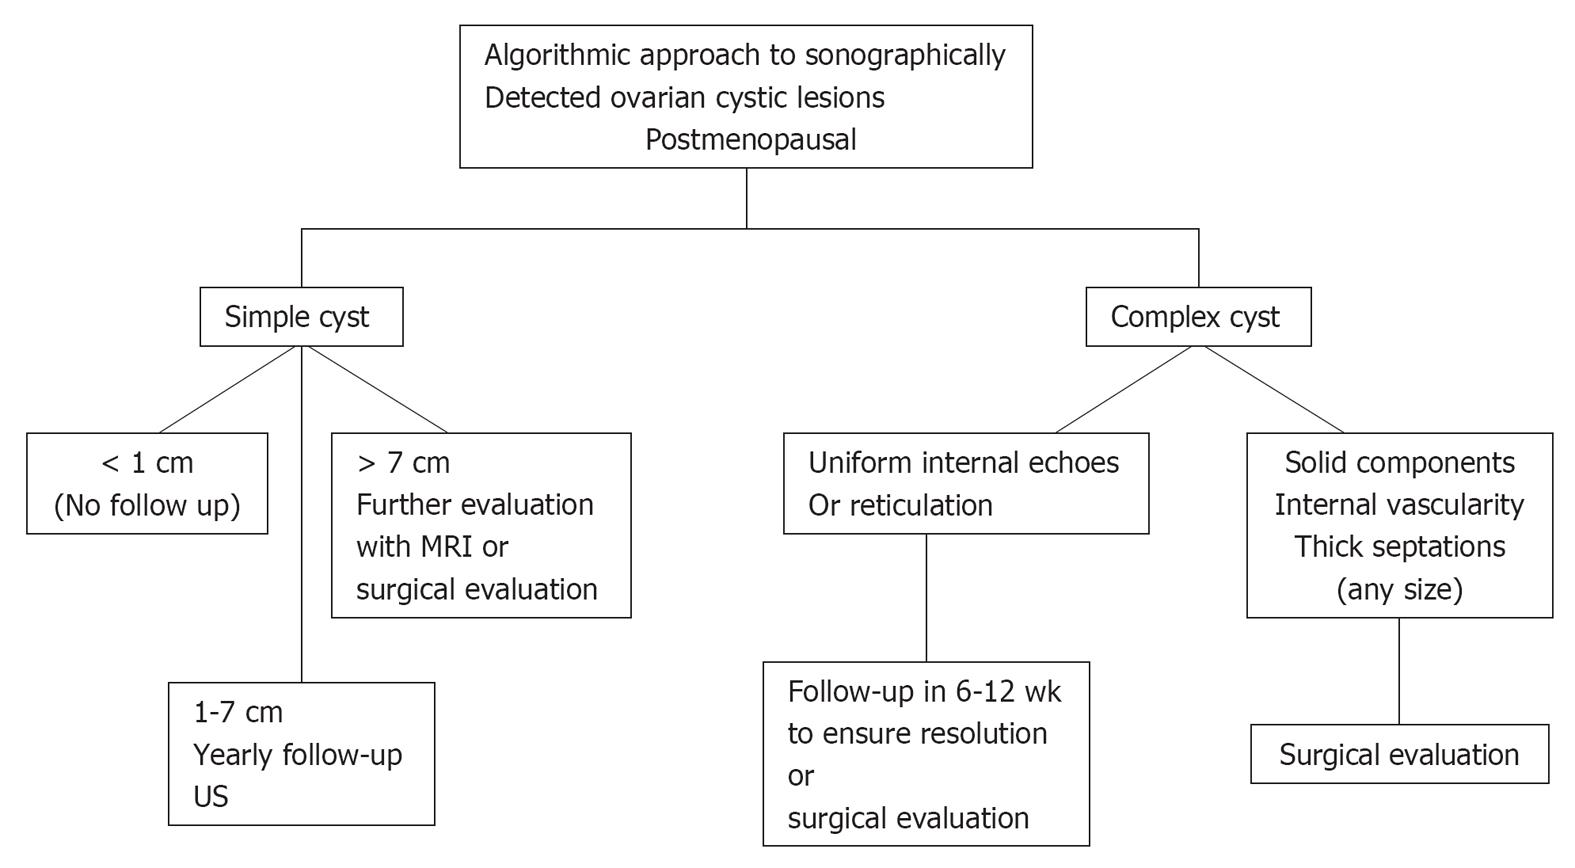
Figure 16 Imaging based algorithmic approach to cystic ovarian lesions: premenopausal age group.
US: Ultrasonography; MRI: Magnetic resonance imaging; CT: Computed tomography. Adapted from[26].
- Citation: Wasnik AP, Menias CO, Platt JF, Lalchandani UR, Bedi DG, Elsayes KM. Multimodality imaging of ovarian cystic lesions: Review with an imaging based algorithmic approach. World J Radiol 2013; 5(3): 113-125
- URL: https://www.wjgnet.com/1949-8470/full/v5/i3/113.htm
- DOI: https://dx.doi.org/10.4329/wjr.v5.i3.113


