Copyright
©2013 Baishideng Publishing Group Co.
World J Radiol. Dec 28, 2013; 5(12): 472-483
Published online Dec 28, 2013. doi: 10.4329/wjr.v5.i12.472
Published online Dec 28, 2013. doi: 10.4329/wjr.v5.i12.472
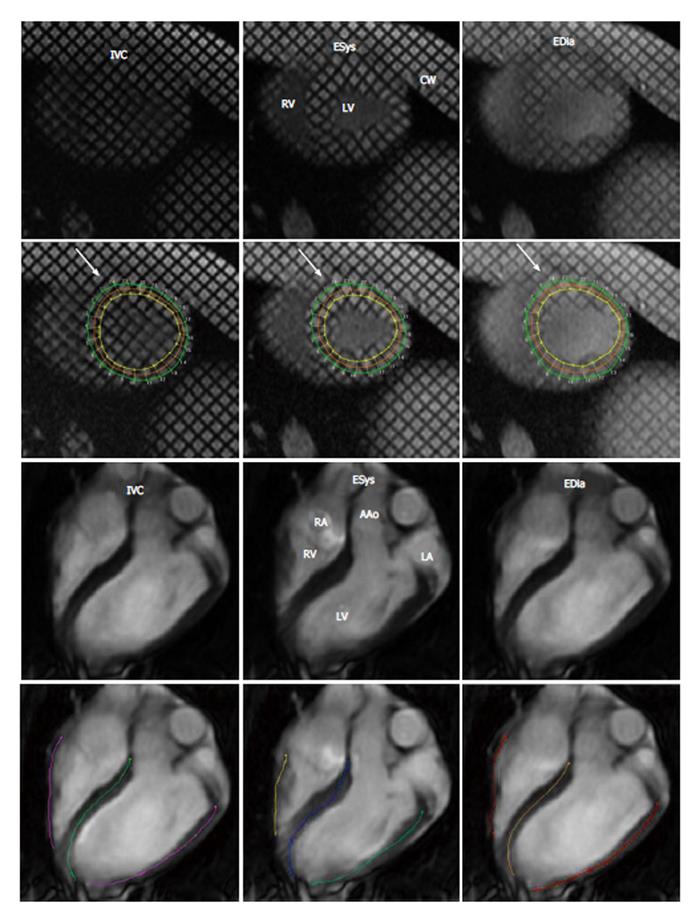
Figure 1 Representative tagged and cine magnetic resonance images with tracing method.
Top row demonstrates short-axis and long-axis magnetic resonance images (MRI) images, while bottom row demonstrates images after tracing of the myocardium using HARP. Left three columns are cine tagged MRI and right three columns are cine MRI. IVC: Isovolumetric contraction; ESys: End systole; EDia: End diastole; LV: Left ventricle; RV: Right ventricle; CW: Chest wall; RA: Right atrium; LA: Left atrium; AAo: Ascending aorta.
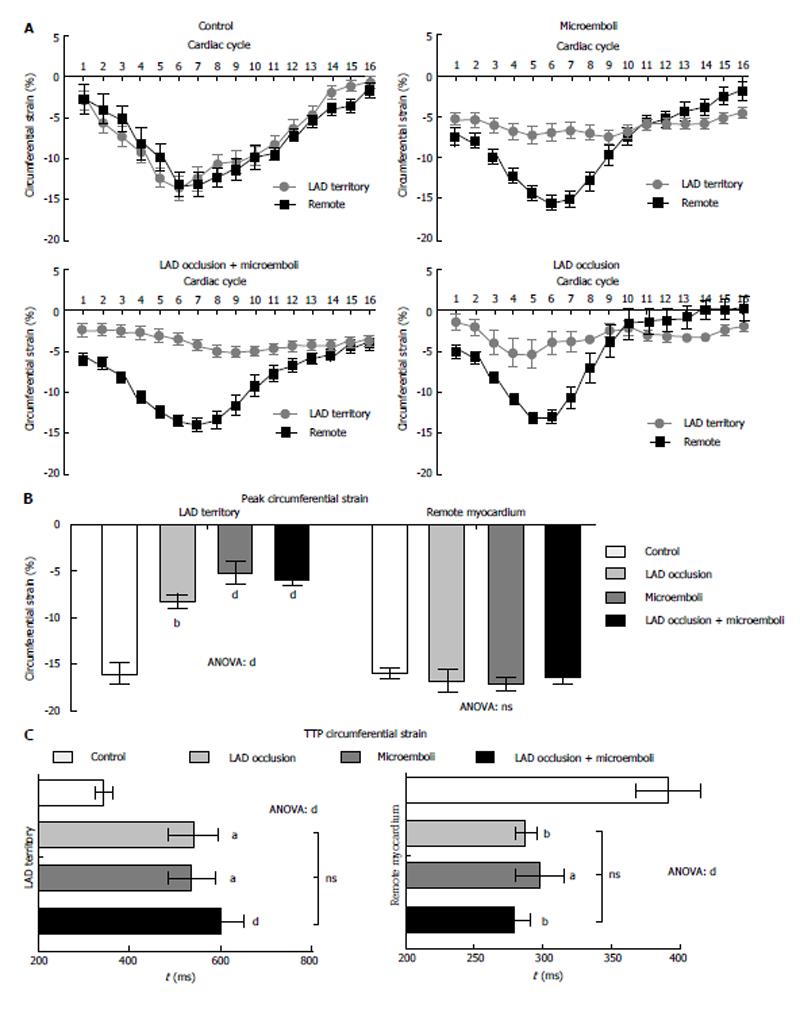
Figure 2 Circumferential strain analysis: phasic, peak, and territory time to peak strain.
A: Phasic circumferential strain peak and rate during one R-R interval in LAD territory and remote myocardium of the 4 groups. Data are presented as means ± SEM. A significantly decreased peak circumferential strain was observed in the LAD territory compared with remote myocardium in all coronary interventions (P < 0.001); B: Bars show average peak circumferential strain. ANOVA showed significant decrease in strain of the LAD territory 3 d after interventions compared with controls. Remote myocardium showed no significant difference between interventions and control; C: shows significant variation in time to peak circumferential strain between remote and the LAD territory time to peak strain (TTPS). Remote myocardium showed decreased TTPS for all interventions, while the LAD territory demonstrated increased TTPS. Control vs LAD, aP < 0.05; Control vs Microemboli, bP < 0.01; Control vs ANOVA dP < 0.001. LAD: Location aid device.
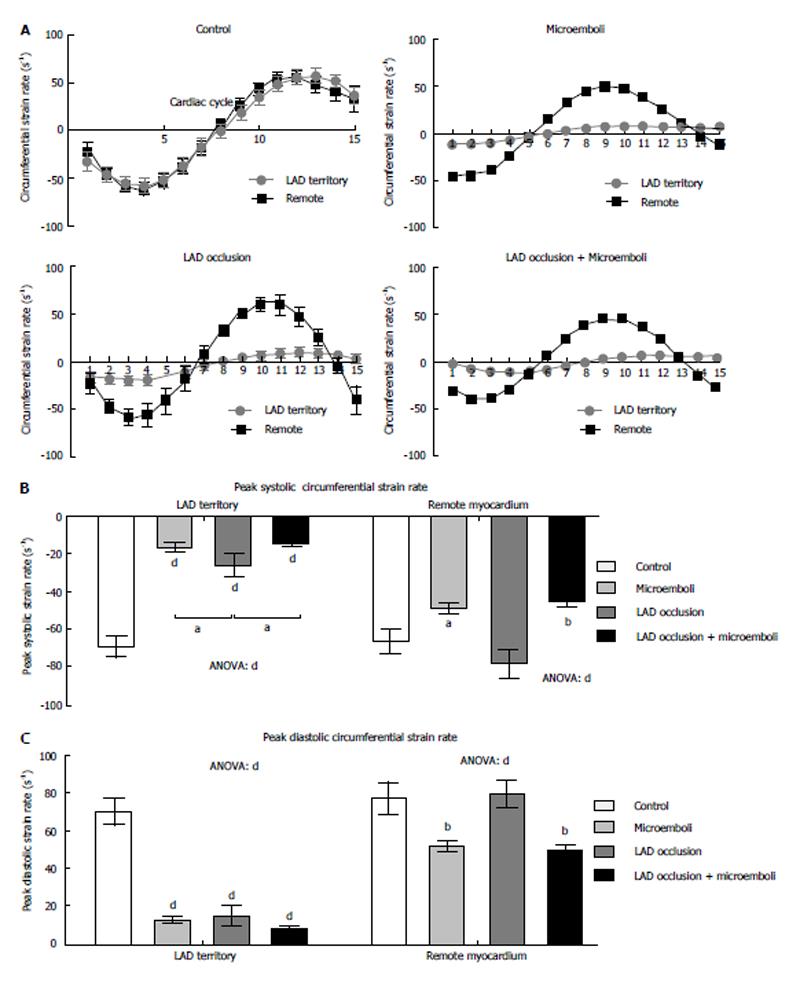
Figure 3 Circumferential strain rate analysis: phasic, peak, and territory time to peak systolic and diastolic strain rate.
A: Circumferential strain rate curves. Data are presented as means ± SEM. In control animals, remote myocardium and location aid device (LAD) territory have identical curves, while remote vs LAD territory in all interventions were significantly different (P < 0.001); B: The LAD territory showed significantly decreased systolic strain rate in LAD territory for all interventions, with microembolized and combined groups significantly less than solely LAD occlusion. Remote myocardium showed only a decrease in microembolized and combined groups; C: The LAD territory demonstrated significantly decreased diastolic strain rate in LAD territory for all interventions. Remote myocardium again showed only significant decrease in microembolized and combined groups. Control vs LAD, aP < 0.05; Control vs Microemboli, bP < 0.01; Control vs ANOVA dP < 0.001.
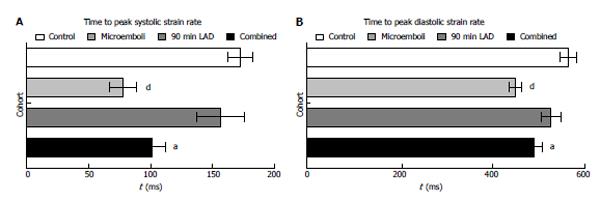
Figure 4 Time to peak systolic and diastolic strain rate in remote myocardium.
Remote myocardium peak systolic (left) and diastolic strain rate (right) in controls and animals subjected to interventions. Only animals subjected to microembolization or combined ischemic insults showed significantly earlier systolic and diastolic strain rates. Data are presented as means ± SEM. Control vs Combined, aP < 0.05; Control vs Microemboli, dP < 0.001. LAD: Location aid device.
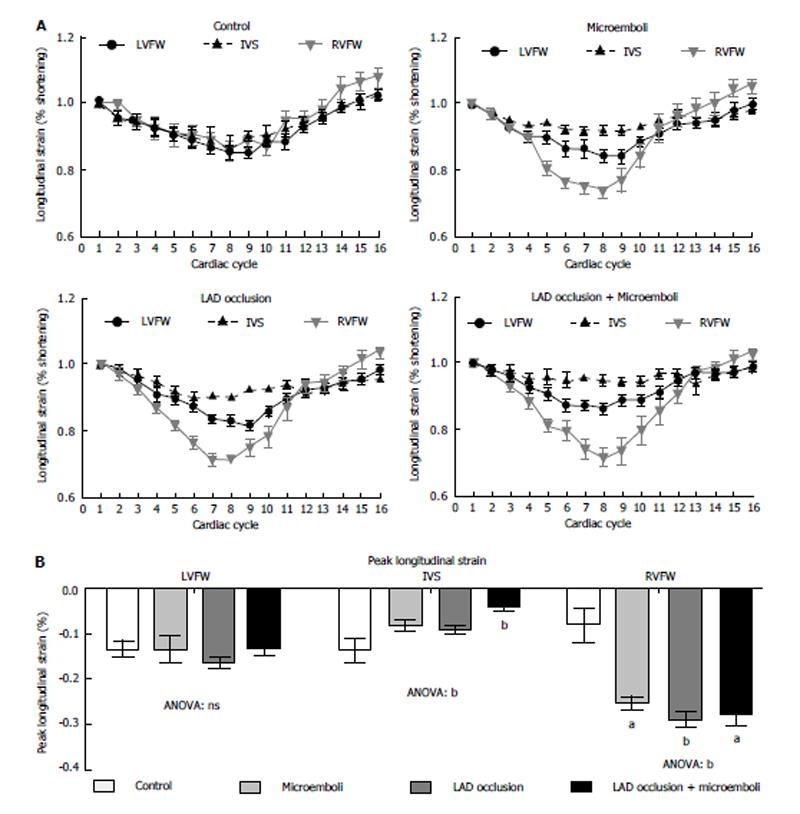
Figure 5 Longitudinal strain analysis: phasic and peak.
A: Phasic longitudinal strain rate curves quantitatively show increased strain in right ventricular free wall (RVFW) and decreased strain in interventricular septum (IVS); B: Peak longitudinal strain. All interventions showed compensatory increase in peak strain in RVFW, while significantly decreased longitudinal peak strain was only seen in the IVS of combined insult animals. Data are presented as means ± SEM. Control vs Microemboli, aP < 0.05; Control vs LAD Occlusion, bP < 0.01. LAD: Location aid device; LVFW: Left ventricular free wall.
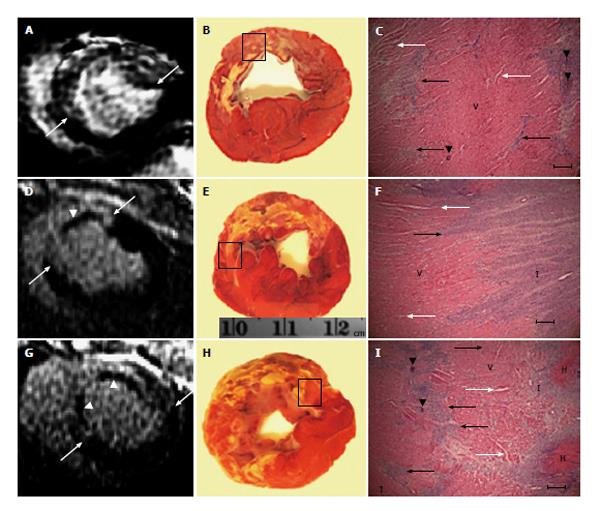
Figure 6 Viability contrast enhanced magnetic resonance images postmortem histochemical triphenyltetrazolium chloride stain and microscopy in animals subjected to soley microinfarction (top), soley location aid device occlusion/reperfusion (middle) and combined location aid device occlusion/reperfusion and microembolization (bottom).
A: MR image and TTC stain show patchy microinfarct in the LAD territory; B: Postmortem histochemical TTC stain; C: Shows necrotic small islands (black arrows), interstitial edema (white arrow) and microemboli (black arrowhead); D: MR image shows the large infarct (white arrows) with hypoenhanced microvascular obstruction zone (white arrowhead); E: TTC section shows transmural infarct; F: Microinfarct tethering (black arrows) and interstial edema (white arrows) at the edge of the infarct; G: MR image shows the large infarct with patchy hyperenhanced microinfarct in the peri-infarct region (white arrows) with very large hypoenhanced microvascular obstruction zones (white arrowhead); H: TTC section shows hemorrhagic transmural infarct with patchy microinfarct in the peri-infarct region; I: Necrotic small islands (black arrows), interstitial edema (white arrow) and microemboli (black arrowhead). V: Viable myocardium, H: Hemorrhage; I: Large infarct. TTC: Triphenyltetrazolium chloride; MRI: Magnetic resonance imaging; LAD: Location aid device.
- Citation: Suhail MS, Wilson MW, Hetts SW, Saeed M. Magnetic resonance imaging characterization of circumferential and longitudinal strain under various coronary interventions in swine. World J Radiol 2013; 5(12): 472-483
- URL: https://www.wjgnet.com/1949-8470/full/v5/i12/472.htm
- DOI: https://dx.doi.org/10.4329/wjr.v5.i12.472


