Copyright
©2013 Baishideng Publishing Group Co.
World J Radiol. Dec 28, 2013; 5(12): 455-459
Published online Dec 28, 2013. doi: 10.4329/wjr.v5.i12.455
Published online Dec 28, 2013. doi: 10.4329/wjr.v5.i12.455
Figure 1 Lipoma of the tendon sheath.
A: T1-weighted MR image of the right wrist shows a lobulated high-signal-intensity mass (arrows) located between the palmar muscles; B: Fat-saturated proton-density weighted MR image shows homogeneous low signal intensity of the tumor mass (arrows), suggestive of a fat component; C: There is no enhancement of the tumor mass (arrows) after gadolinium administration on fat-saturated T1-weighted image. MR: Magnetic resonance.
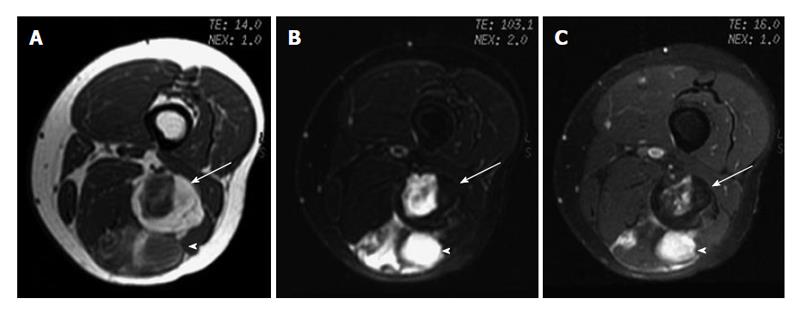
Figure 2 Myxoid liposarcoma.
A: Axial T1-weighted image; B: Fat-saturated T2-weighted MR image; C: Fat saturated gadolinium-enhanced T1-weighted images of left thigh show a lobulated fat-containing mass (arrow) with an enhancing nonadipose mass-like area (arrowhead) on the left thigh, suggestive of myxoid stroma.
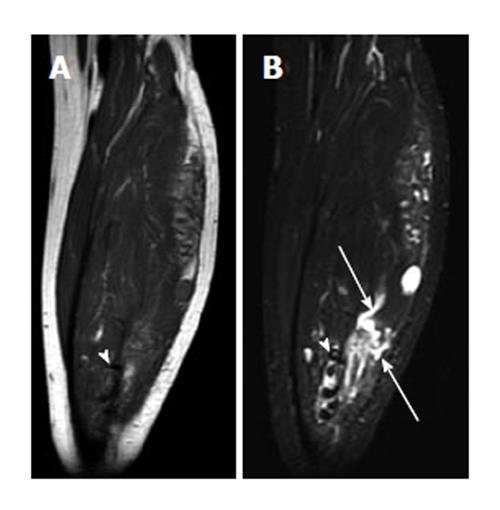
Figure 3 Cavernous hemangioma.
A: Coronal T1-weighted image; B: Fat saturated T2-weighted MR image. The left calf shows a heterogeneous serpiginous high-signal-intensity lesion (arrows) on T2-weighted image, which is caused by dilated slow-flowing vessels with methemoglobin. Some low-signal-intensity pattern (arrowhead) indicates fast-flow blood or hemosiderin or calcification. MR: Magnetic resonance.
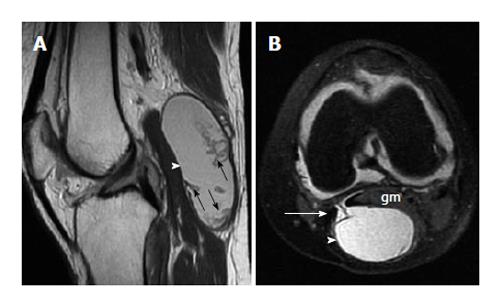
Figure 4 Baker cysts.
A: Sagittal proton-density B: Axial gradient-echo images. The left knee shows a well-defined cystic lesion (arrowhead) connected to the knee joint by way of a narrow neck between the semimembranosus tendon (arrow) and the medial head of the gastrocnemius muscle (gm). Note that the Baker cyst contains debris (small arrows in A).
Figure 5 Giant cell tumor of the tendon sheath.
A: T1-weighted image shows the tumor (arrow) on the plantar side; B: T2-weighted image shows heterogeneous low signal intensity of the tumor (arrow) due to hemosiderin deposition; C: Sagittal gadolinium-enhanced T1-weighted image with fat saturation shows obvious enhancement of the tumor mass (arrow).
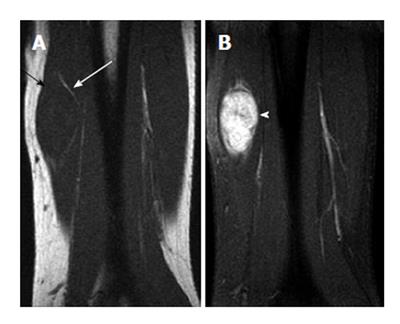
Figure 6 Neurofibroma of the left ulnar nerve (split-fat sign) in a 58-year-old man.
A: Coronal T1-weighted image of the left forearm shows a spindle-shaped mass with isointensity relative to adjacent muscle. Note the presence of the split-fat sign (arrows). Because the neurovascular bundle is normally surrounded by fat, masses arising at this site maintain a rim of fat about them as they slowly enlarge; B: Coronal T1-weighted fat-saturated gadolinium-enhanced image shows heterogeneous enhancement of the mass (arrowhead). Recognition of the spindle shape of the tumor and contiguity of the tumor and adjacent nerve may suggest the diagnosis[6].
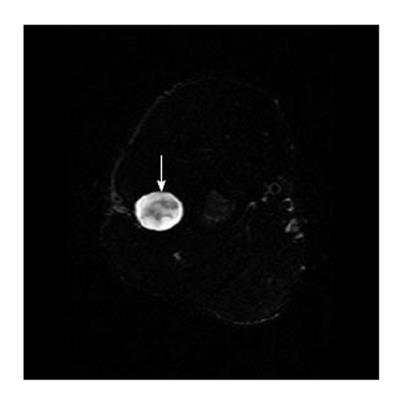
Figure 7 Neurofibroma of the right radial nerve (target sign) in a 35-year-old man.
High signal intensity of myxoid Antoni type B (arrow)[6].
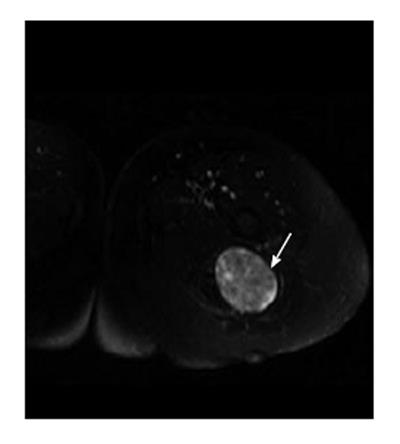
Figure 8 Neurofibroma of the left sciatic nerve (fascicular sign) in a 55-year-old woman.
A hyperintense mass (arrow) with multiple small hypointense fascicle-like structures in the mass, representing the “fascicular sign”[6].
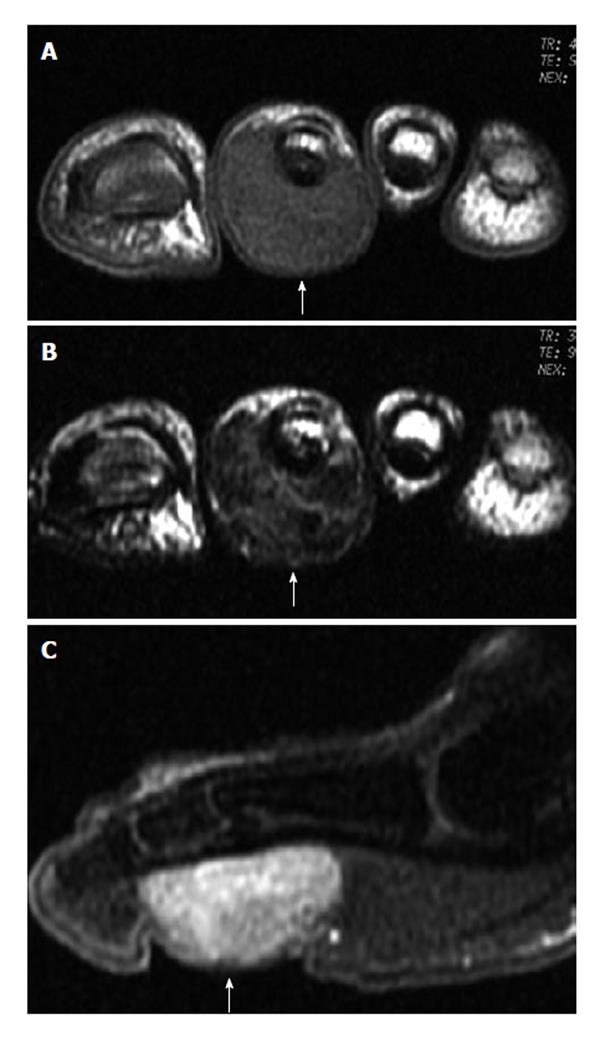
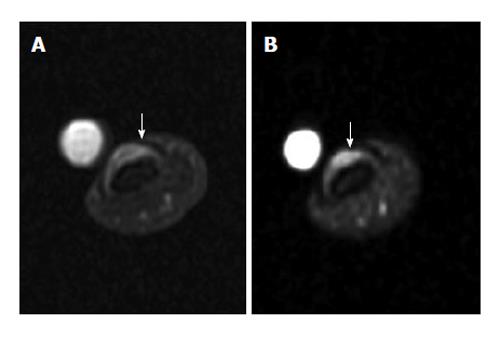
Figure 9 Subungual glomus tumor.
A: Axial proton-density-weighted MR image of the left thumb shows a small subungual tumor (arrow); B: Fat-saturated gadolinium-enhanced T1-weighted image shows obvious enhancement of the tumor (arrow). MR: Magnetic resonance.
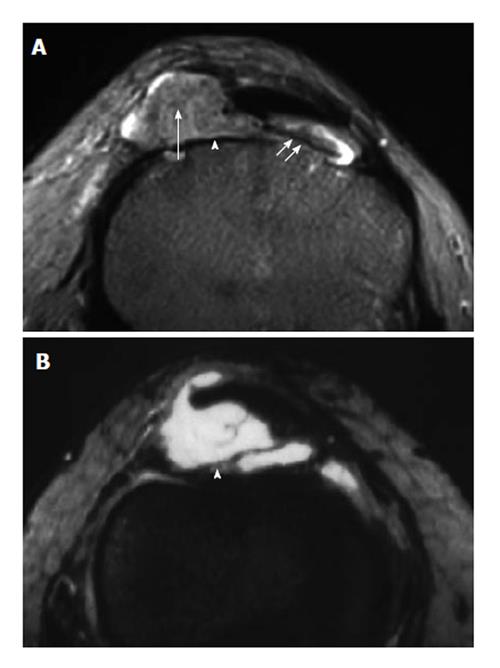
Figure 10 Localized nodular synovitis (solitary PVNS).
A: Axial T2-weighted MR image of the knee shows a nodular mass (arrowhead), with a long pedicle (double short arrows) attaching the mass to the adjacent synovium, involving the infrapatellar fat pad. Note small circular foci of low signal intensity (arrow), corresponding to deposition of hemosiderin. B: Gadolinium-enhanced T1-weighted image with fat saturation shows obvious enhancement of the lesion (arrow) caused by capillary proliferation. (Photo courtesy of Dr. Guo-Shu Huang). MR: Magnetic resonance.
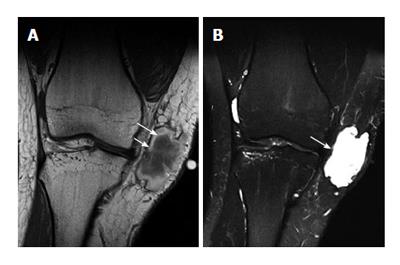
Figure 11 Early subacute hematoma.
A: Coronal T1-weighted; B: T2-weighted MR image of the knee. On T1-weighted image, there is a hyperintensity of extracellular methemoglobin at the periphery (long arrow) of the hematoma (which is seen 2-7 d after injury). Note a very thin low-signal-intensity rim at the outermost layer of the hematoma, indicating hemosiderin (short arrow). B: Coronal T2-weighted MR image shows overall hyperintensity of the hematoma (arrow), exception made for a very thin low-signal-intensity peripheral rim caused by hemosiderin.
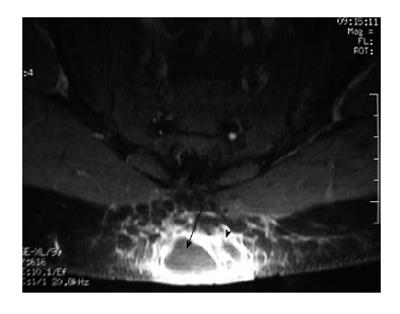
Figure 12 Abscess.
Axial gadolinium-enhanced T1-weighted image with fat saturation shows a mass lesion within the subcutaneous fat of the buttock, with a pronounced rim of enhancement (arrowhead), corresponding to large amounts of granulation tissue. The unenhanced central area is a fluid-debris cavity (arrow).
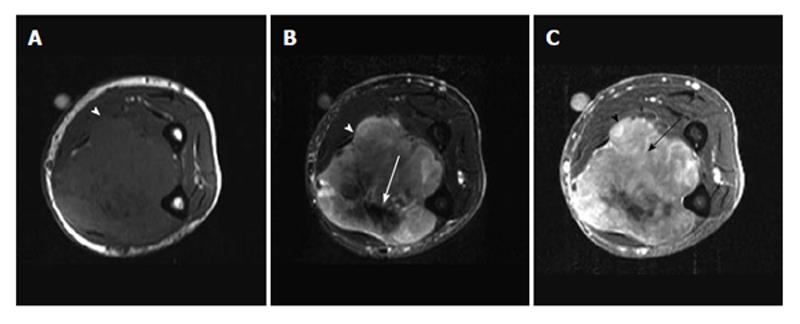
Figure 13 Malignant fibrous histiocytoma.
A: Axial T1-weighted MR image of the forearm shows a soft-tissue tumor (arrowhead) with a relatively well-defined margin. No invasion to the adjacent radius or ulna was noted; B: Axial T2-weighted MR image shows heterogeneous signal intensity of the tumor mass (arrowhead), with an area of low signal intensity (arrow), suggesting fibrosis; C: Axial gadolinium-enhanced T1-weighted image with fat saturation shows enhancement of the parenchymal tissue (arrow) of the tumor mass (arrowhead), corresponding to the hypervascular part of the tumor. MR: Magnetic resonance.
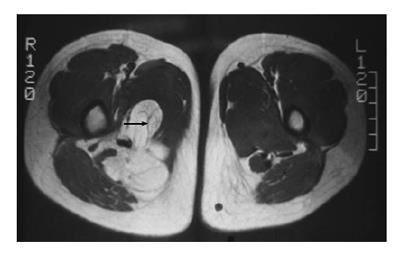
Figure 14 Low-grade liposarcoma.
Axial T1-weighted MR image of bilateral thighs shows a lobulated high-signal-intensity mass with uneven or focal thickening septa (arrow) within the tumor on the right thigh, which can be a finding for low-grade liposarcoma. MR: Magnetic resonance.
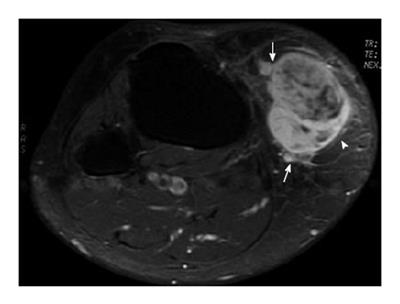
Figure 15 Malignant peripheral nerve sheath tumor involving the subcutis of the right knee in a 65-year-old woman.
Tumor mass (arrowhead) is located in the subcutaneous area of the right knee. The mass has an ill-defined margin (arrows) with a fascicular appearance centrally.
- Citation: Chan WP. Magnetic resonance imaging of soft-tissue tumors of the extremities: A practical approach. World J Radiol 2013; 5(12): 455-459
- URL: https://www.wjgnet.com/1949-8470/full/v5/i12/455.htm
- DOI: https://dx.doi.org/10.4329/wjr.v5.i12.455


