Copyright
©2013 Baishideng Publishing Group Co.
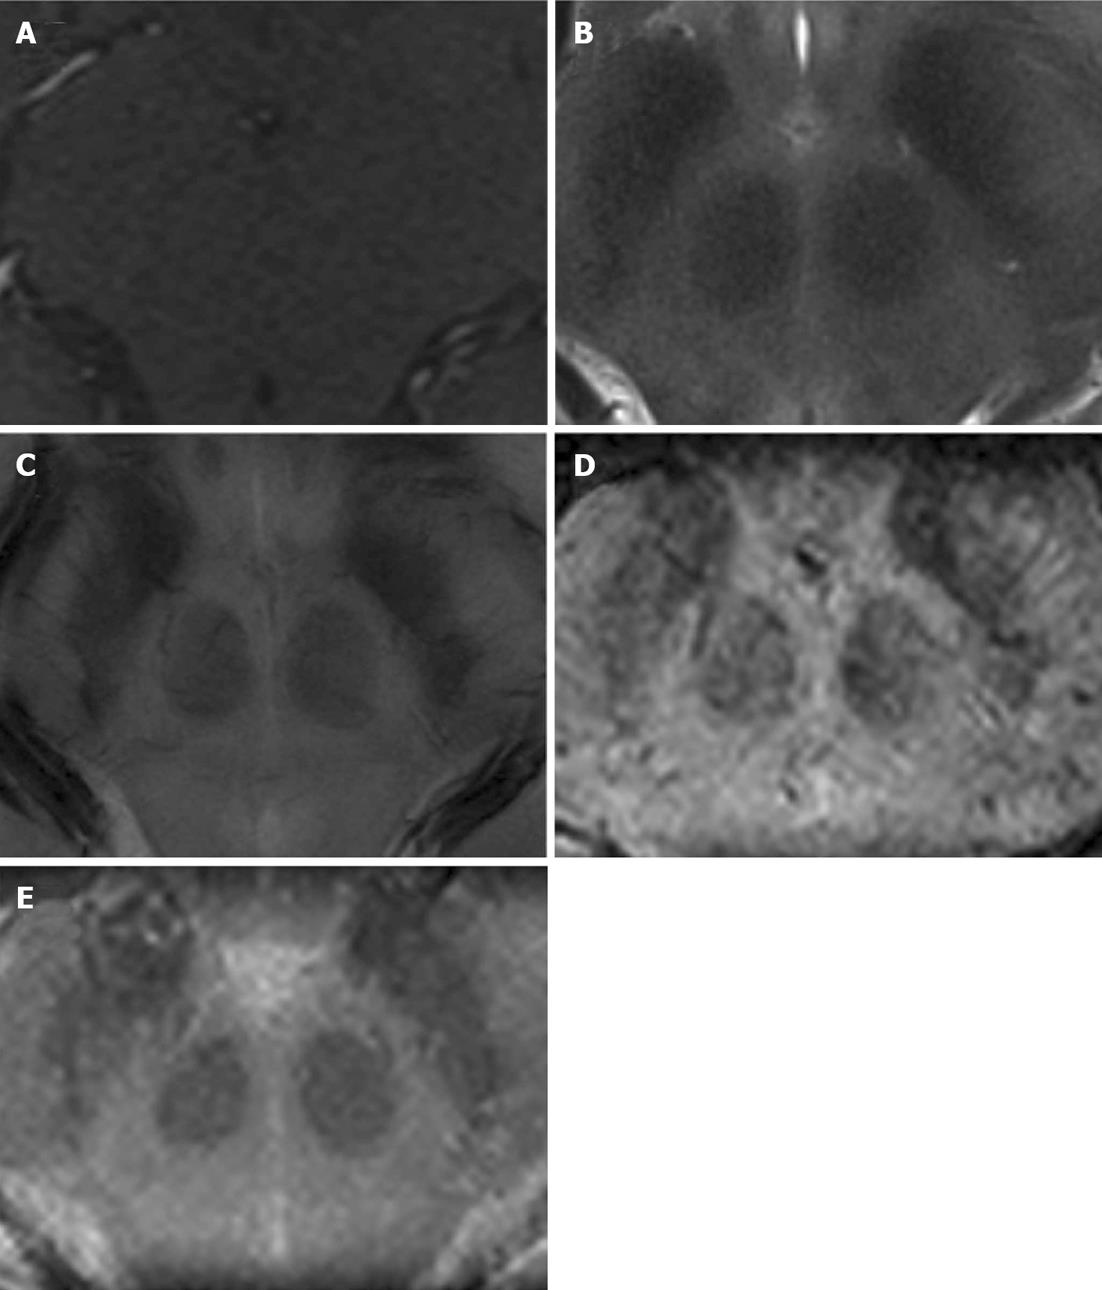
Figure 1 Representative enlarged axial view of the zona incerta.
A: T1-weighted gradient-echo transversal; B: T2-turbo spin-echo transversal; C: FLASH2D-T2Star transversal; D: Susceptibility-weighted imaging (SWI) transversal; E: SWI-minimum intensity projections transversal.
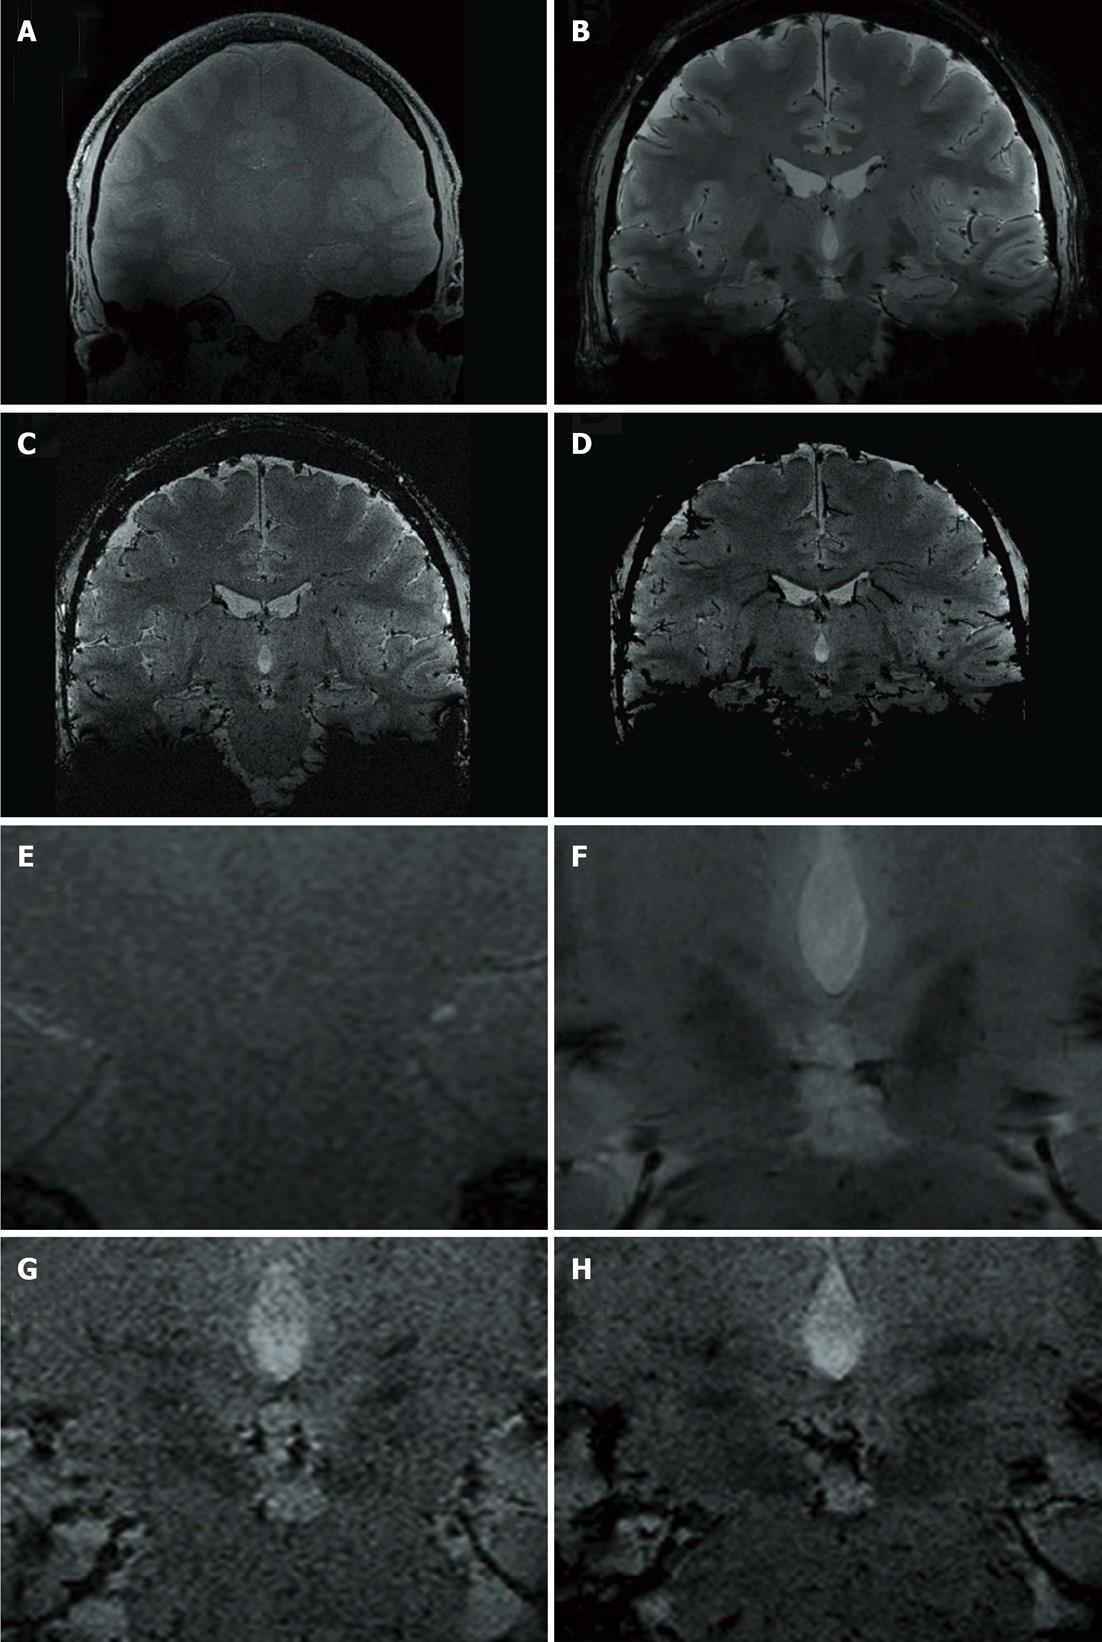
Figure 2 Non-enlarged (A-D) and enlarged (E-H) representative coronal images at the level of the zona incerta.
A, E: T1-weighted gradient-echo coronal; B, F: FLASH2D-T2Star coronal; C, G: Susceptibility-weighted imaging (SWI) coronal; D, H: SWI-minimum intensity projections coronal.
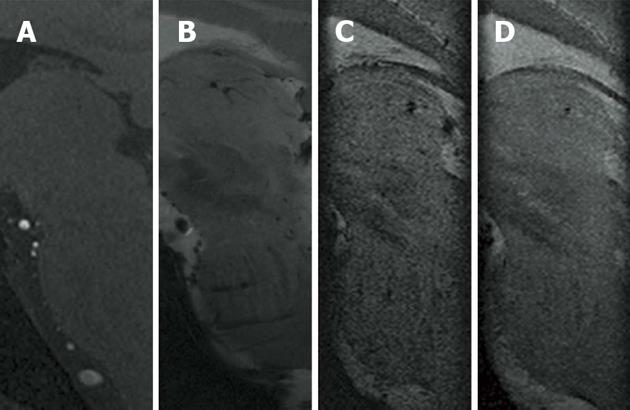
Figure 3 Representative enlarged visualization of the zona incerta in sagittal view.
A: T1-weighted gradient-echo sagittal; B: FLASH2D-T2Star sagittal; C: Susceptibility-weighted imaging (SWI) sagittal; D: SWI-minimum intensity projections sagittal.
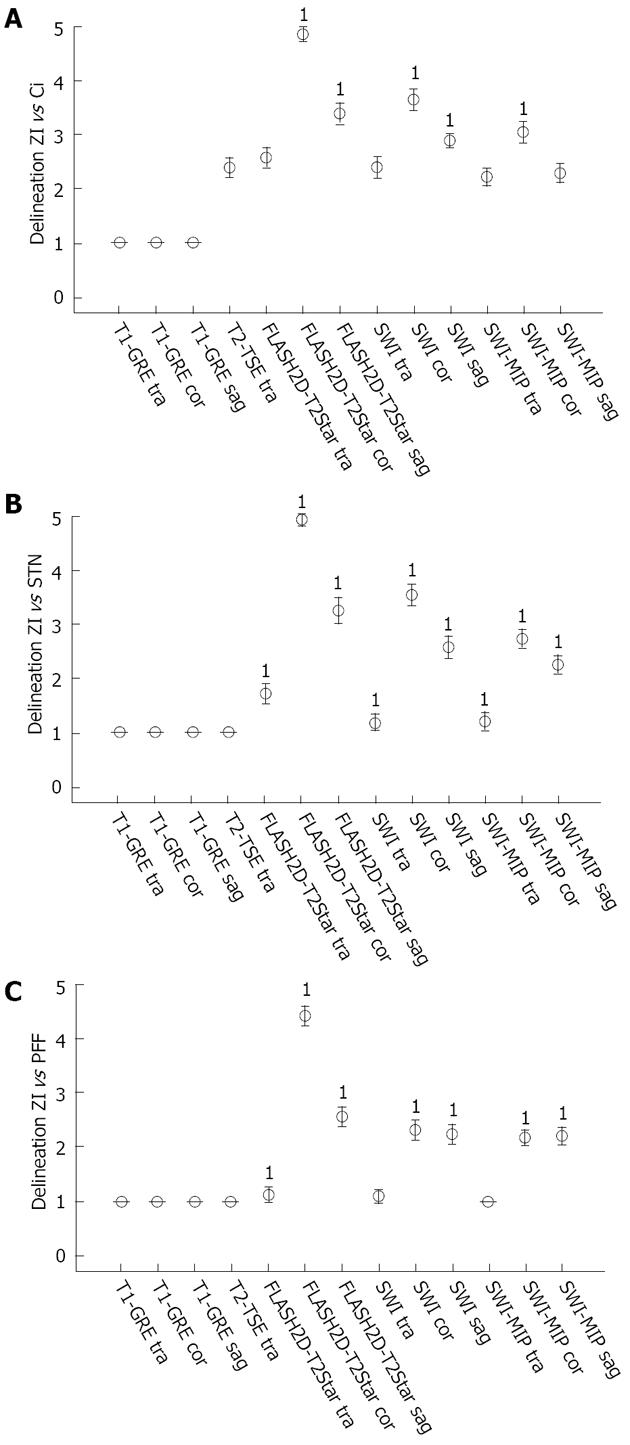
Figure 4 Qualitative ratings.
A: Average delineation of the zona incerta (ZI) vs the internal capsule; B: ZI vs the subthalamic nucleus; C: ZI vs pallidofugal fibres. The table (left) indicates the average delineation and the standard deviation of the mean as well as the inter-rater reliability (κ) with its statistically significance (P value). The diagram (right) demonstrates the average delineation for the ZI, error bars indicate the 95%CI of the mean. Sequences with a statistically significant superior delineation compared to T2-TSE imaging (paired t-test) are denoted (1).
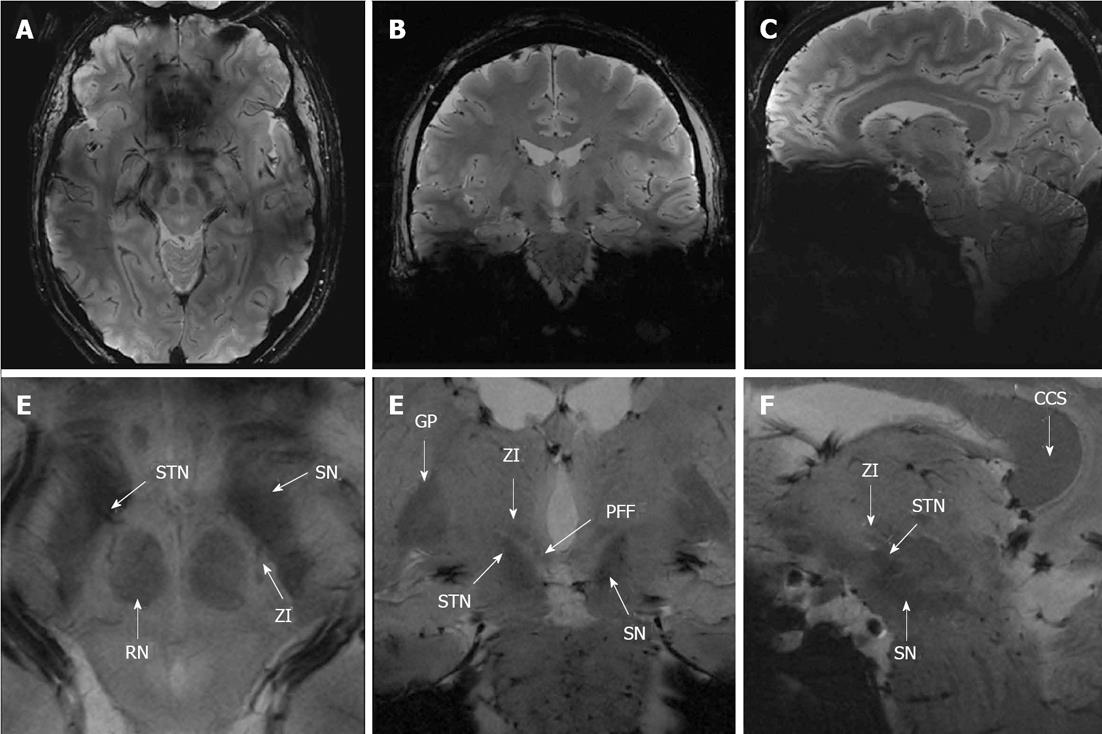
Figure 5 Illustration of the subthalamic area in FLASH2D-T2Star (A, B, C; magnified in D, E, F).
The zona incerta (ZI) and the surrounding structures are indicated. STN: Subthalamic nucleus; PFF: Pallidofugal fibres; SN: Substantia nigra; RN: Red nucleus; GP: Globus pallidus; CCS: Splenium corporis callosi.
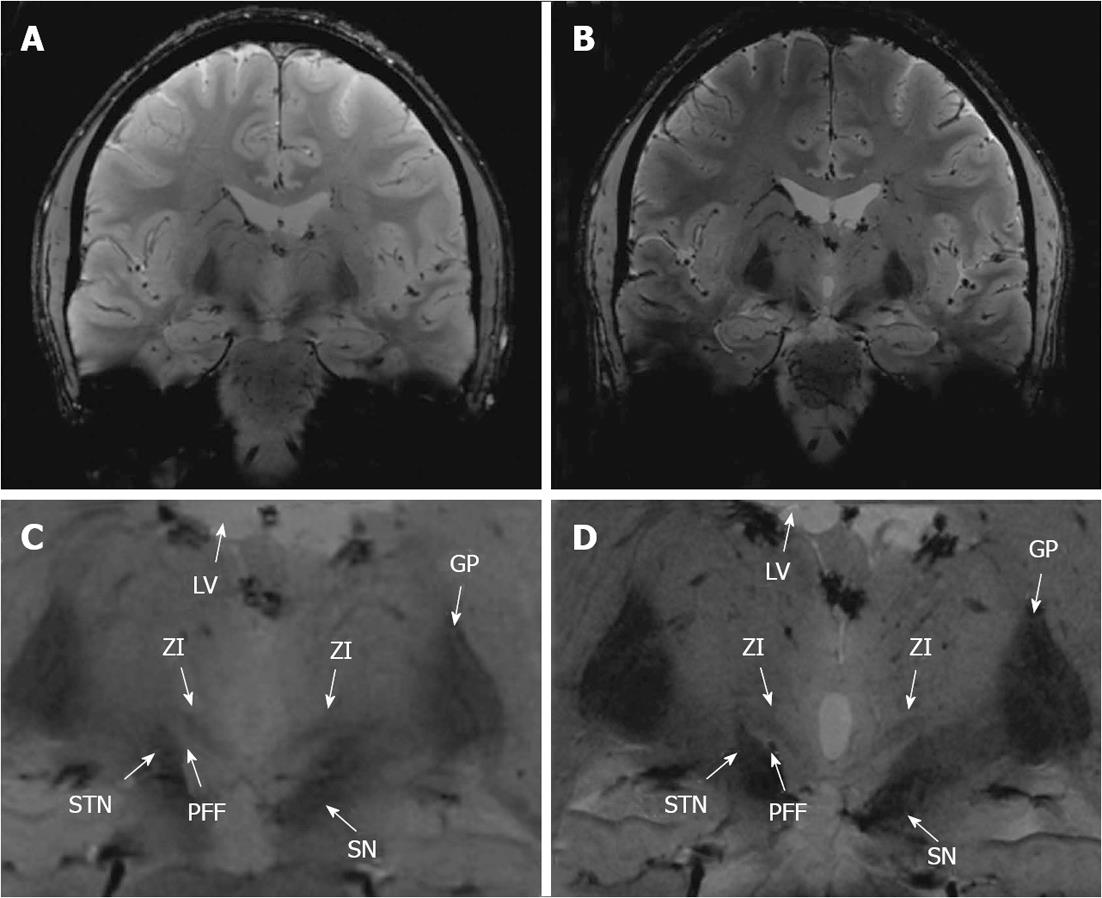
Figure 6 Illustration of the subthalamic area in coronal FLASH2D-T2Star imaging at 3.
0 Tesla (A; magnified in C) and 7.0 Tesla (B; magnified in D). The zona incerta (ZI) and the surrounding structures are indicated. STN: Subthalamic nucleus; PFF: Pallidofugal fibres; SN: Substantia nigra; GP: Globus pallidus; LV: Lateral ventricle.
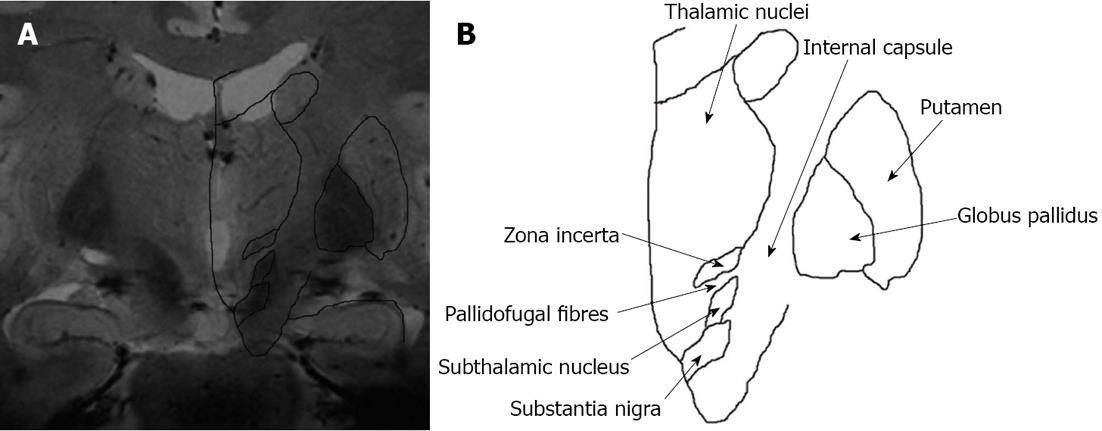
Figure 7 Co-registration of a coronal FLASH2D-T2Star image at the level of the zona incerta with a coronal schematic drawing of the deep brain nuclei (due to license issues the respective image from the Schaltenbrand and Wahren atlas is currently not available for open-access publication) (A), schematic drawing, at the level of the zona incerta (B).
The zona incerta is demarcated as a hypointense structure cranial to the subthalamic nucleus.
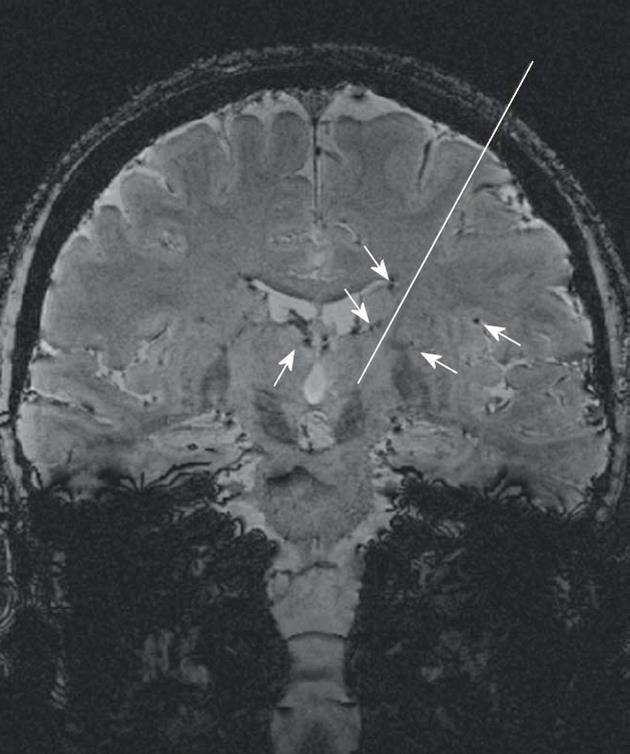
Figure 8 The use of susceptibility-weighted imaging for stereotactic navigation.
In the coronal susceptibility-weighted imaging at the level of the zona incerta the deep cerebral veins and tiny transparenchymal vessels (arrows) can be easily identified. Thereby the trajectory (white line) can be readjusted to avoid hemorrhage.
- Citation: Kerl HU, Gerigk L, Brockmann MA, Huck S, Al-Zghloul M, Groden C, Hauser T, Nagel AM, Nölte IS. Imaging for deep brain stimulation: The zona incerta at 7 Tesla. World J Radiol 2013; 5(1): 5-16
- URL: https://www.wjgnet.com/1949-8470/full/v5/i1/5.htm
- DOI: https://dx.doi.org/10.4329/wjr.v5.i1.5


