Copyright
©2012 Baishideng Publishing Group Co.
World J Radiol. Aug 28, 2012; 4(8): 353-371
Published online Aug 28, 2012. doi: 10.4329/wjr.v4.i8.353
Published online Aug 28, 2012. doi: 10.4329/wjr.v4.i8.353
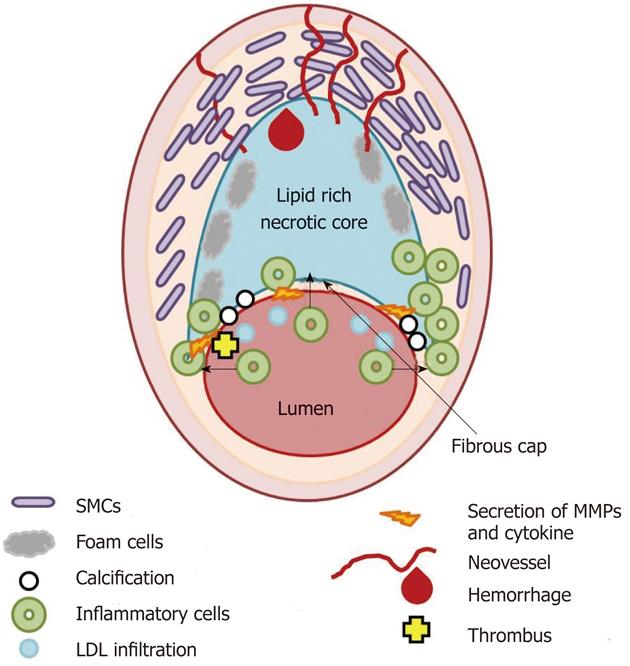
Figure 1 Scheme of the thin fibrous cap atheroma.
Main cellular components characterizing atherosclerotic plaque formation and destabilization are illustrated as well as biological and morphological features occurring in vulnerable plaque. SMCs: Smooth muscle cells; LDL: Low density lipoprotein; MMPs: Matrix metalloproteases.
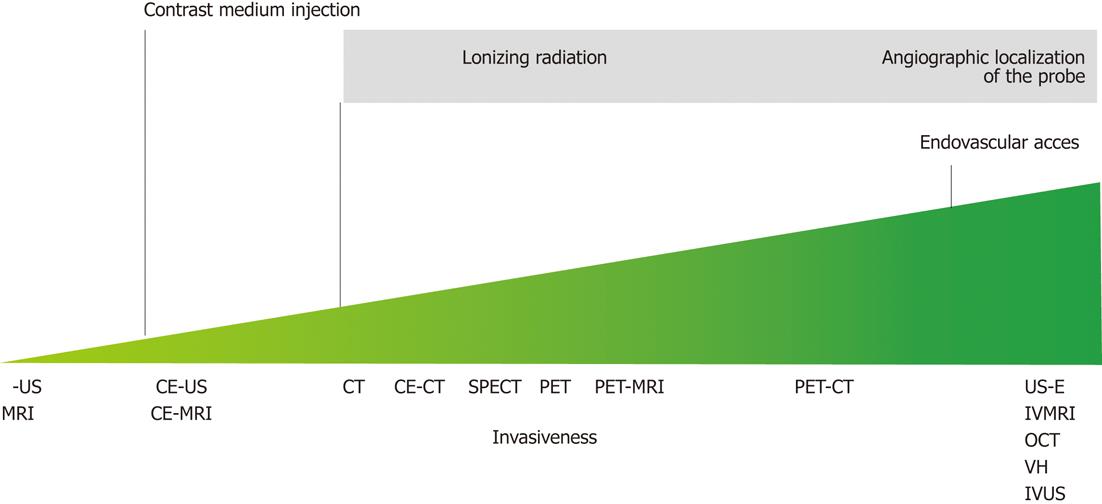
Figure 2 Illustration of the invasiveness of the possible plaque imaging modalities along with the reasons of their grading.
MRI: Magnetic resonance imaging; IB-US: Integrated backscatter ultrasound; CE-US: Contrast enhanced ultrasound; CE-MRI: Contrast enhanced magnetic resonance imaging; CT: Computed tomography; CE-CT: Contrast enhanced computed tomography; SPECT: Single proton emission computed tomography; PET: Positron emission tomography; US-E: Ultrasound elastography; IVMRI: Intravascular magnetic resonance imaging; OCT: Optical coherence tomography; VH: Virtual histology; IVUS: Intravascular ultrasound.
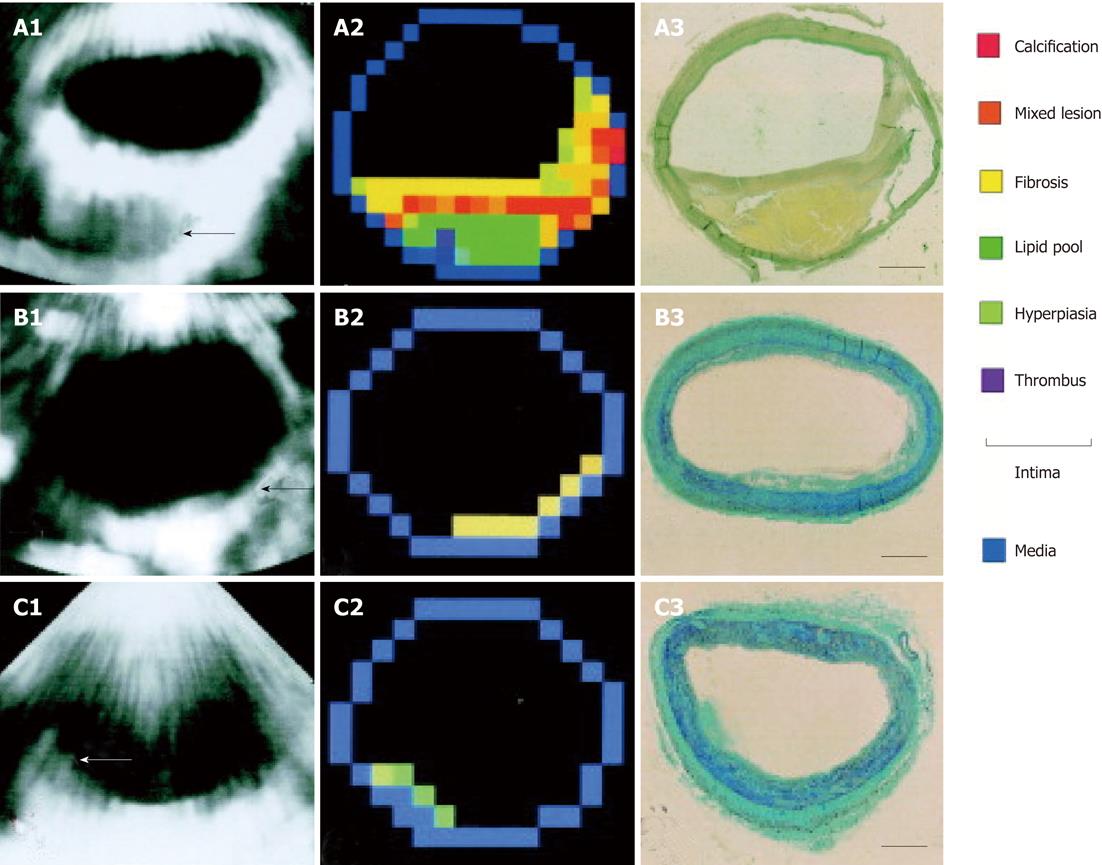
Figure 3 Example of plaque characterization trough integrated backscatter ultrasonography.
A: Large plaque (arrow); A1: An integrated backscatter (IB) image at autopsy; A2: A color-coded map constructed from A1, based on the five IB categories and conventional 2D echo findings; A3: van Gieson staining of the same segment as the IB measurement (bar = 1 mm); B: Intimal fibrosis (arrow); B1: An IB image during life; B2: A color-coded map constructed from B1; B3: Masson’s trichrome staining of the same segment; C: Intimal hyperplasia consisting of smooth muscle cells (arrow); C1: An integrated backscatter image during life; C2: A color-coded map constructed from C1; C3: Masson’s trichrome staining of the same segment (reprint with permission)[32].
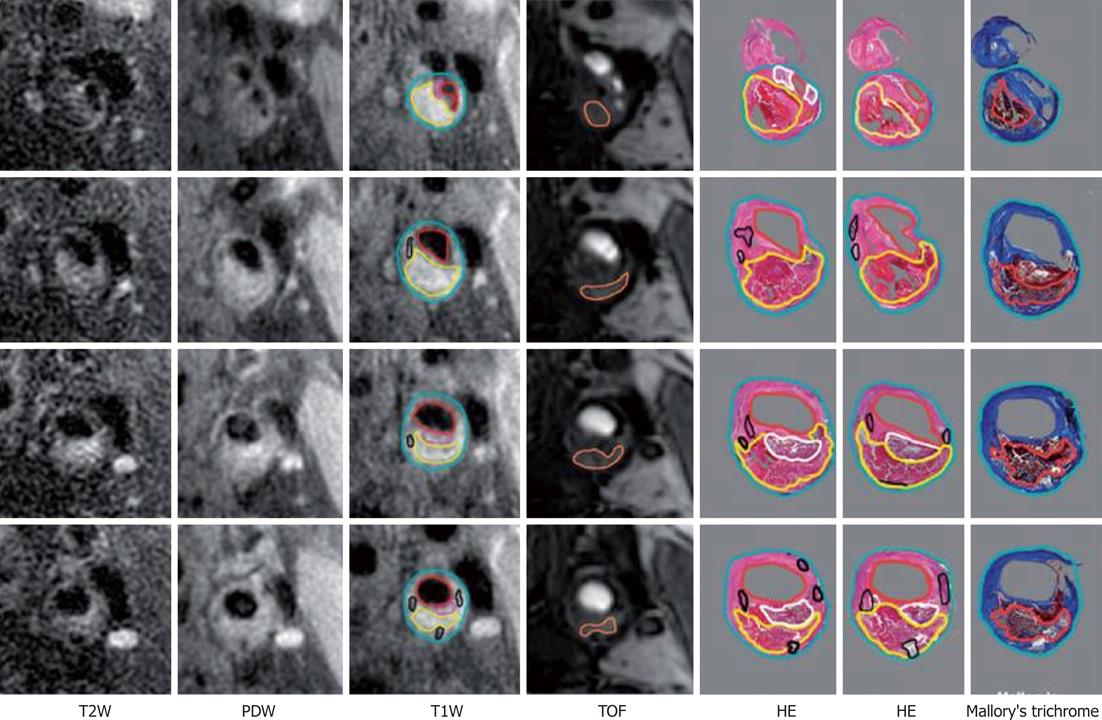
Figure 4 Example of histological validation of magnetic resonance imaging at four consecutive locations spanning the bifurcation.
Multiple histological sections (at 0.5-1.0 mm-separation) generally correspond to each 2-mm thick image. Contours have been drawn for lumen (red), outer wall (cyan), lipid-rich/necrotic core (yellow), calcification (black), loose fibrous matrix (pink/white) and hemorrhage (orange)[49]. TOF: Time-of flight; HE: Hematoxylin and eosin; PDW: Proton density weighted; T2W: T2-weighted; T1W: T1-weighted.
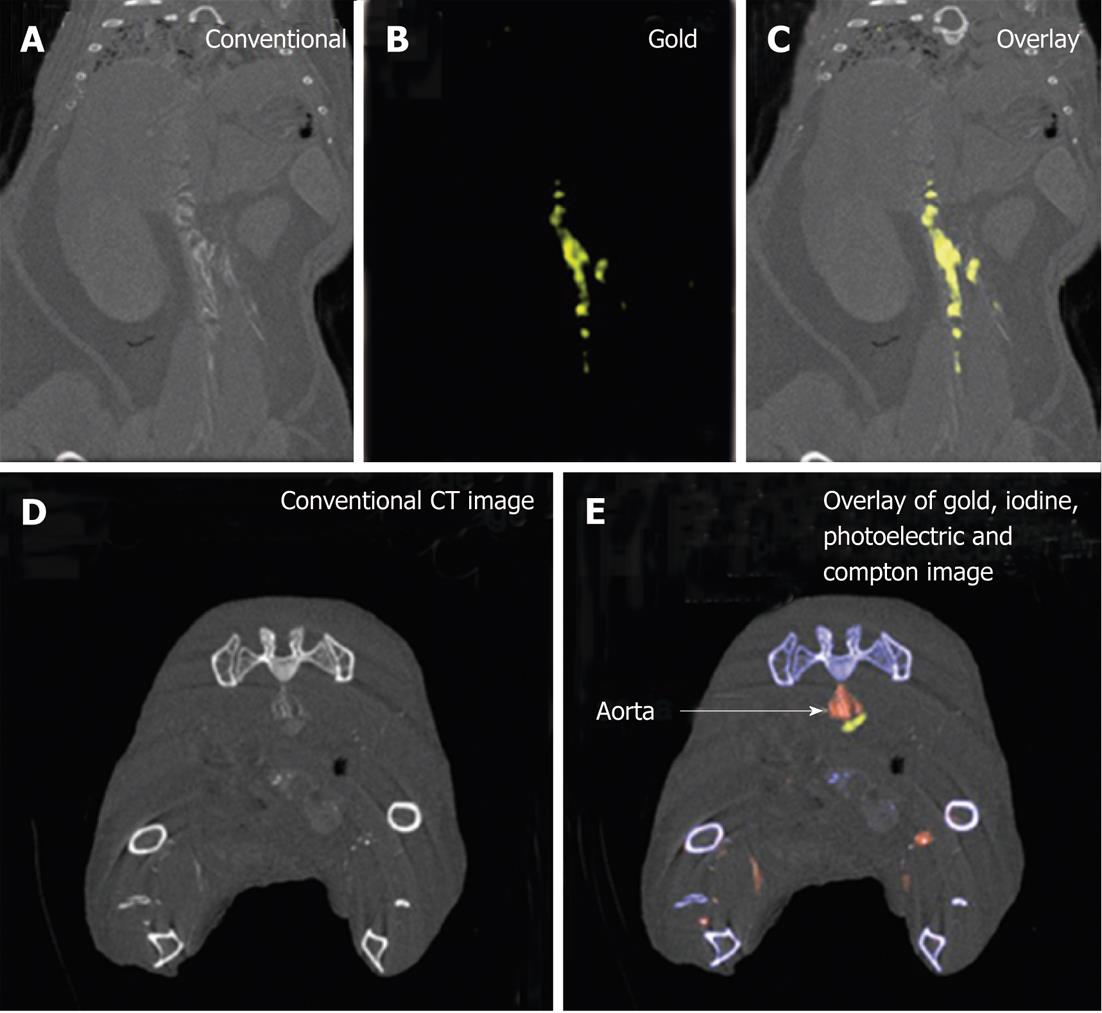
Figure 5 Example of gold high-density lipoprotein nanoparticle contrast agent detection through spectral computed tomography.
A-C: Spectral computed tomography (CT) images of thorax and abdomen in apolipoprotein E knockout (apo E-KO) mouse injected 24 h earlier with gold high-density lipoprotein nanoparticle contrast agent (Au-HDL); D, E: Spectral CT images near bifurcation of aorta in apo E-KO mouse injected with Au-HDL and an iodinated emulsion contrast agent (Fenestra VC) for vascular imaging (reprint with permission)[82].
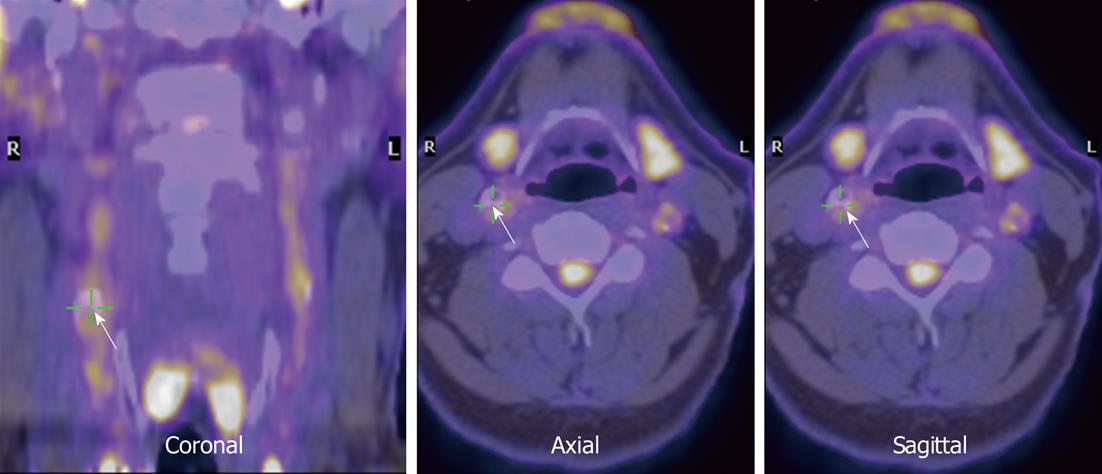
Figure 6 Co-registered fluorodeoxyglucose positron emission tomography and low-resolution magnetic resonance images in the neck region (arrows).
Right carotid is indicated (courtesy of Dr. Rudd).
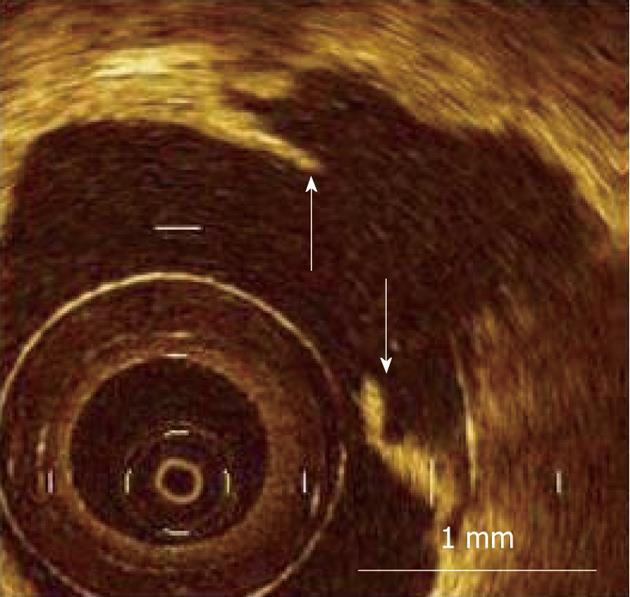
Figure 7 Measurement of fibrous cap thickness in ruptured plaque using optical coherence tomography.
Residual fibrous cap was identified as a flap between the lumen of the coronary artery and the cavity of plaque, and its thickness was measured at the thinnest part (arrows). Scale bar = 1 mm (courtesy of Dr. Kubo).
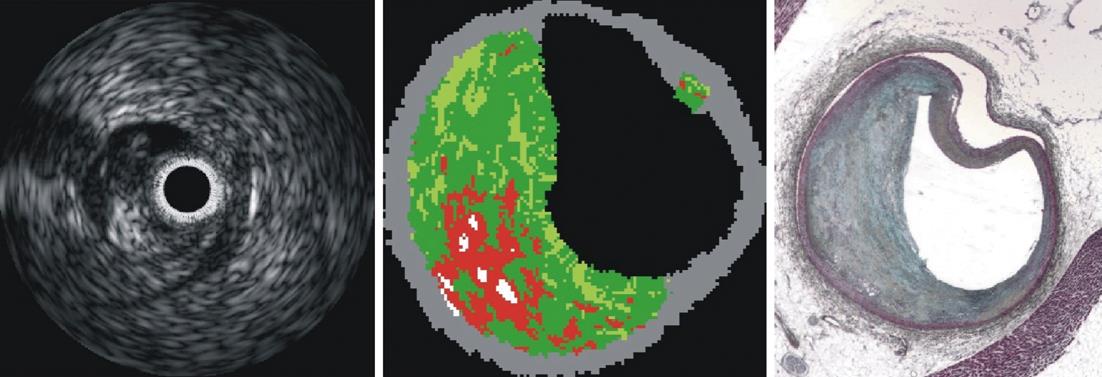
Figure 8 Example of intravascular ultrasound imaging (left), virtual histology (center) and movat pentachrome histology (courtesy of Dr.
Nair).
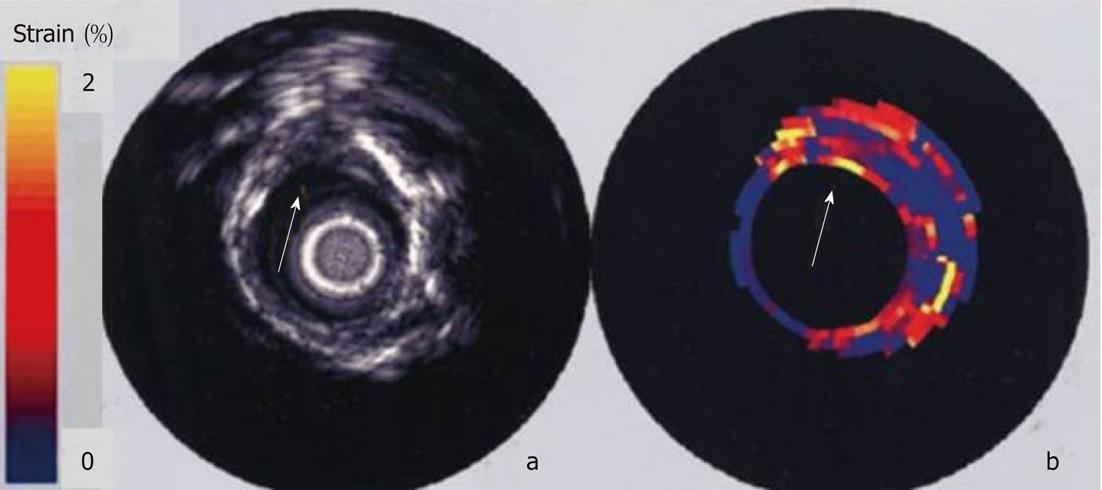
Figure 9 In vitro intravascular echogram and elastogram of a human femoral artery.
The elastogram reveals that the plaque at 12 o’clock contains a soft core that is covered from the lumen by a stiff cap. At 9 o’clock a soft tissue is present at the lumen vessel-wall boundary. A different strain was found at 9 and 3 o’clock and this difference was not present in the echogram[140].
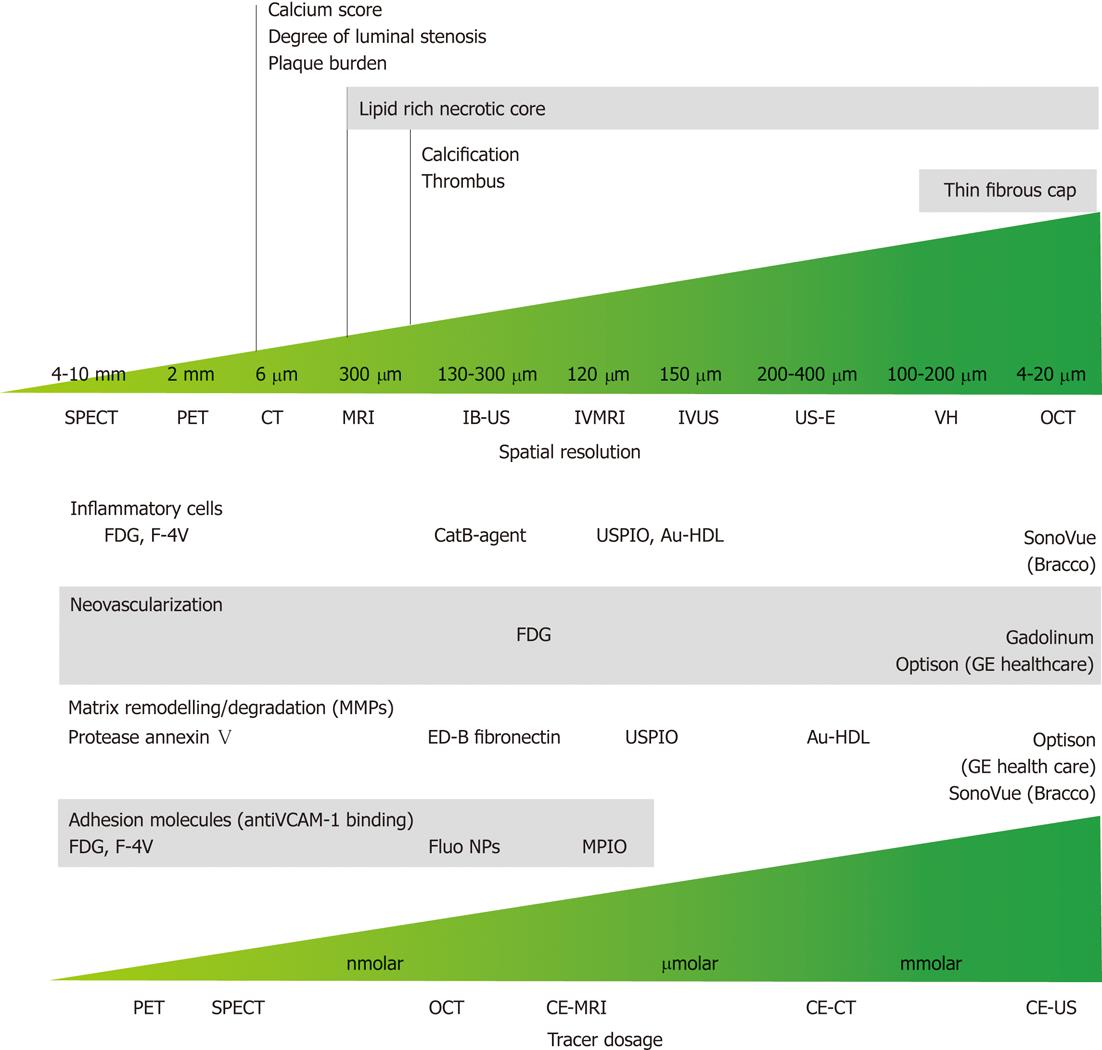
Figure 10 Spatial resolution and dose-effectiveness of different diagnostic imaging modalities.
Minimum spatial resolution required for the identification of the indicated morphological feature of vulnerable atherosclerotic plaque (top); dose effectiveness in the identification of specific biological processes and compound; specific target and respective tracer are indicated (bottom). SPECT: Single photon emission computed tomography; PET: Positron emission tomography; CT: Computed tomography; MRI: Magnetic resonance imaging; IB-US: Integrated backscatter ultrasonography; IVMRI: Intravascular magnetic resonance imaging; IVUS: Intravascular ultrasound; US-E: Intravascular ultrasound employed in elastography; VH: Virtual histology; OCT: Optical coherence tomography; CE-MRI: Contrast-enhanced magnetic resonance imaging; CE-CT: Contrast-enhanced computed tomography; CE-US: Contrast-enhanced ultrasonography; FDG: Fluorodeoxyglucose; USPIO: Ultra-small super paramagnetic iron oxide; Au-HDL: High-density lipoprotein nanoparticle contrast agent; VCAM: Vascular cell adhesion molecule; NP: Nanoparticle; MPIO: Microparticles of iron oxide.
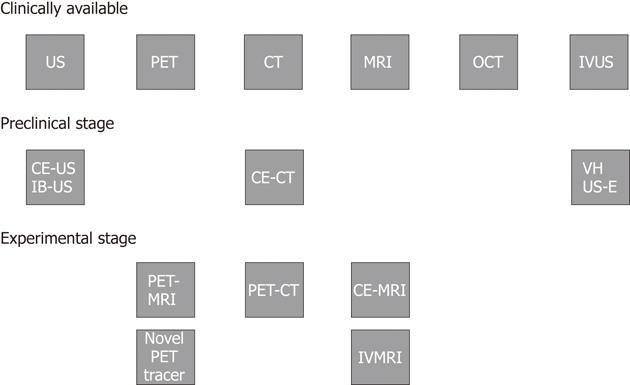
Figure 11 Clinical implementation and research status of diagnostic imaging modalities for atherosclerotic plaque characterization.
US: Ultrasonography; PET: Positron emission tomography; CT: Computed tomography; MRI: Magnetic resonance imaging; OCT: Optical coherence tomography; IVUS: Intravascular ultrasound; VH: Virtual histology; US-E: Intravascular ultrasound employed in elastography; CE-US: Contrast-enhanced ultrasonography; IB-US: Integrated backscatter ultrasonography; CE-CT: Contrast-enhanced computed tomography; PET-MRI: Positron emission tomography-magnetic resonance imaging; PET-CT: Positron emission tomography-computed tomography; CE-MRI: Contrast-enhanced-magnetic resonance imaging; IVMRI: Intravascular magnetic resonance imaging.
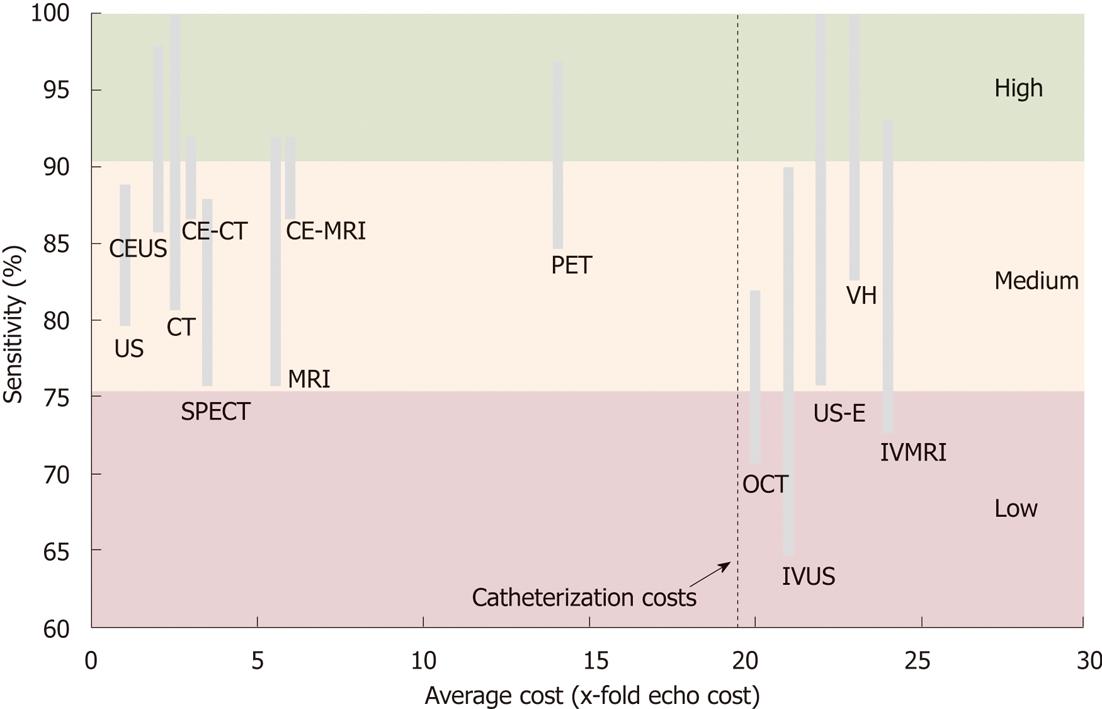
Figure 12 Cost-effectiveness of diagnostic imaging modalities for atherosclerotic plaque characterization.
The range of sensitivity is used for accuracy quantification. Echocardiography is the cost comparator where costs of other modalities are a ratio of x-fold higher costs. Indicated intravascular imaging costs add-up catheterization costs (costs are unit operating costs, not charges). CE-US: Contrast-enhanced ultrasonography; CE-CT: Contrast-enhanced computed tomography; CE-MRI: Contrast-enhanced magnetic resonance imaging; CT: Computed tomography; US: Ultrasound; SPECT: Single photon emission computed tomography; MRI: Magnetic resonance imaging; OCT: Optical coherence tomography; IVUS: Intravascular ultrasound; IVMRI: Intravascular magnetic resonance imaging.
- Citation: Soloperto G, Casciaro S. Progress in atherosclerotic plaque imaging. World J Radiol 2012; 4(8): 353-371
- URL: https://www.wjgnet.com/1949-8470/full/v4/i8/353.htm
- DOI: https://dx.doi.org/10.4329/wjr.v4.i8.353


