Copyright
©2012 Baishideng Publishing Group Co.
World J Radiol. Jun 28, 2012; 4(6): 265-272
Published online Jun 28, 2012. doi: 10.4329/wjr.v4.i6.265
Published online Jun 28, 2012. doi: 10.4329/wjr.v4.i6.265
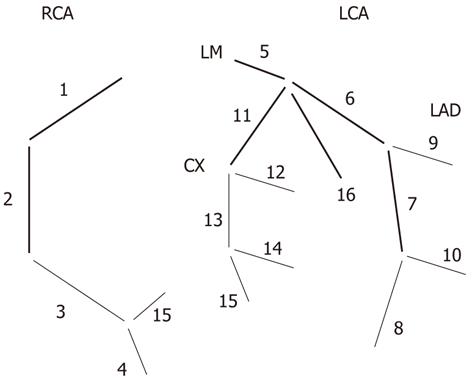
Figure 1 Classification of coronary segments.
Modified American Heart Association classification of coronary artery segments (according to Austen et al[22]). RCA: Right coronary artery; LCA: Left coronary artery; LM: Left main coronary artery; CX: Circumflex coronary artery; LAD: Left anterior descending coronary artery.
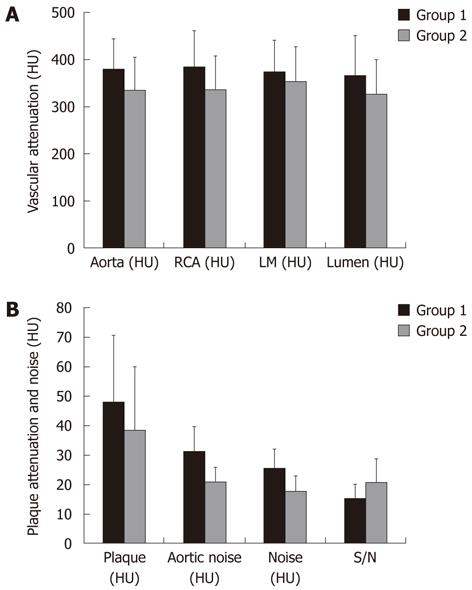
Figure 2 Vascular attenuation, plaque attenuation and noise.
Main vascular attenuation evaluations (A) and signal/noise parameters (B). Group 1 always shows a significantly higher vascular attenuation (A, P < 0.05). Group 2, in contrast, shows a lower noise which ultimately results in a significantly higher S/N (P < 0.05). HU: Hounsfield units; S/N: Signal to noise ratio.
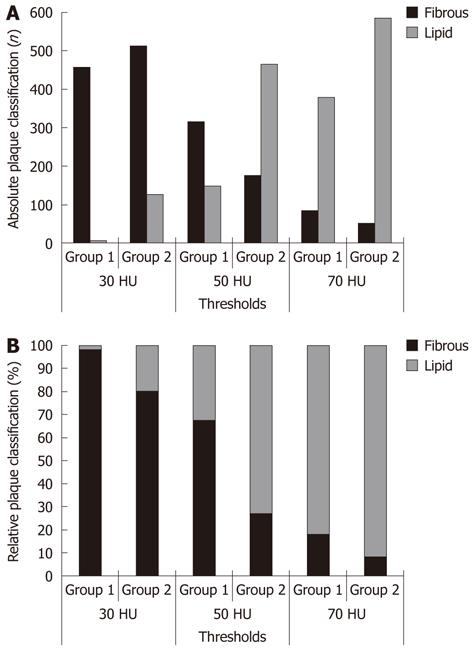
Figure 3 Classification of non-calcified plaques depending on Hounsfield unit threshold.
The absolute (A) and relative (B) distribution of plaques in Group 1 and Group 2 depending on the threshold applied for defining lipid rich vs fibrous plaques. Group 2 shows a higher prevalence of lipid rich plaques using all three thresholds. The prevalence is increased using higher thresholds. n: Number of plaques; HU: Hounsfield units.
- Citation: Maffei E, Martini C, Arcadi T, Clemente A, Seitun S, Zuccarelli A, Torri T, Mollet NR, Rossi A, Catalano O, Messalli G, Cademartiri F. Plaque imaging with CT coronary angiography: Effect of intra-vascular attenuation on plaque type classification. World J Radiol 2012; 4(6): 265-272
- URL: https://www.wjgnet.com/1949-8470/full/v4/i6/265.htm
- DOI: https://dx.doi.org/10.4329/wjr.v4.i6.265


