Copyright
©2012 Baishideng Publishing Group Co.
World J Radiol. Oct 28, 2012; 4(10): 431-438
Published online Oct 28, 2012. doi: 10.4329/wjr.v4.i10.431
Published online Oct 28, 2012. doi: 10.4329/wjr.v4.i10.431
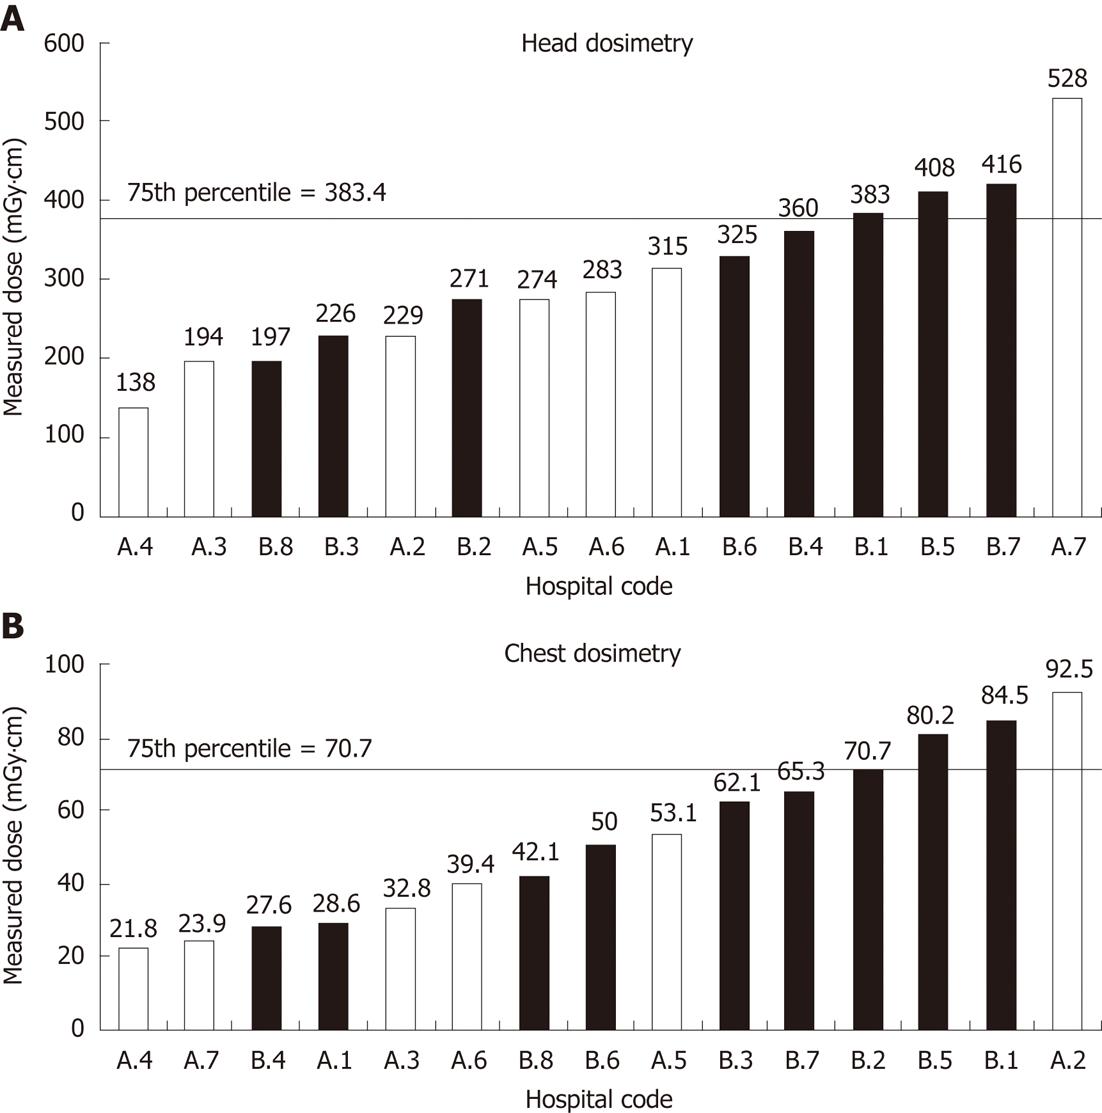
Figure 1 Mean head computed tomography dosimetry measurements from Australian and Saudi Arabian paediatric public hospitals.
A: Head; B: Chest.
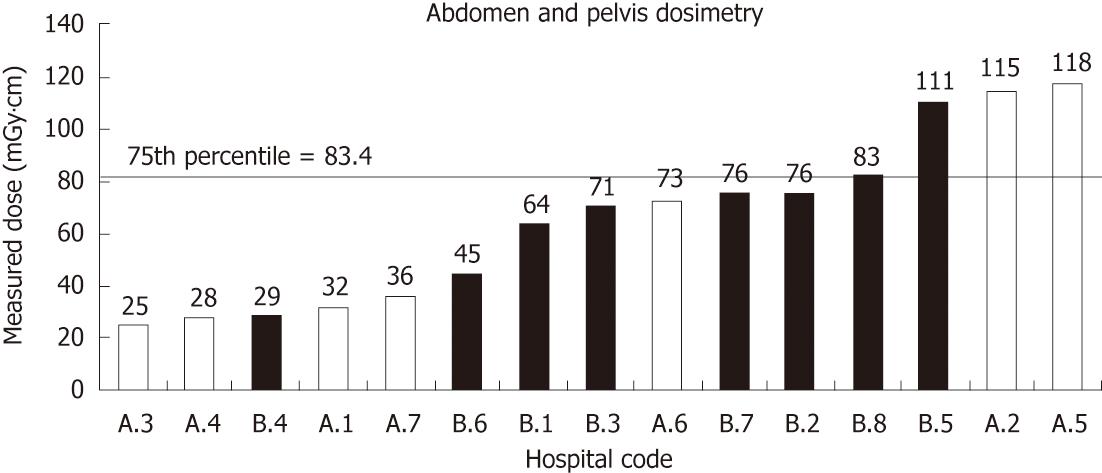
Figure 2 Mean abdomen/pelvis computed tomography dosimetry measurements from Australian and Saudi Arabian paediatric public hospitals.
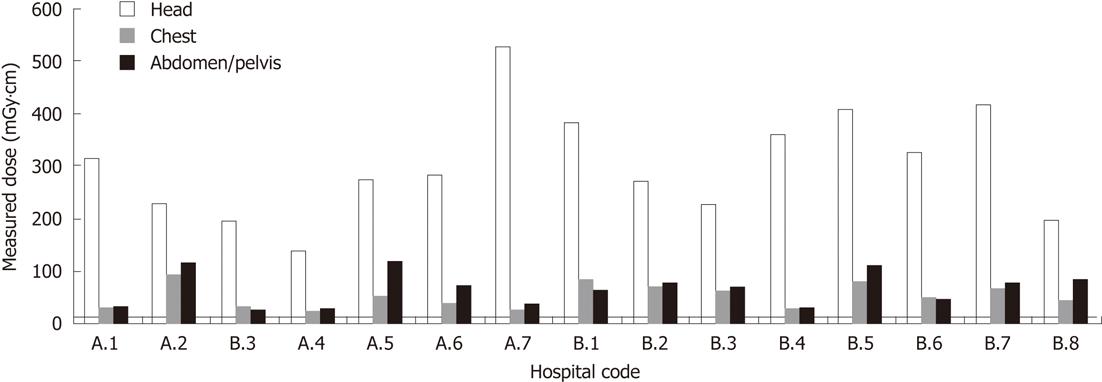
Figure 3 Combined mean dosimetry measurements from Australian and Saudi Arabian paediatric hospitals for head, chest and abdomen/pelvis.
Figure 4 Correlation between computed tomography console data and measured dose.
A: Head scans; B: Chest scans; C: Abdomen/pelvis scans.
- Citation: Mohiy HA, Sim J, Seeram E, Annabell N, Geso M, Mandarano G, Davidson R. A dose comparison survey in CT departments of dedicated paediatric hospitals in Australia and Saudi Arabia. World J Radiol 2012; 4(10): 431-438
- URL: https://www.wjgnet.com/1949-8470/full/v4/i10/431.htm
- DOI: https://dx.doi.org/10.4329/wjr.v4.i10.431


