Copyright
©2011 Baishideng Publishing Group Co.
World J Radiol. Jul 28, 2011; 3(7): 169-177
Published online Jul 28, 2011. doi: 10.4329/wjr.v3.i7.169
Published online Jul 28, 2011. doi: 10.4329/wjr.v3.i7.169
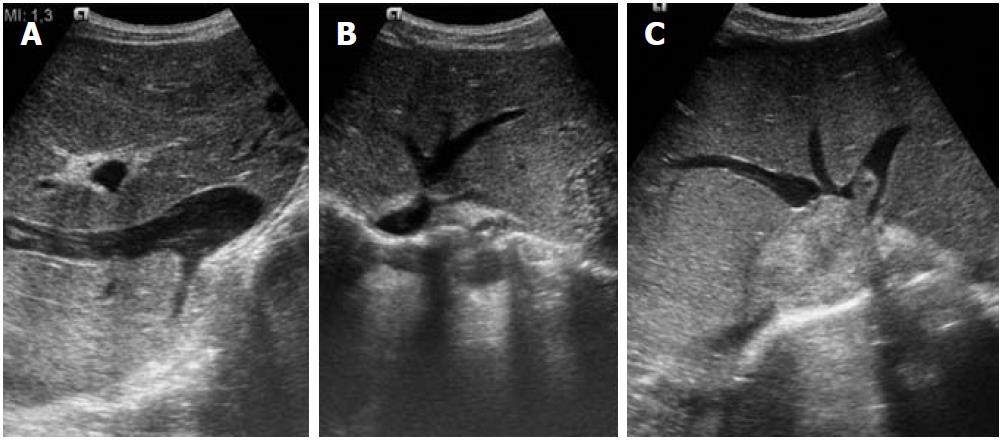
Figure 1 Ultrasound images.
A: Inferior vena cava (IVC) occlusion; B: Hepatic venous web causing outflow obstruction; C: Secondary Budd-Chiari syndrome due to IVC thrombus extending into the hepatic veins.
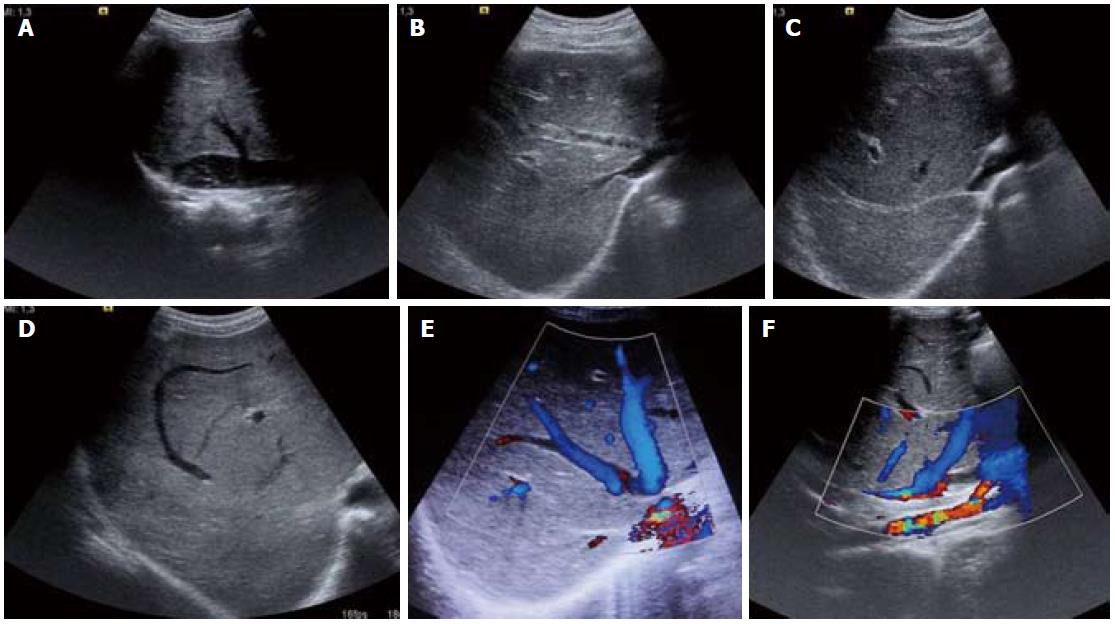
Figure 2 Ultrasound images (A-D) and color Doppler images (E, F).
A: Inferior vena cava web with intra-luminal floating thrombus; B: Partial thrombus within the middle hepatic vein and osteal narrowing of the right hepatic vein; C: Fibrosed right hepatic vein; D: Comma-shaped intrahepatic collaterals; E, F: Web at hepatic vein ostium and intrahepatic collaterals.
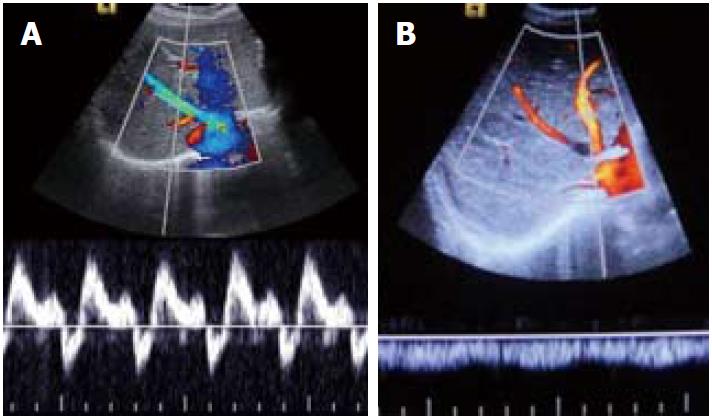
Figure 3 Spectral Doppler images.
A: Normal triphasic waveform of patent hepatic vein; B: Monophasic waveform in hepatic venous occlusion.
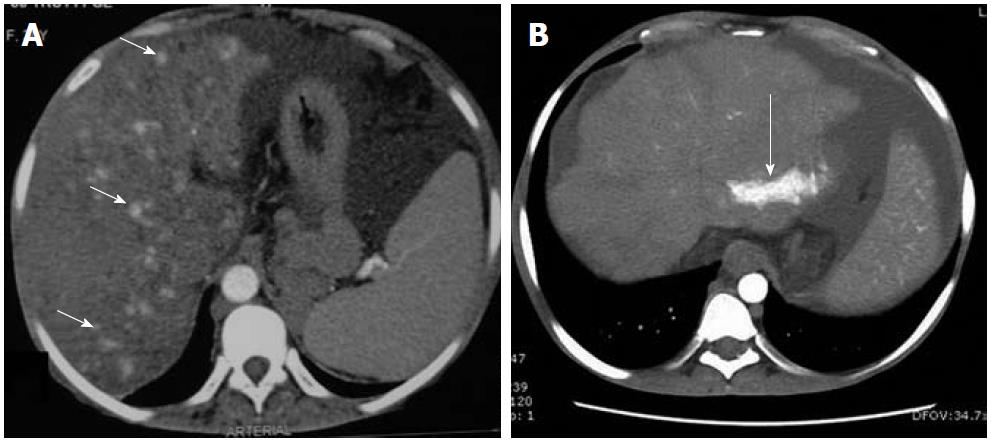
Figure 4 Contrast-enhanced arterial phase computed tomography images.
A: Nodular arterial enhancing lesions (short arrows) in a background of Budd-Chiari syndrome representing nodular regenerative hyperplasia; B: Another case of chronic Budd-Chiari syndrome. Focal enhancing area (long arrow) due to arterio-portal shunting.
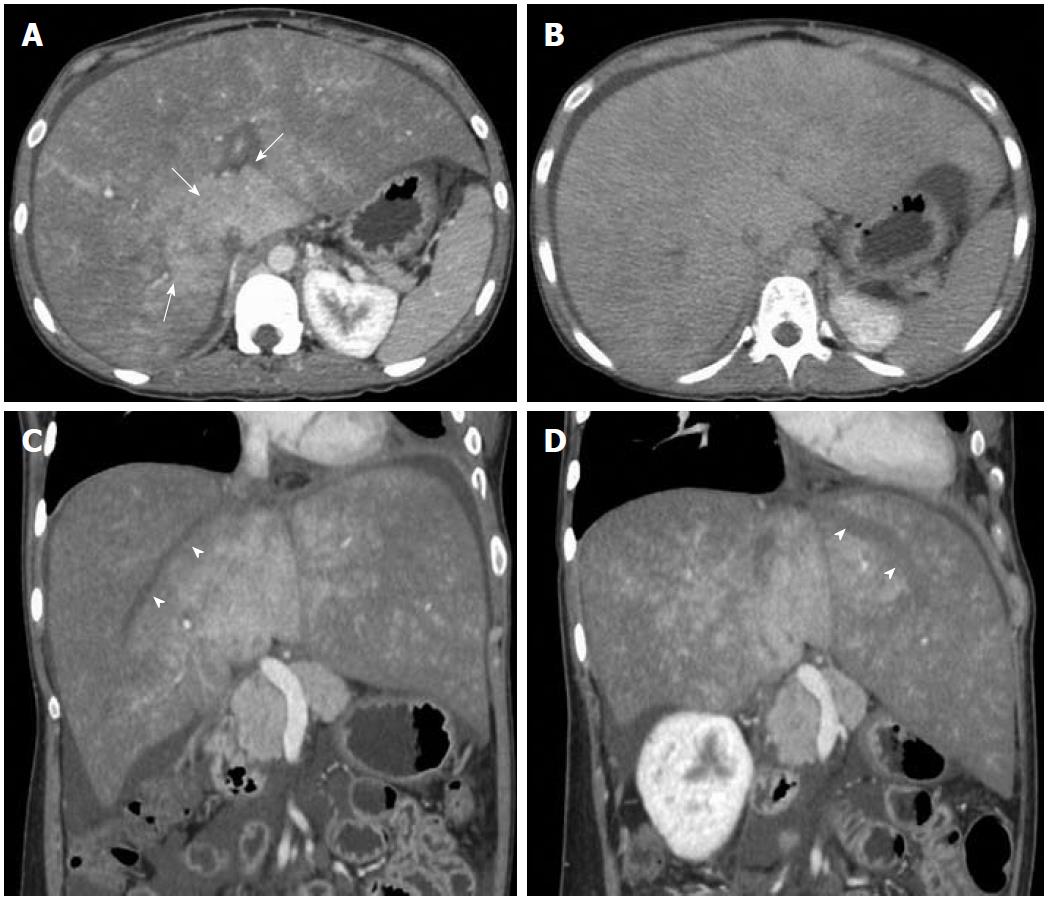
Figure 5 Axial computed tomography images.
Portal venous phase image (A) shows heterogeneous and mottled enhancement pattern with central prominence (arrows) which becomes more homogeneous in delayed phase (B). Oblique reformatted images (C, D) along the axis of the right and left hepatic veins show unopacified hepatic veins (arrowheads).
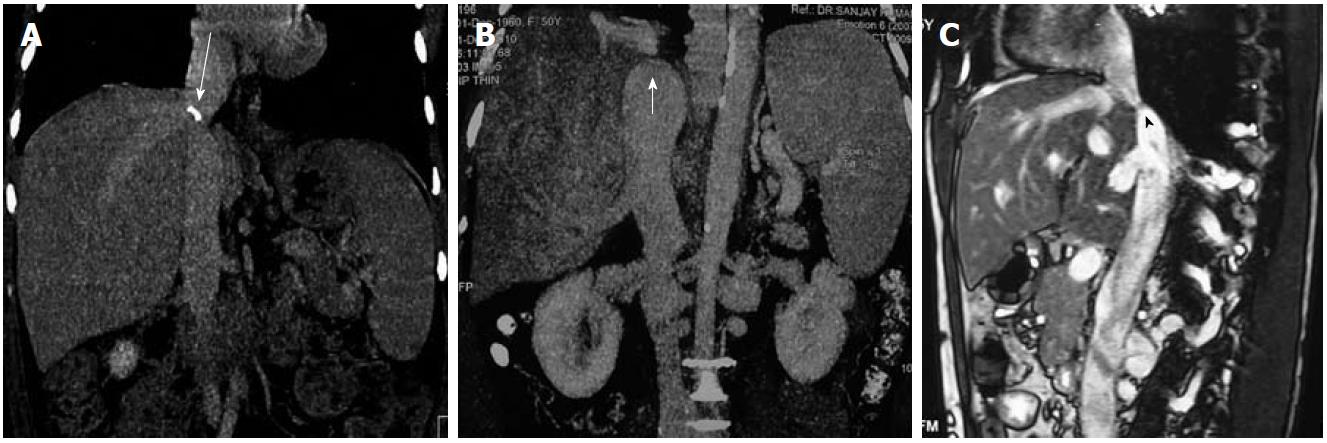
Figure 6 Inferior vena cava.
A, B: Computed tomography images (coronal reformatted) show calcified (long arrow) and non-calcified inferior vena cava (IVC) web (short arrow); C: Sagittal T2 weighted magnetic resonance imaging shows membranous occlusion of IVC (arrowhead).
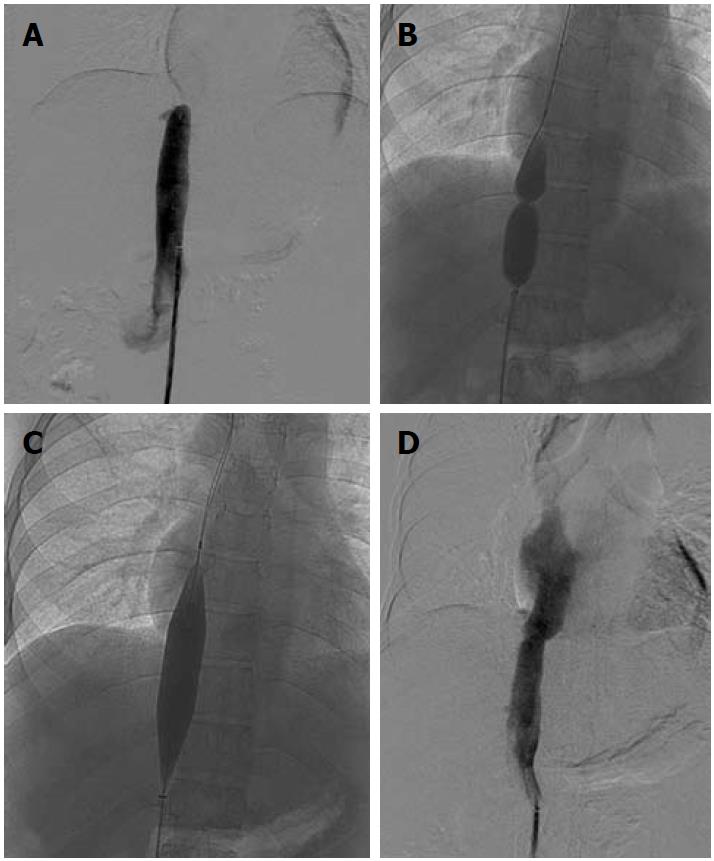
Figure 7 Inferior vena cavogram image.
A: Occlusion of suprahepatic inferior vena cava, which was crossed and balloon dilated; B, C: Dilatation of stenosed segment; D: Post dilatation venogram.
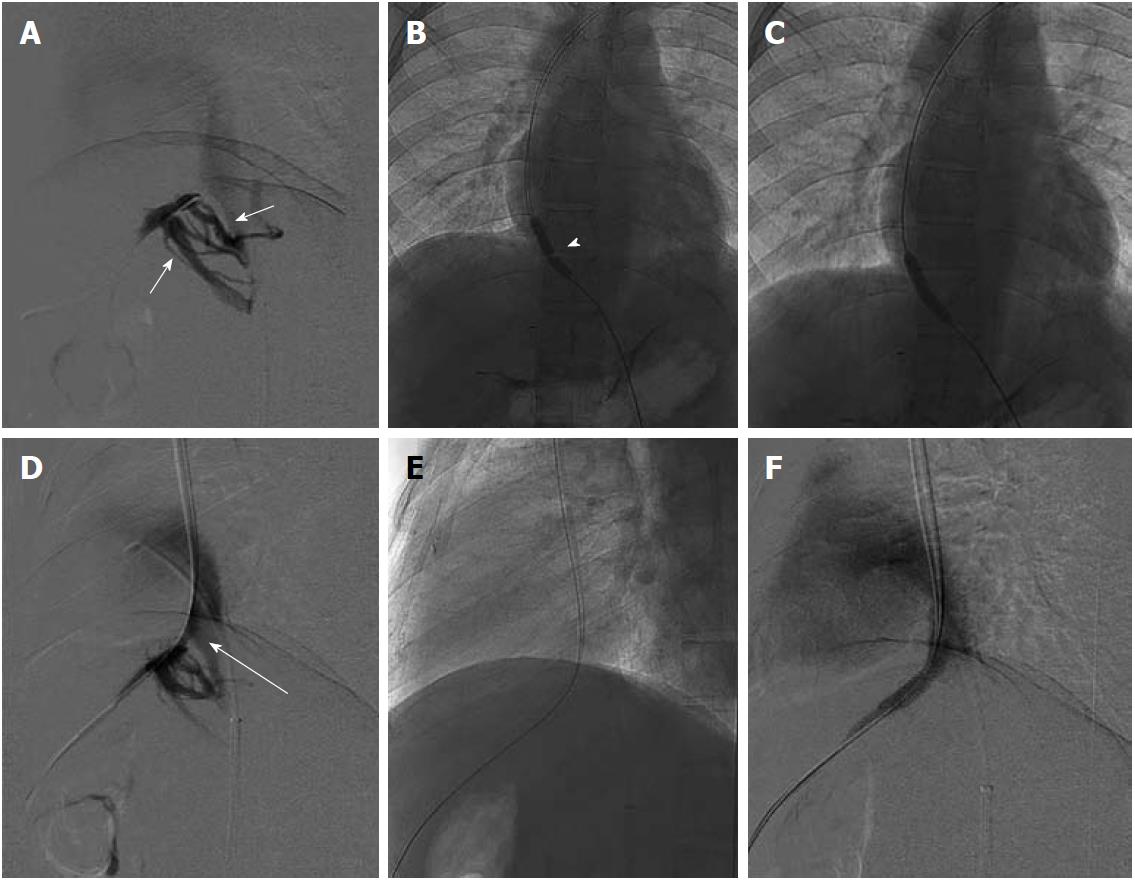
Figure 8 Hepatic venogram after percutaneous puncture.
A: Occlusion of hepatic veins with intrahepatic collaterals (short arrows); B: Balloon dilatation of the stricture with waist formation at the mid segment of balloon (arrowhead), The wire is placed percutaneously with distal end of wire in the left subclavian vein; C: Disappearance of waist; D: Residual stricture (long arrow) post dilatation hence leading to stent placement; E, F: Stent across the stricture with obliterated collaterals on post stenting venogram.
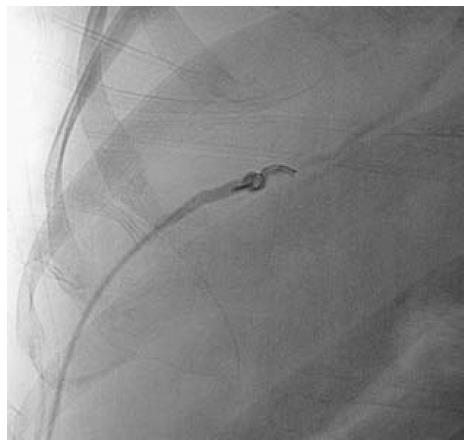
Figure 9 Fluoroscopic spot image showing closure of percutaneous track using embolization coil and Gelfoam slurry.
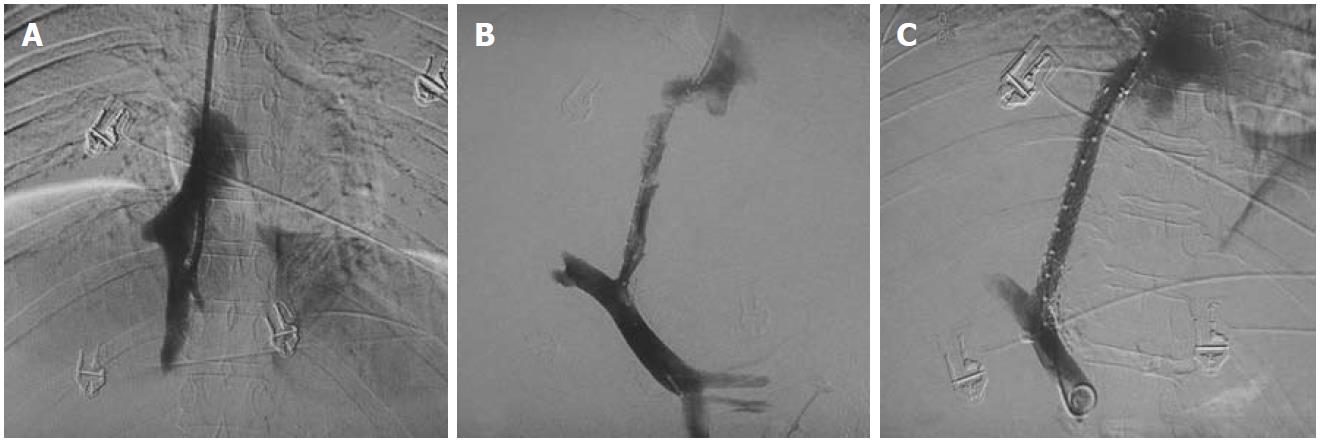
Figure 10 DSA images of chronic Budd-Chiari syndrome with complete occlusion of all hepatic veins, cavogram.
A: Small stump of right hepatic vein; B, C: Creation of porto-caval shunt and placement of transjugular intrahepatic portosystemic shunt stent.
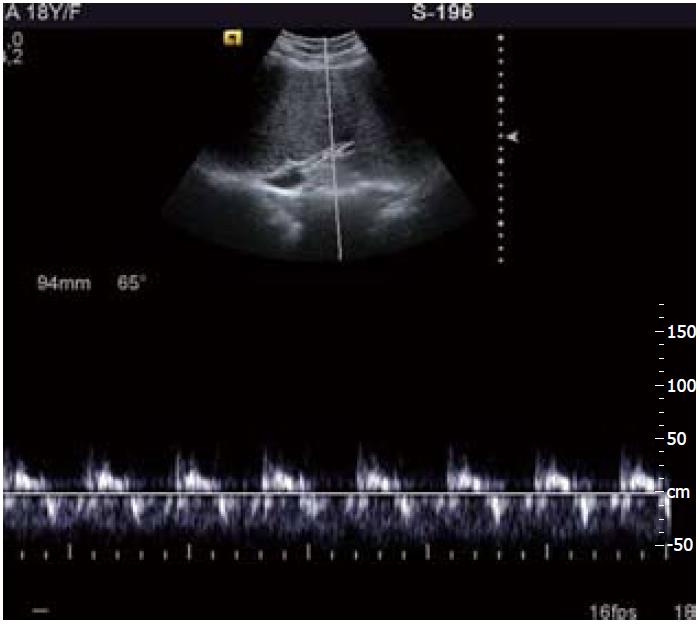
Figure 11 Follow up ultrasound Doppler image shows patent recanalized hepatic vein with normal triphasic waveform.
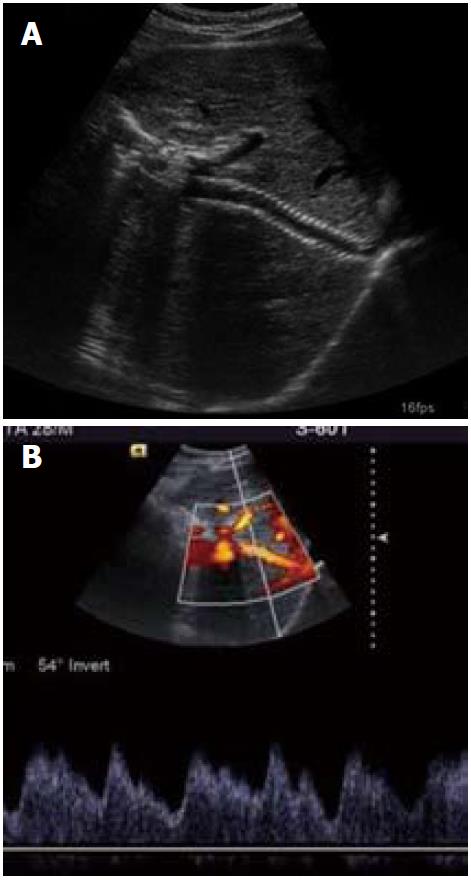
Figure 12 Follow up ultrasound and Doppler images (A, B) showing patent transjugular intrahepatic portosystemic shunt stent with normal spectral waveform.
- Citation: Mukund A, Gamanagatti S. Imaging and interventions in Budd-Chiari syndrome. World J Radiol 2011; 3(7): 169-177
- URL: https://www.wjgnet.com/1949-8470/full/v3/i7/169.htm
- DOI: https://dx.doi.org/10.4329/wjr.v3.i7.169


