Copyright
©2011 Baishideng Publishing Group Co.
World J Radiol. Oct 28, 2011; 3(10): 241-245
Published online Oct 28, 2011. doi: 10.4329/wjr.v3.i10.241
Published online Oct 28, 2011. doi: 10.4329/wjr.v3.i10.241
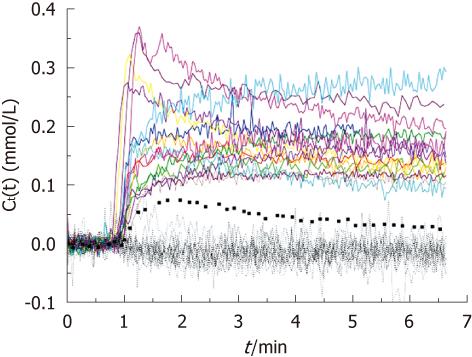
Figure 1 Contrast agent concentration vs time curves in bone metastases (colored solid lines) and normal bones (black dotted lines).
The curve from the only enhancing normal bone was highlighted by thick black dotted line. The enhancement of the normal bone was much less than the metastatic lesions.
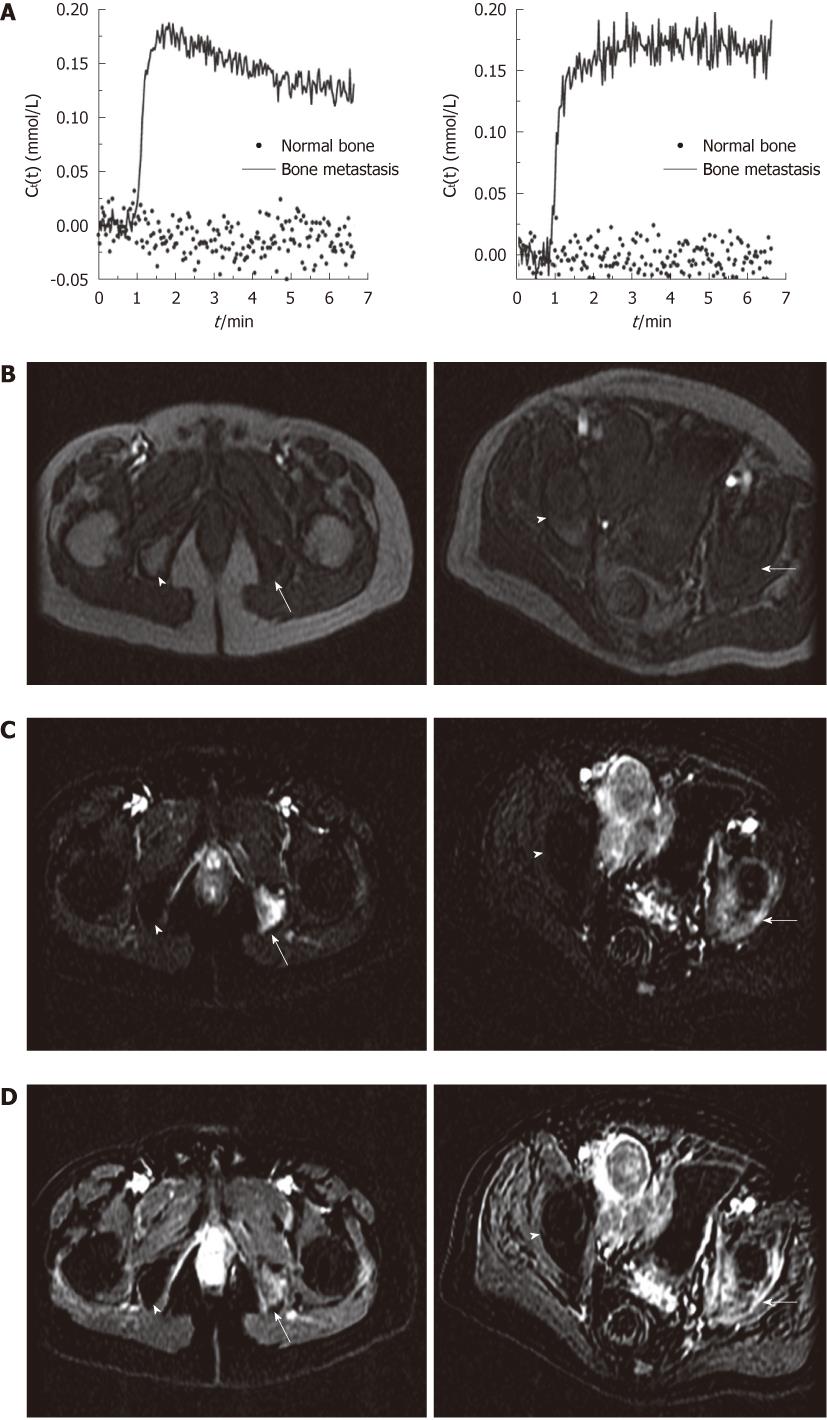
Figure 2 Pelvic bone metastasis on the left side in a patient with prostate cancer compared with normal pelvic bones on the right side.
A: Contrast agent concentration vs time curve of bone metastasis region of interest (ROI) and normal bone ROI; B: Pre-contrast image (arrow: bone metastasis, arrowhead: normal bone); C: The average subtraction image for the first minute after bolus arrival; D: The average subtraction image for the last 1 min in two representative patients (arrow:bone metastasis, arrowhead: normal bone).
- Citation: Kayhan A, Yang C, Soylu FN, Lakadamyalı H, Sethi I, Karczmar G, Stadler W, Oto A. Dynamic contrast-enhanced MR imaging findings of bone metastasis in patients with prostate cancer. World J Radiol 2011; 3(10): 241-245
- URL: https://www.wjgnet.com/1949-8470/full/v3/i10/241.htm
- DOI: https://dx.doi.org/10.4329/wjr.v3.i10.241


