Copyright
©2011 Baishideng Publishing Group Co.
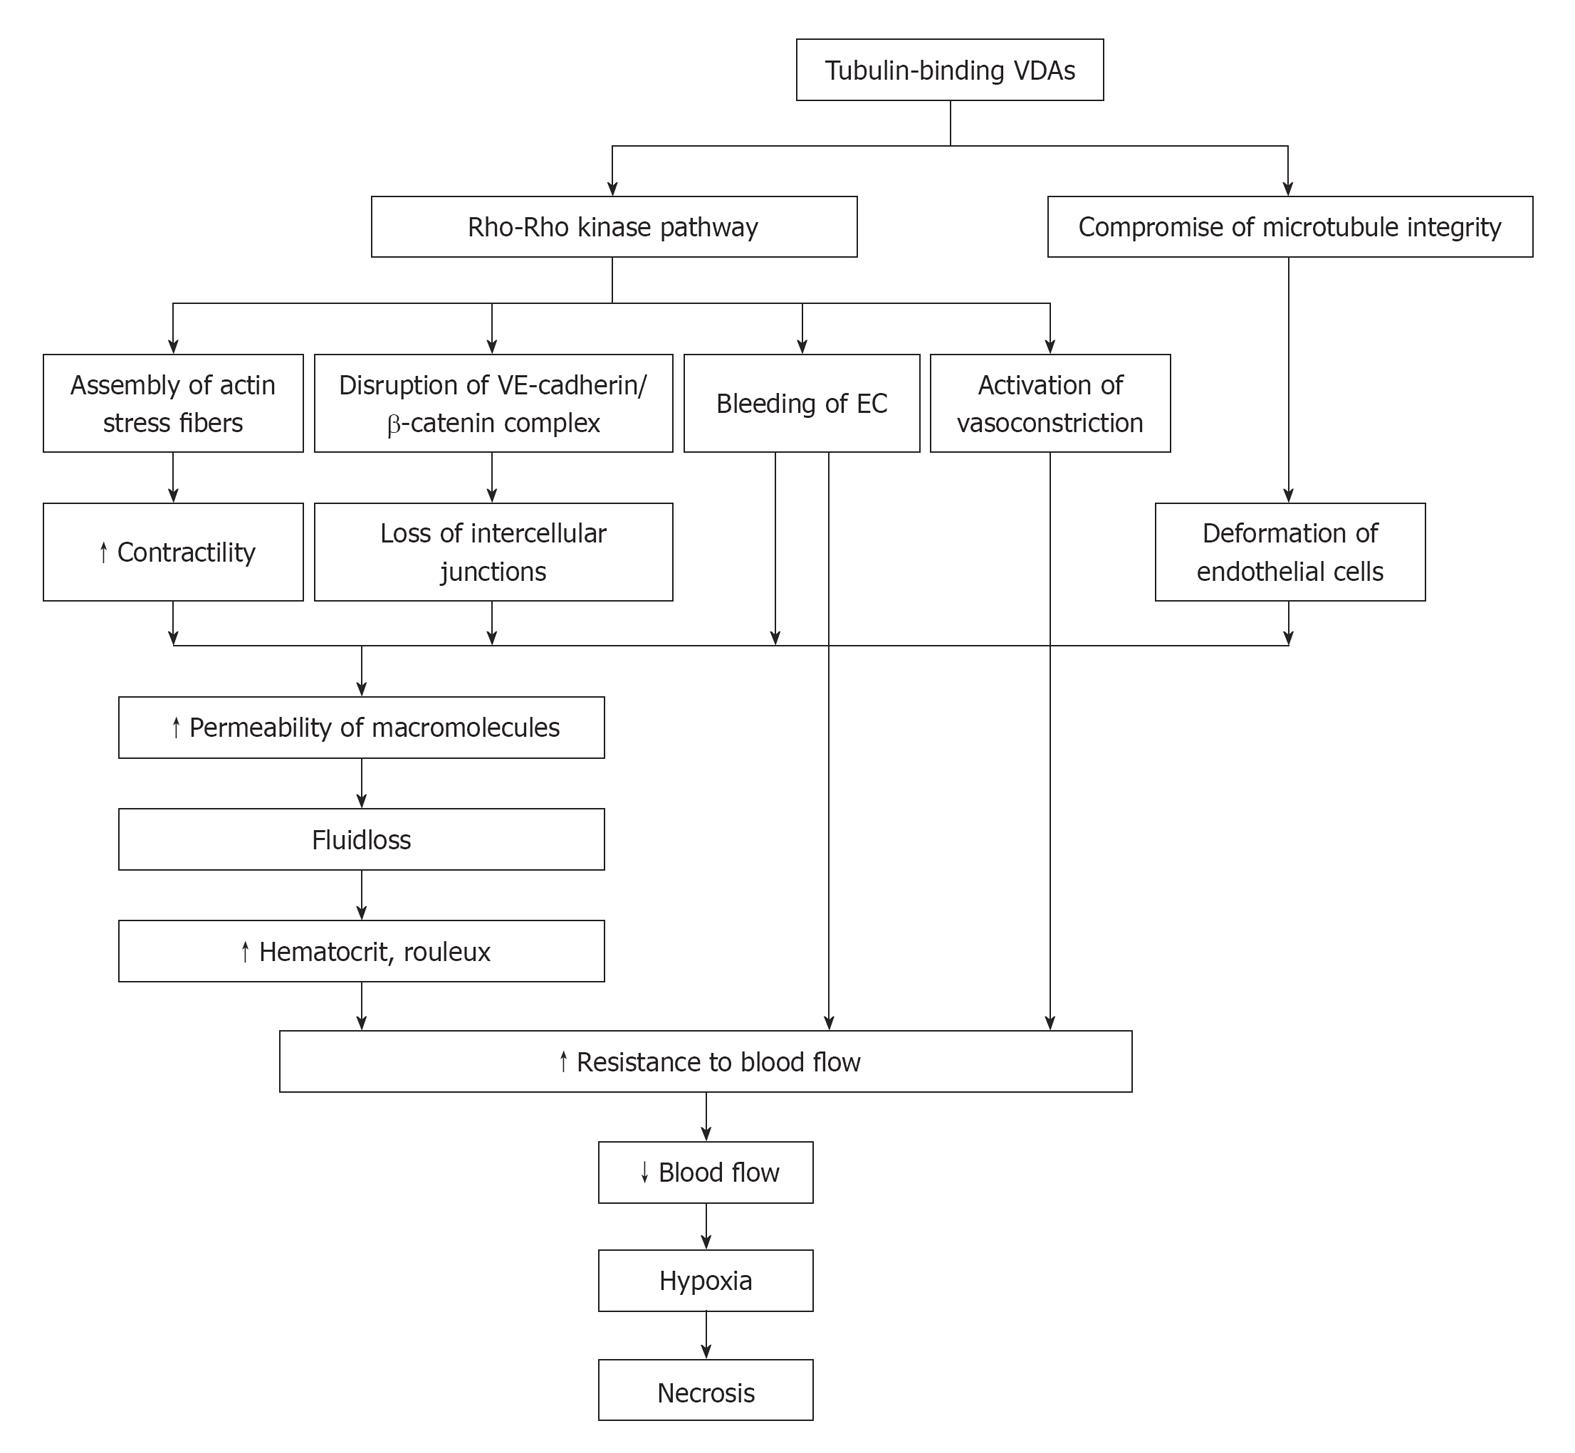
Figure 1 Schematic mechanisms of action with tubulin-binding vascular disrupting agents.
VE: Vascular endothelial; VDAs: Vascular disrupting agents; EC: Endothelial cell.
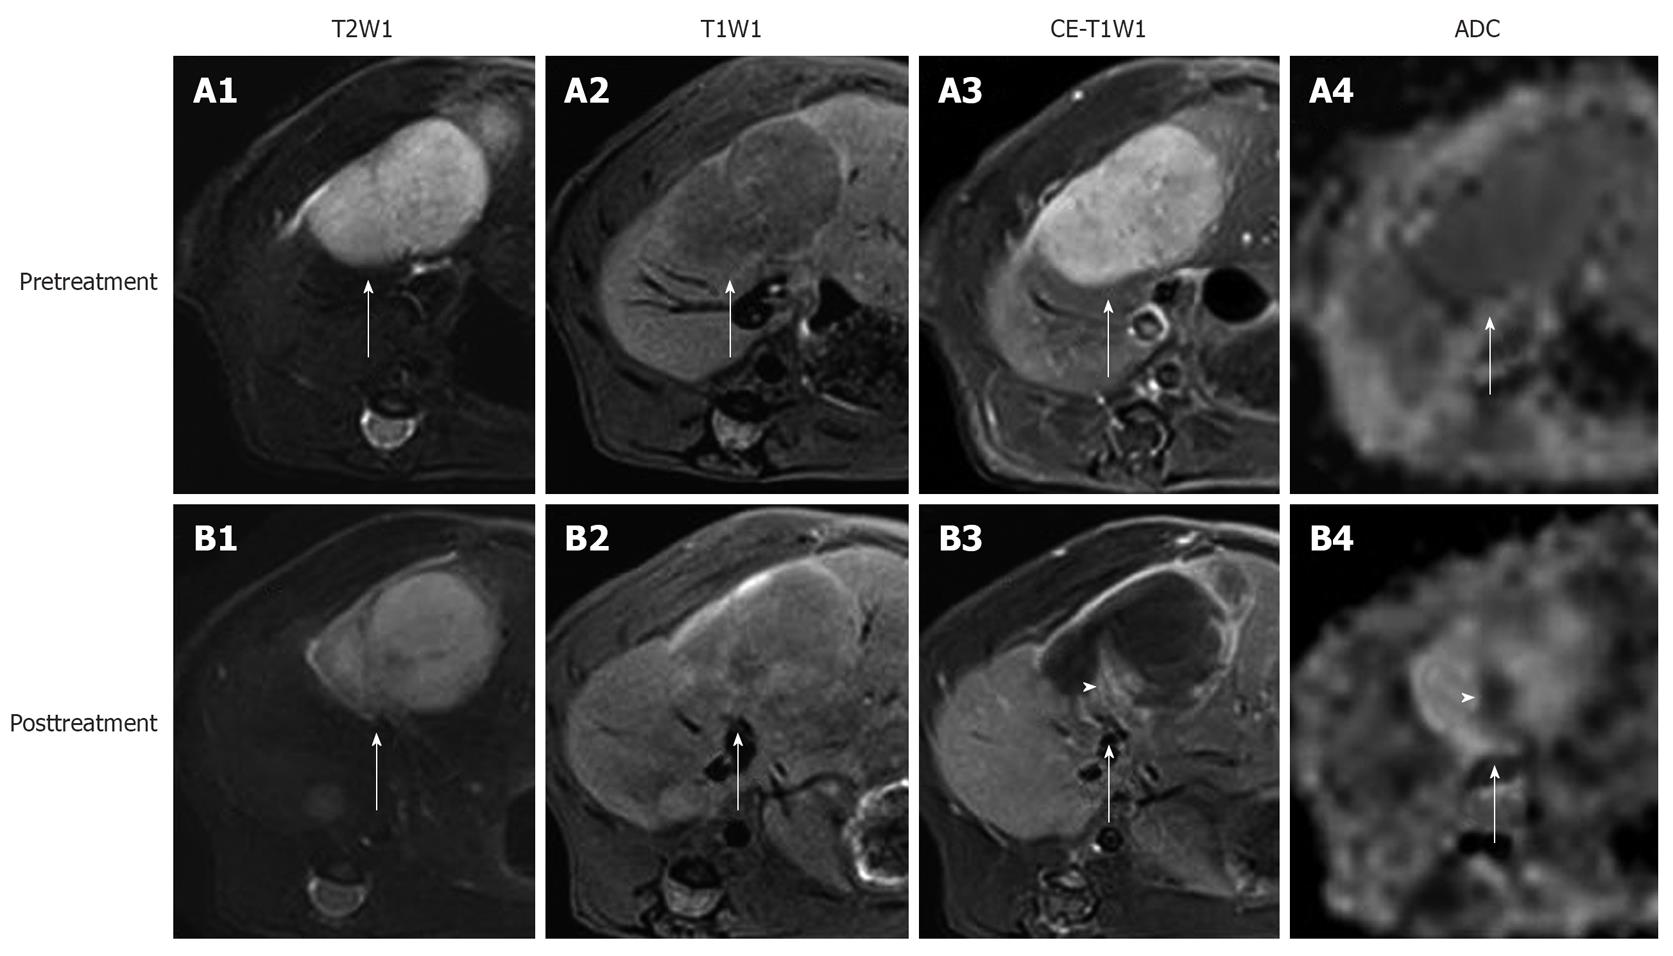
Figure 2 In vivo magnetic resonance imaging findings of an implanted tumor in rat liver.
Before treatment, the tumor (arrows) appeared hyperintense on T2WI (A1); hypointense on T1WI (A2); strongly enhanced on CE-T1WI (A3); and slightly hypointense on ADChigh (b = 500, 750, 1000 s/mm2) (A4). At 24 h after the intravenous treatment with CA4P at 10 mg/kg, obvious vascular shutdown was observed. The tumor (arrows) was still hyperintense on T2WI (B1) and hypointense on T1WI (B2). On CE-T1WI, the tumor (arrow) appeared hypointense in the center with an enhanced rim of viable neoplastic cells (B3). On ADChigh map (B4), the hyperintensity in the center corresponded to necrosis, and the isointense ring was concordant with the viable tumor rim (arrow) on CE-T1WI. Note the viable tumor nodule at the periphery, shown as hyperintensity (arrowhead) on CE-T1WI (B3), and hypointensity (arrowhead) on ADChigh (B4).
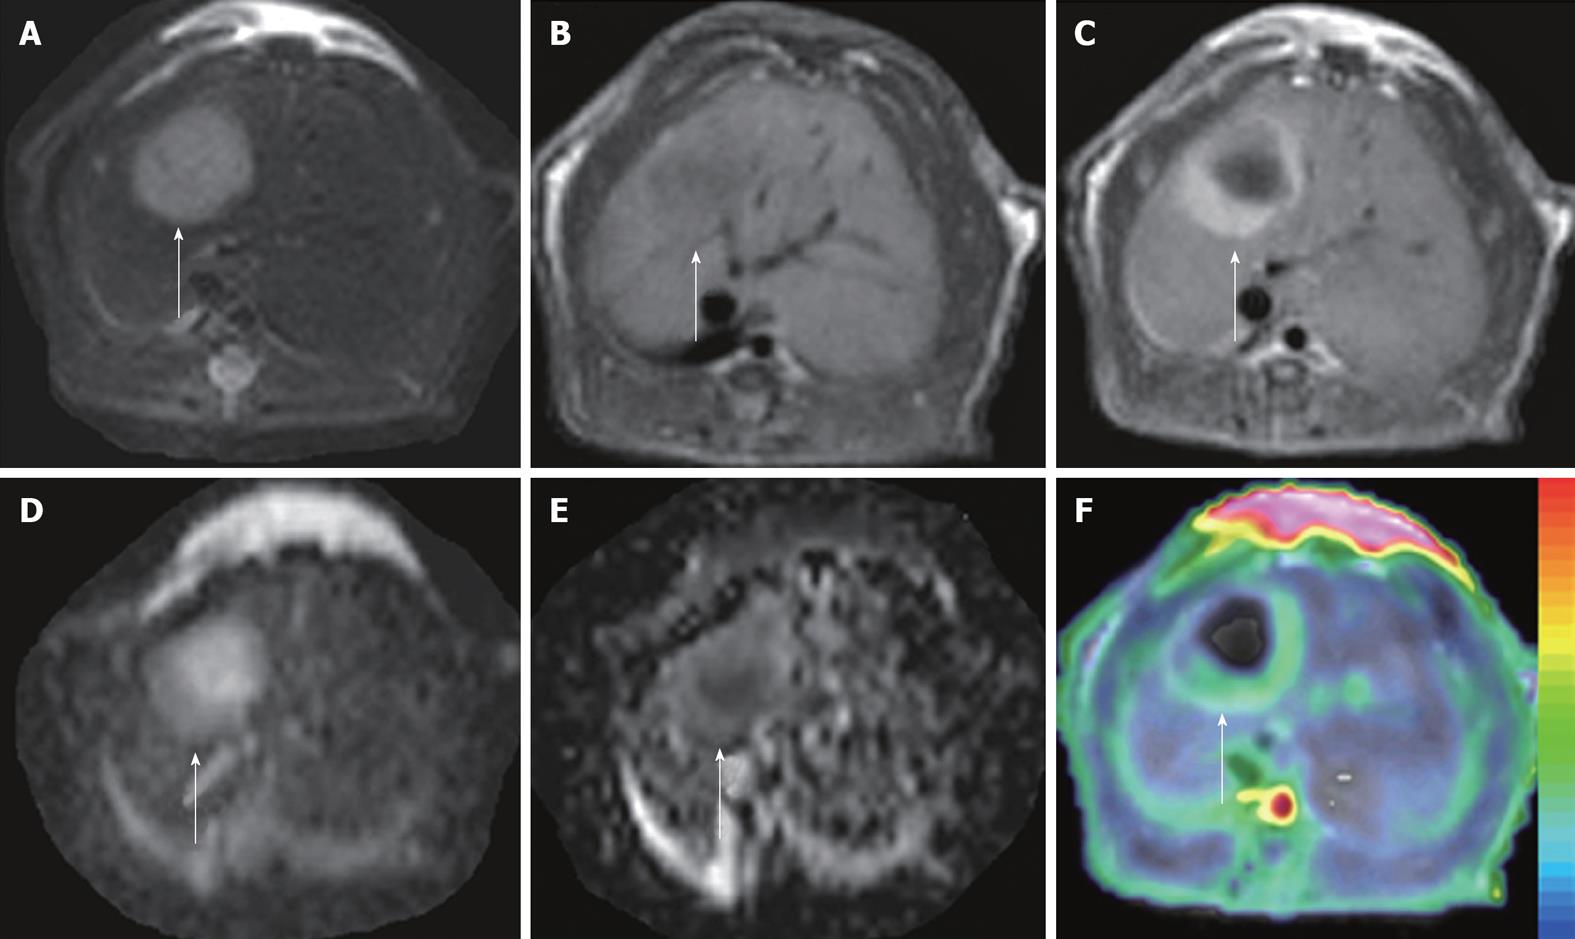
Figure 3 ADCperfusion and initial area under the gadolinium curve in an implanted tumor in rat liver.
At 48 h after iv treatment with CA4P at 10 mg/kg, obvious tumor recurrence with partial recovery of blood supply was demonstrated. The tumor (arrows) appeared hyperintense on T2WI (A) and hypointense on T1WI (B); On CE-T1WI, the tumor relapsed at the periphery, shown as ring enhancement of viable tumor cells (C); ADC10b (derived from 10 b values from 0 to 1000 s/mm2) revealed the hyperintense necrotic center and isointense viable tumor rim (D); On ADCperfusion (ADClow-ADChigh) maps, the relative hyperintensity at the periphery suggested the partial recovery of perfusion, compared to the hypointensity in the necrotic center with perfusion deficit (E); ADCperfusion matched well with CE-T1WI-overlyaed initial area under the gadolinium curve (IAUGC) map (F).
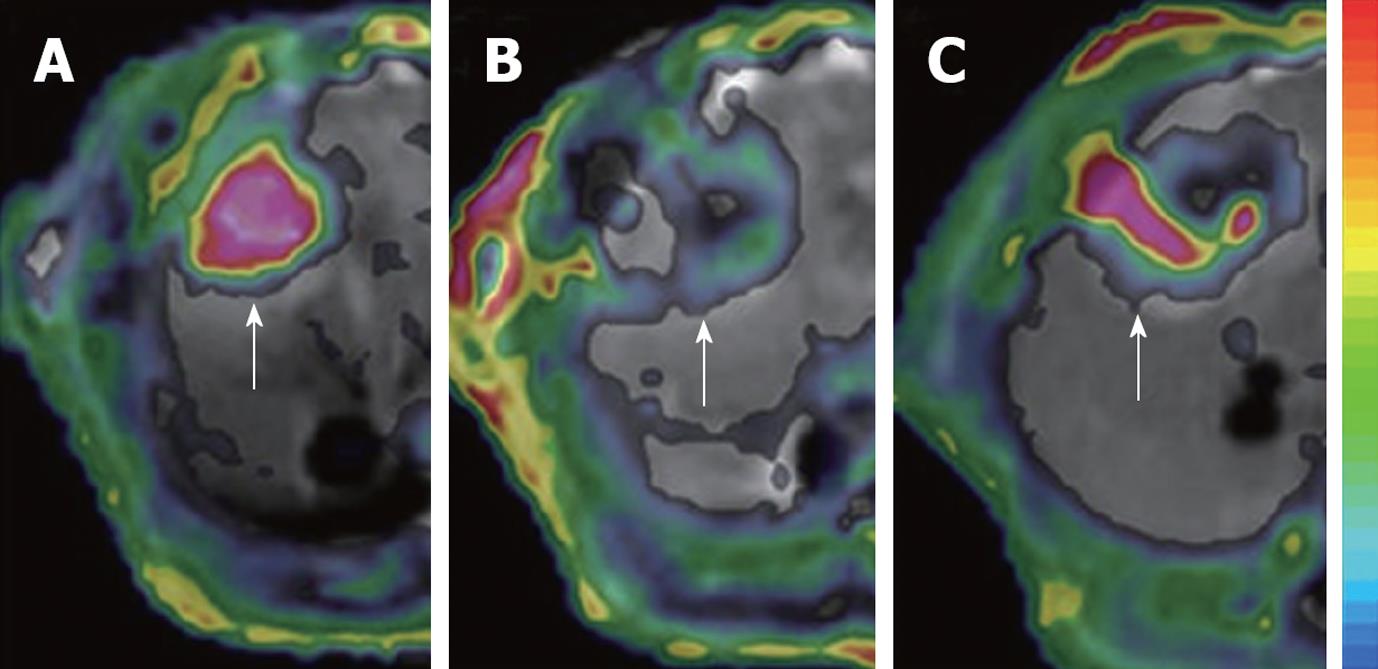
Figure 4 Dynamic changes in Ktrans.
The tumor (arrows) in rat liver showed an abundant blood supply with high Ktrans before treatment (A); At 6 h after CA4P treatment, vascular shutdown was indicated with low Ktrans in the center, surrounded by tumor residue at the periphery, with moderate Ktrans (B); At 48 h after treatment, the tumor relapsed upon the residue at the periphery with rebounding Ktrans (C).
- Citation: Wang H, Marchal G, Ni Y. Multiparametric MRI biomarkers for measuring vascular disrupting effect on cancer. World J Radiol 2011; 3(1): 1-16
- URL: https://www.wjgnet.com/1949-8470/full/v3/i1/1.htm
- DOI: https://dx.doi.org/10.4329/wjr.v3.i1.1


