Copyright
©2010 Baishideng Publishing Group Co.
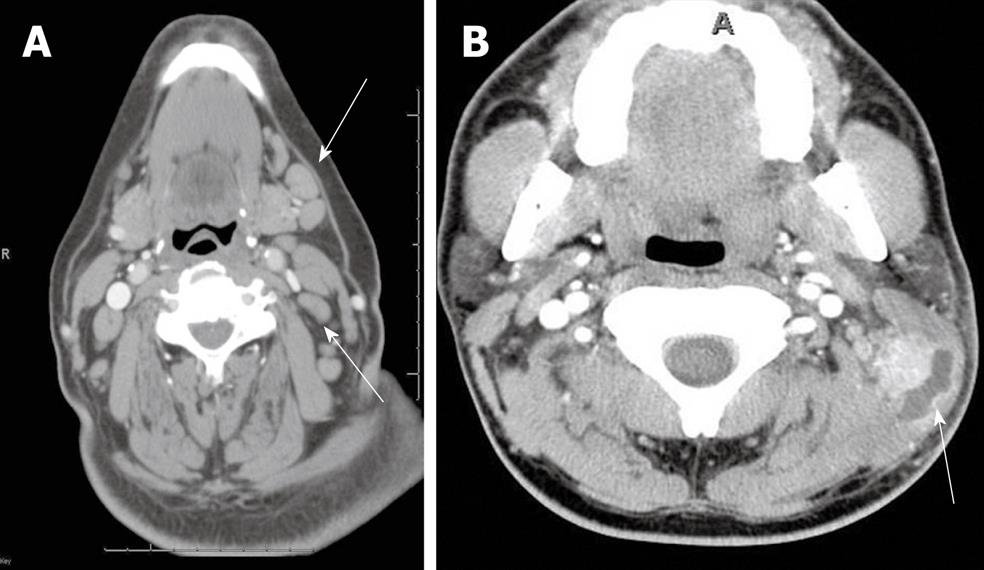
Figure 1 Cervical and suppurative adenitis.
A: Axial contrast-enhanced computed tomography (CT) shows homogenous enlargement of multiple enlarged to borderline sized lymph nodes (arrows), in a patient with neck pain consistent with cervical adenitis; B: Axial contrast-enhanced CT shows a suppurative cervical lymph node (arrow) with surrounding soft tissue edema.
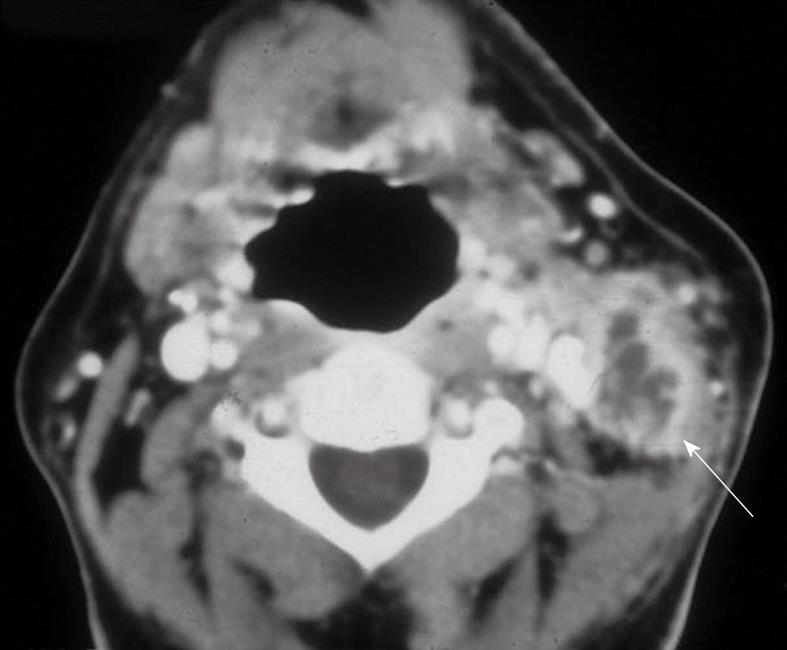
Figure 2 Tuberculous lymphadenitis.
Axial contrast enhanced CT shows a necrotic suppurative lymph node in a patient with tuberculosis (arrow).
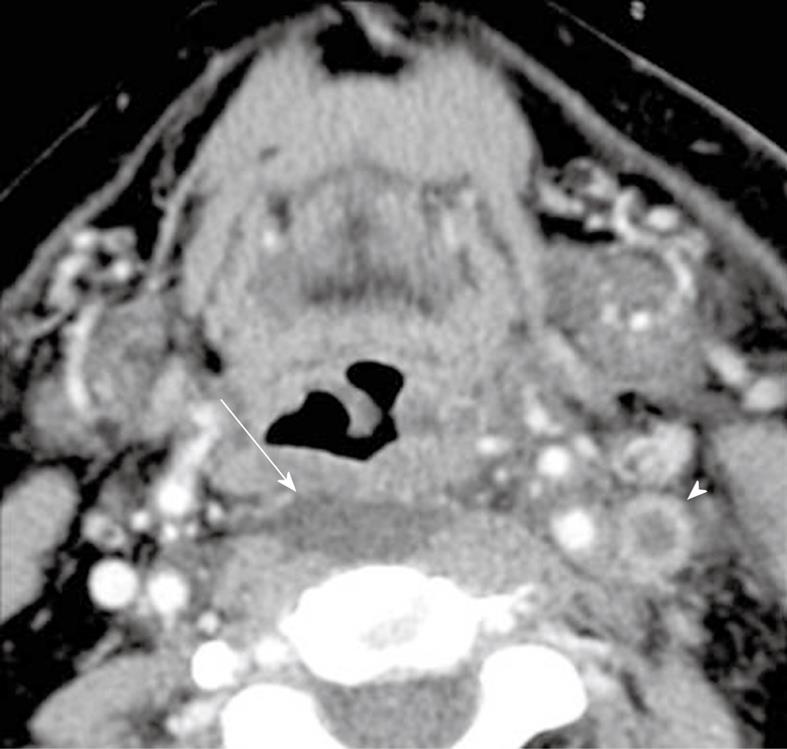
Figure 3 Retropharyngeal space edema.
There is symmetric low attenuation in the retropharyngeal space (arrow). There is associated left jugular vein thrombosis (arrowhead).
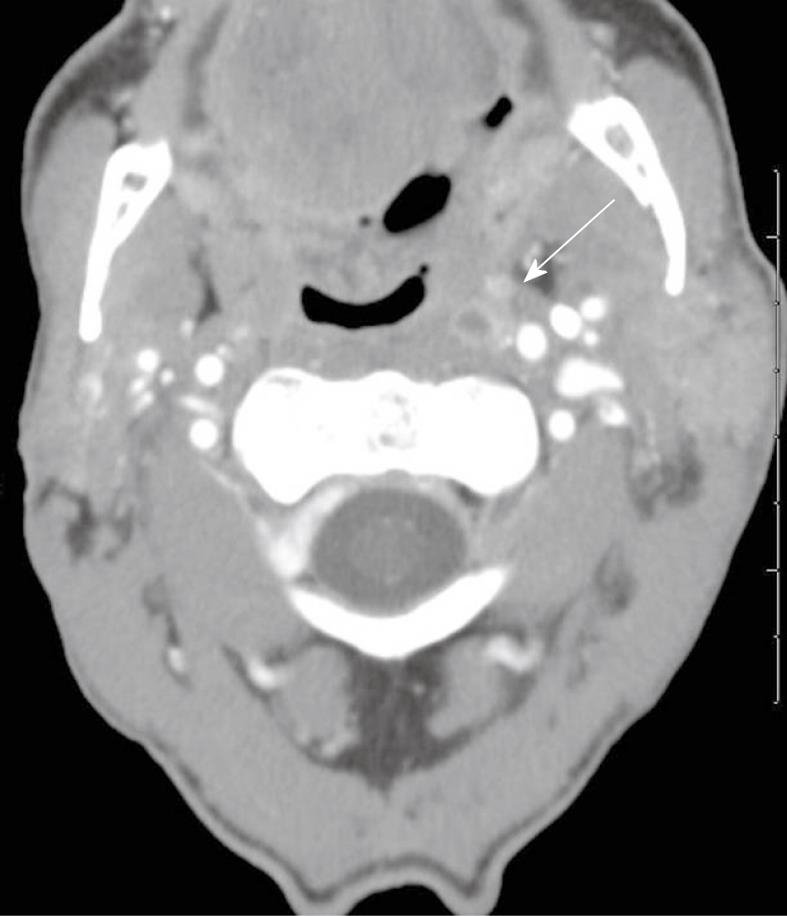
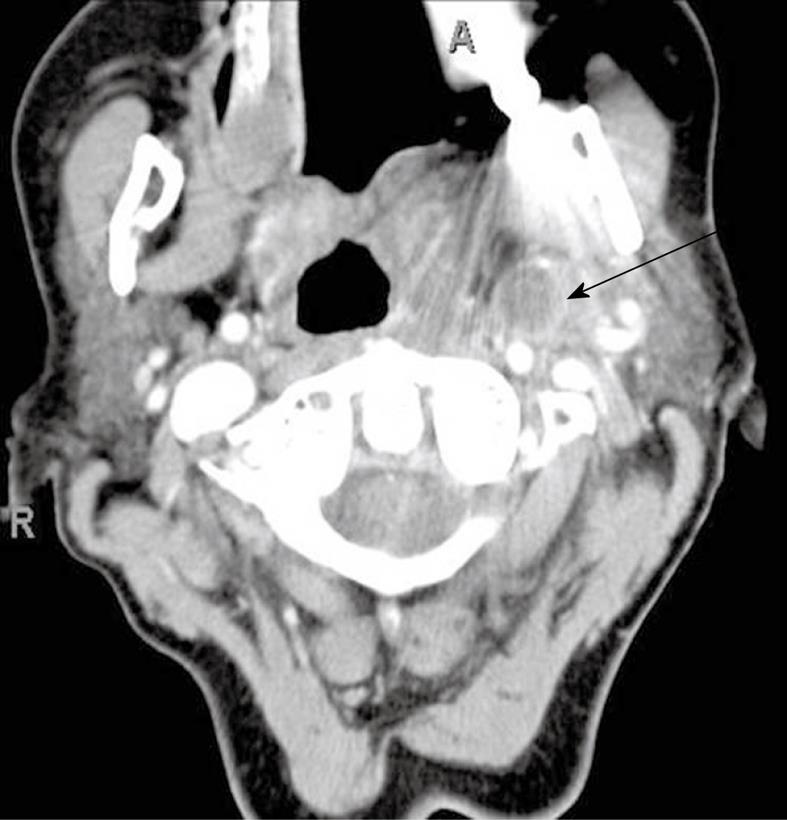
Figure 4 Suppurative adenitis of the left retropharyngeal lymph (arrow).
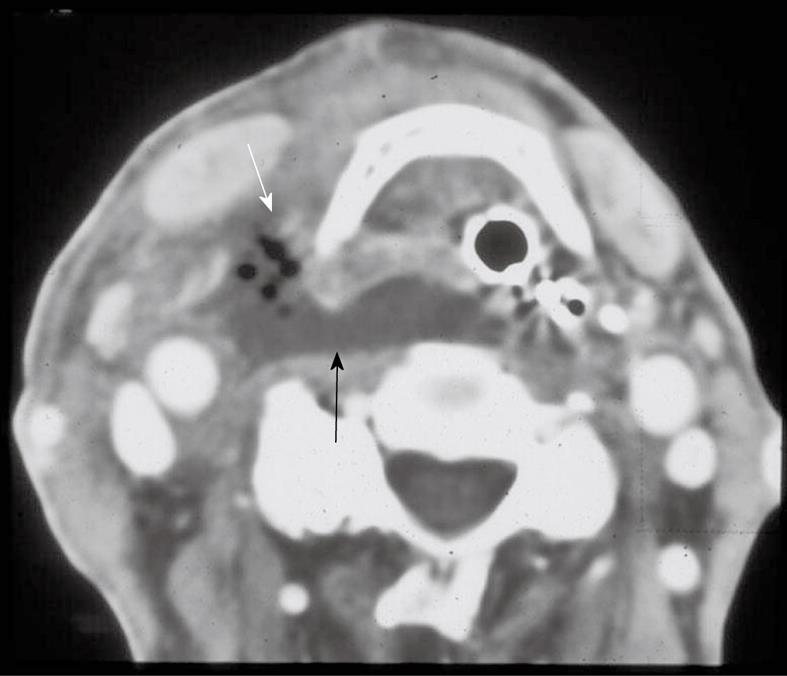
Figure 5 Retropharyngeal space abscess.
Contrast-enhanced CT shows fluid (black arrow) and gas (white arrow) in the retropharyngeal space.
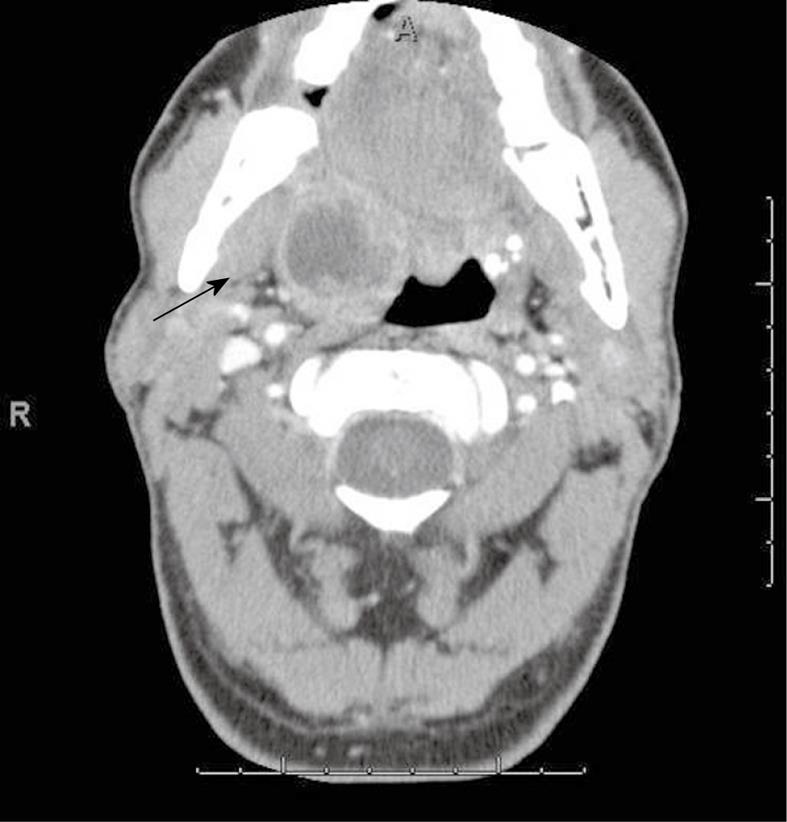
Figure 6 Tonsillar abscess.
Contrast-enhanced axial CT demonstrates an abscess involving the right tonsil (arrow).
Figure 7 Parapharyngeal space abscess.
Contrast-enhanced CT shows a low attenuation fluid collection with peripheral enhancement in the left parapharyngeal space (arrow).
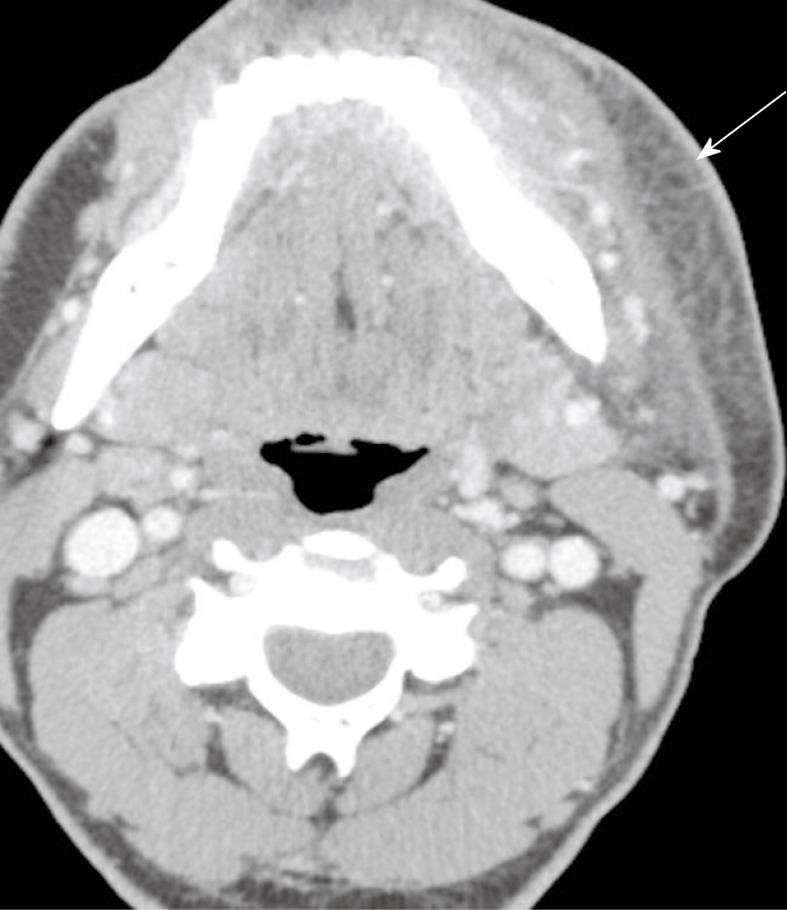
Figure 8 Cervical cellulitis.
Contrast-enhanced CT scan shows diffuse reticulation of subcutaneous fat with thickening and enhancement of the platysma (arrow).
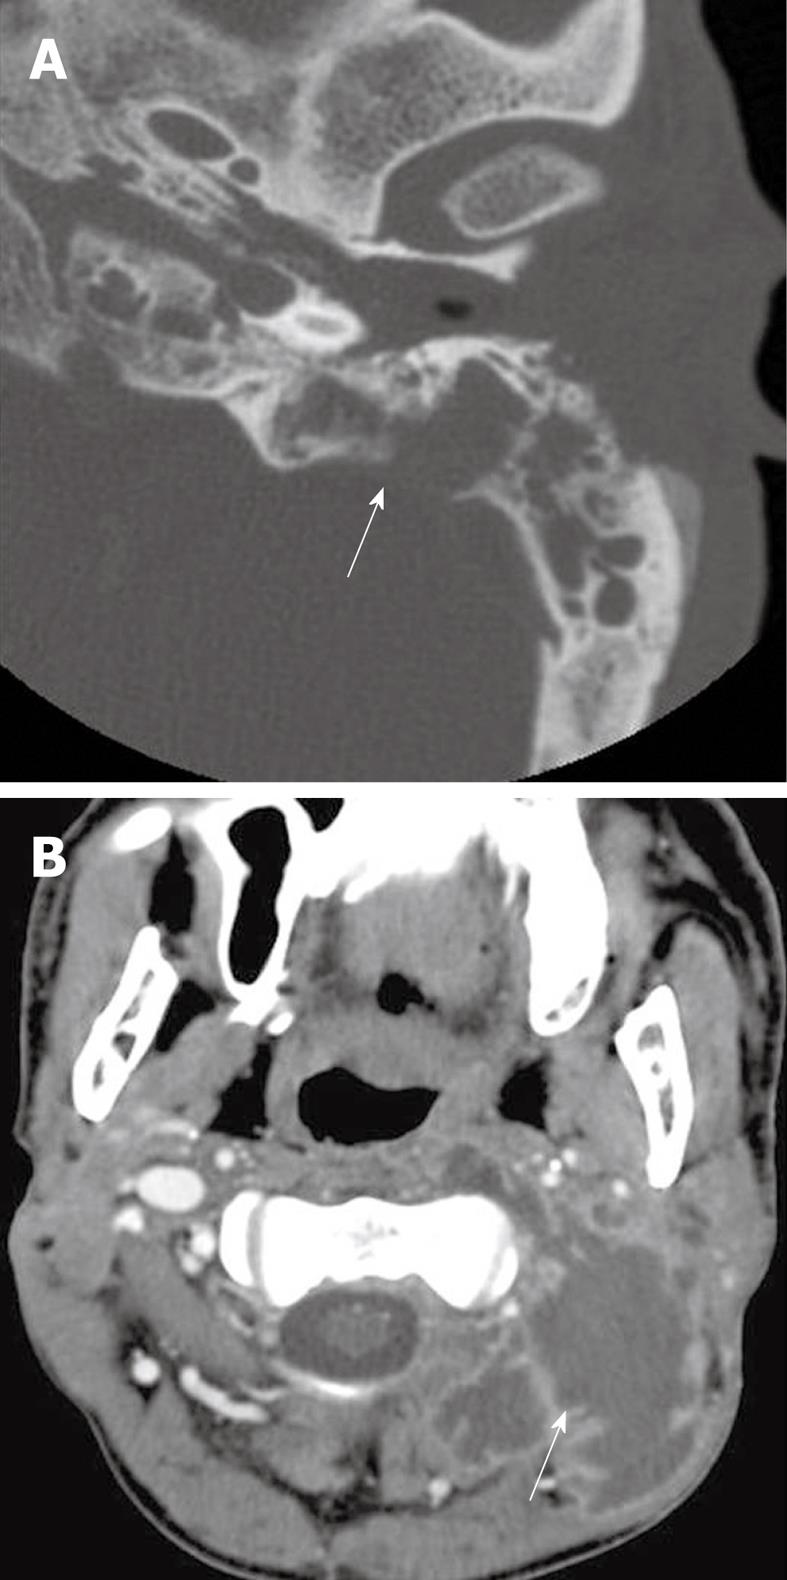
Figure 9 Bezold abscess.
A: Axial contrast-enhanced CT shows opacification of the mastoid air cells with associated bone erosion indicating an aggressive inflammatory process (arrow); B: The soft tissue algorithm demonstrates a multiloculated abscess involving the paraspinal musculature (arrow).
Figure 10 Floor of mouth abscess after dental extraction.
A: The bone algorithm shows focal cortical erosion in the region of the right 2nd molar, after the tooth extraction (arrow); B: Axial contrast-enhanced CT shows abscess extending into the right sublingual space (arrow).
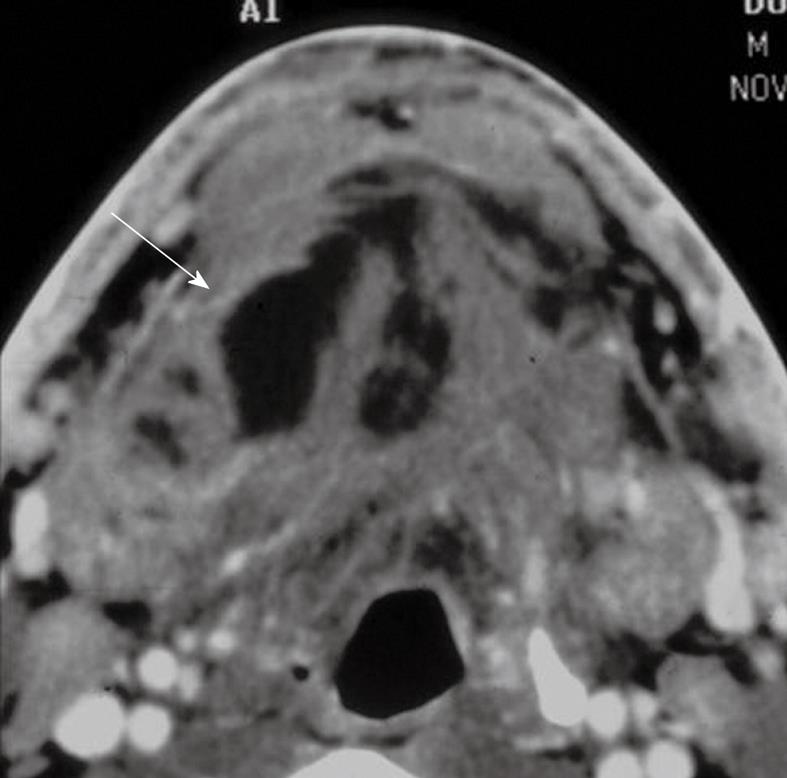
Figure 11 Ludwig’s angina.
Contrast enhanced CT shows multiple abscess (arrow) in the sublingual space.
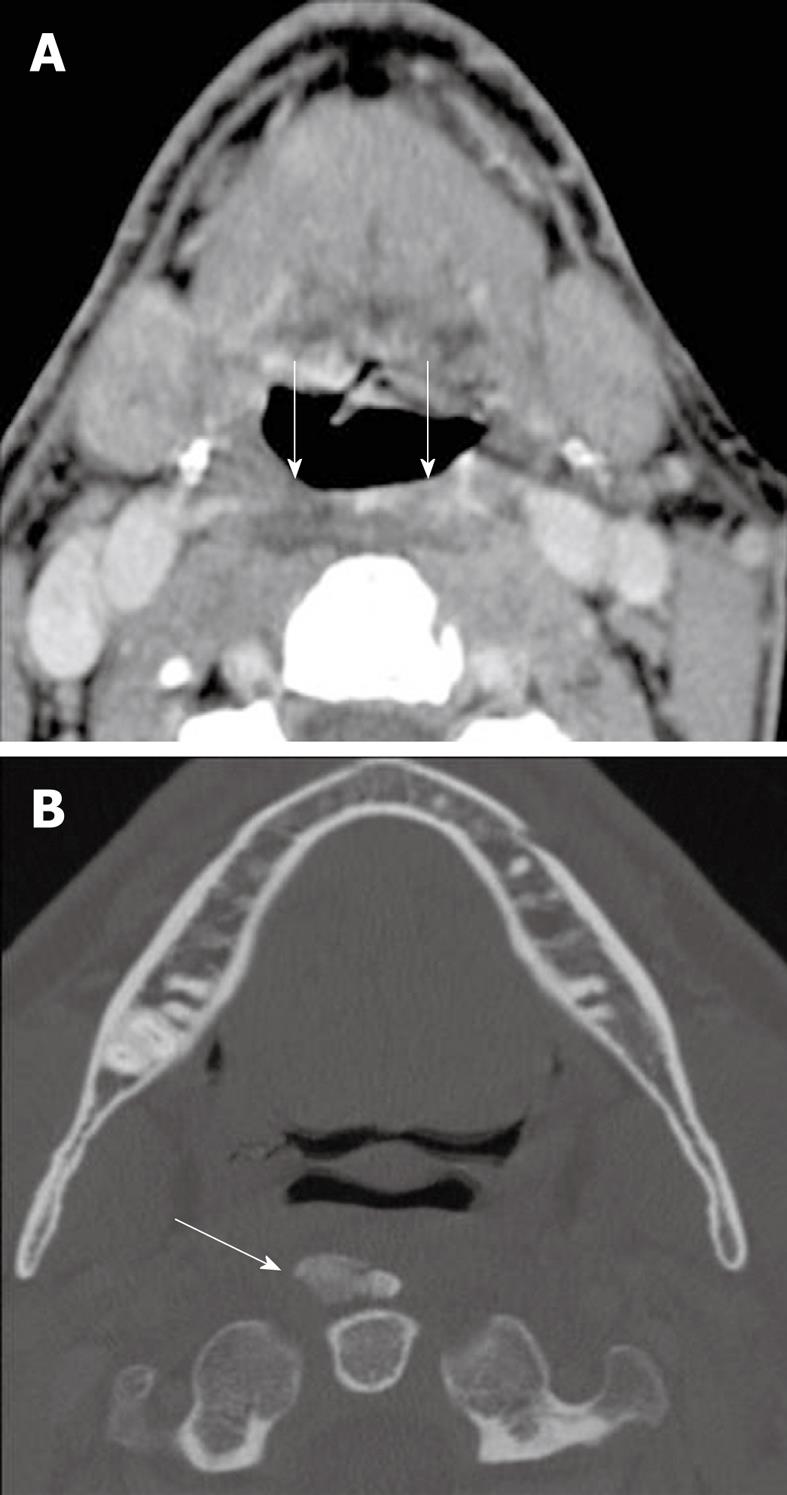
Figure 12 Calcific tendinitis.
A: Axial contrast enhanced CT of the neck demonstrates retropharyngeal space edema (arrows); B: The bone algorithm shows an ossific mass anterior to the dens confirming that the edema in the retropharyngeal space is due to calcific tendinitis (arrow).
- Citation: Bou-Assaly W, Mckellop J, Mukherji S. Computed tomography imaging of acute neck inflammatory processes. World J Radiol 2010; 2(3): 91-96
- URL: https://www.wjgnet.com/1949-8470/full/v2/i3/91.htm
- DOI: https://dx.doi.org/10.4329/wjr.v2.i3.91


