Copyright
©2010 Baishideng Publishing Group Co.
World J Radiol. Oct 28, 2010; 2(10): 405-409
Published online Oct 28, 2010. doi: 10.4329/wjr.v2.i10.405
Published online Oct 28, 2010. doi: 10.4329/wjr.v2.i10.405
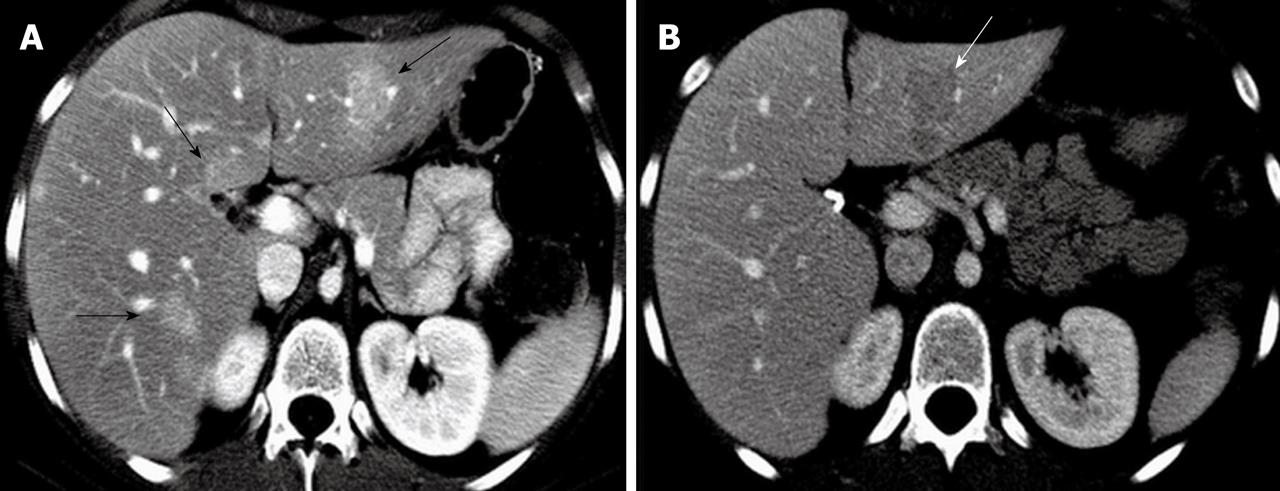
Figure 1 Arterial phase axial computed tomography showing enhanced focal nodular hyperplasia lesions in both liver lobes with the largest focal nodular hyperplasia lesion located in the lateral segment of the left liver lobe (arrows) (A) and portal venous phase axial computed tomography at 1 year follow-up demonstrating a hypodense focal nodular hyperplasia lesion in the left liver lobe with its size increased (arrow) (B).
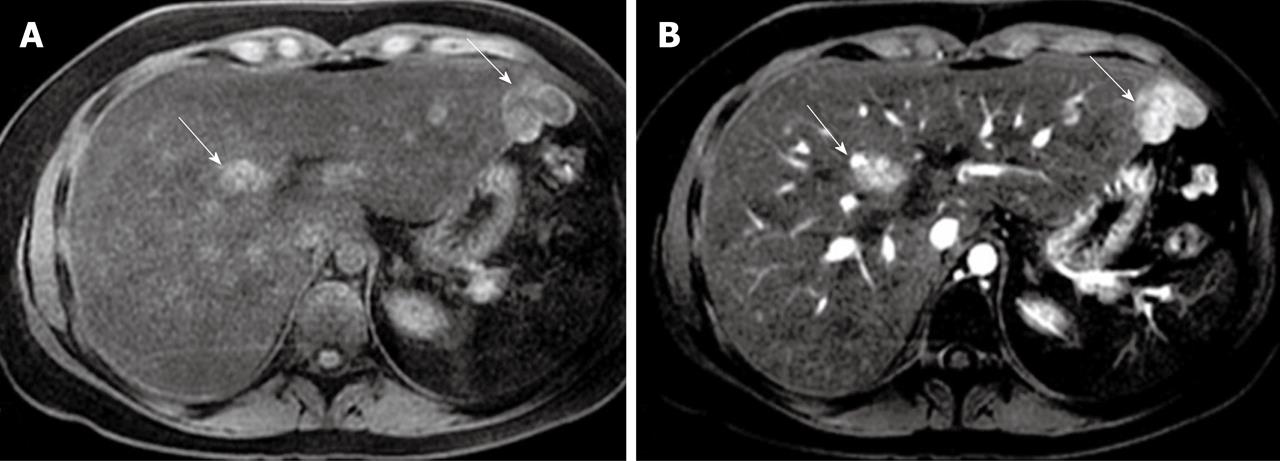
Figure 2 Axial pre-contrast T1-weighted magnetic resonance imaging demonstrating focal nodular hyperplasia lesions with an increased intensity (arrows) (A) and enhanced focal nodular hyperplasia lesions at the arterial phase (arrows) (B).
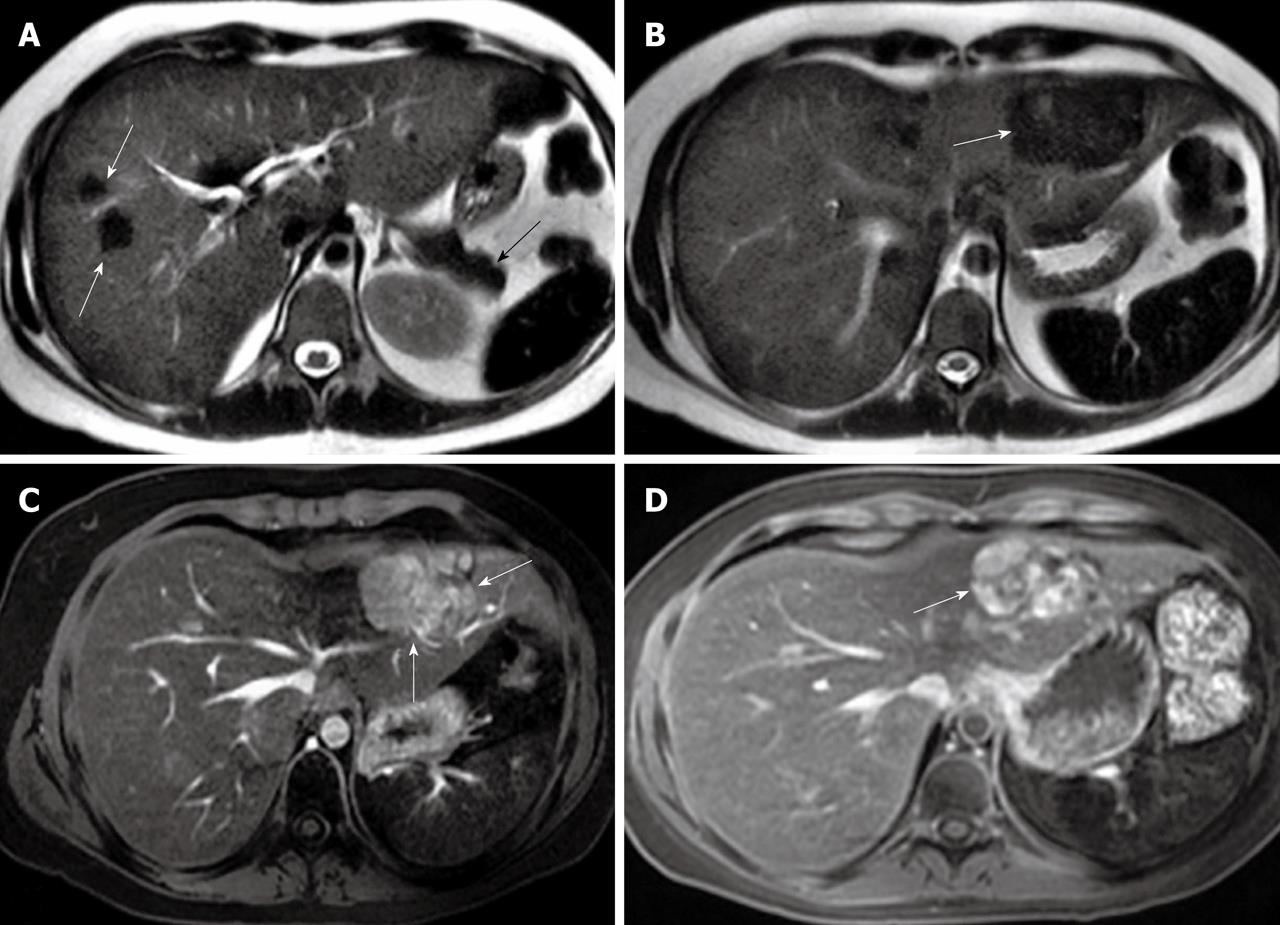
Figure 3 Axial T2-weighted magnetic resonance imaging showing hypointense focal nodular hyperplasia lesions in the right liver lobe (white arrows) with a diffusely decreased signal intensity of the liver and spleen as well as pancreas (black arrow) (A) and central hyperintense focal nodular hyperplasia lesions in the left liver lobe (arrow) (B), while Eovist-enhanced axial magnetic resonance imaging demonstrating enlarged focal nodular hyperplasia lesions in the left liver lobe in the arterial phase (arrows) (C) and hyperintense focal nodular hyperplasia lesions in the left liver lobe in the delayed phase (arrow) (D).
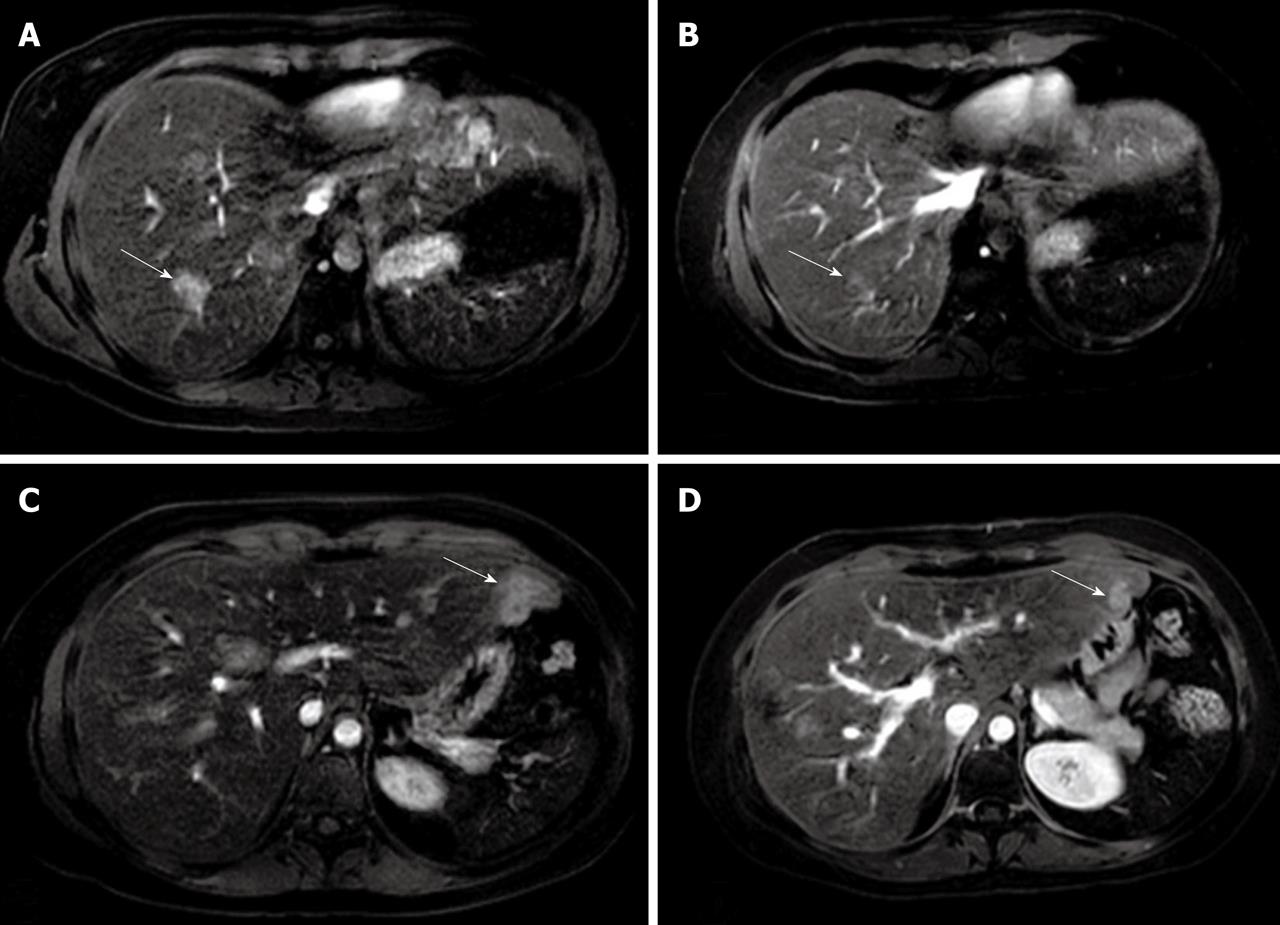
Figure 4 Eovist-enhanced axial magnetic resonance imaging demonstrating enhanced focal nodular hyperplasia lesions in the right liver lobe in arterial phase before treatment (arrow) (A), control magnetic resonance imaging 6 months later showing significantly decreased size of focal nodular hyperplasia lesions (arrow) (B), enhanced focal nodular hyperplasia lesions in the left liver lobe in the arterial phase before treatment (arrow) (C), and significantly decreased size of lesions in the left liver lobe at 6 month follow-up (arrow) (D).
- Citation: Kayhan A, Venu N, Lakadamyalı H, Jensen D, Oto A. Multiple progressive focal nodular hyperplasia lesions of liver in a patient with hemosiderosis. World J Radiol 2010; 2(10): 405-409
- URL: https://www.wjgnet.com/1949-8470/full/v2/i10/405.htm
- DOI: https://dx.doi.org/10.4329/wjr.v2.i10.405


