Copyright
©The Author(s) 2025.
World J Radiol. Apr 28, 2025; 17(4): 101636
Published online Apr 28, 2025. doi: 10.4329/wjr.v17.i4.101636
Published online Apr 28, 2025. doi: 10.4329/wjr.v17.i4.101636
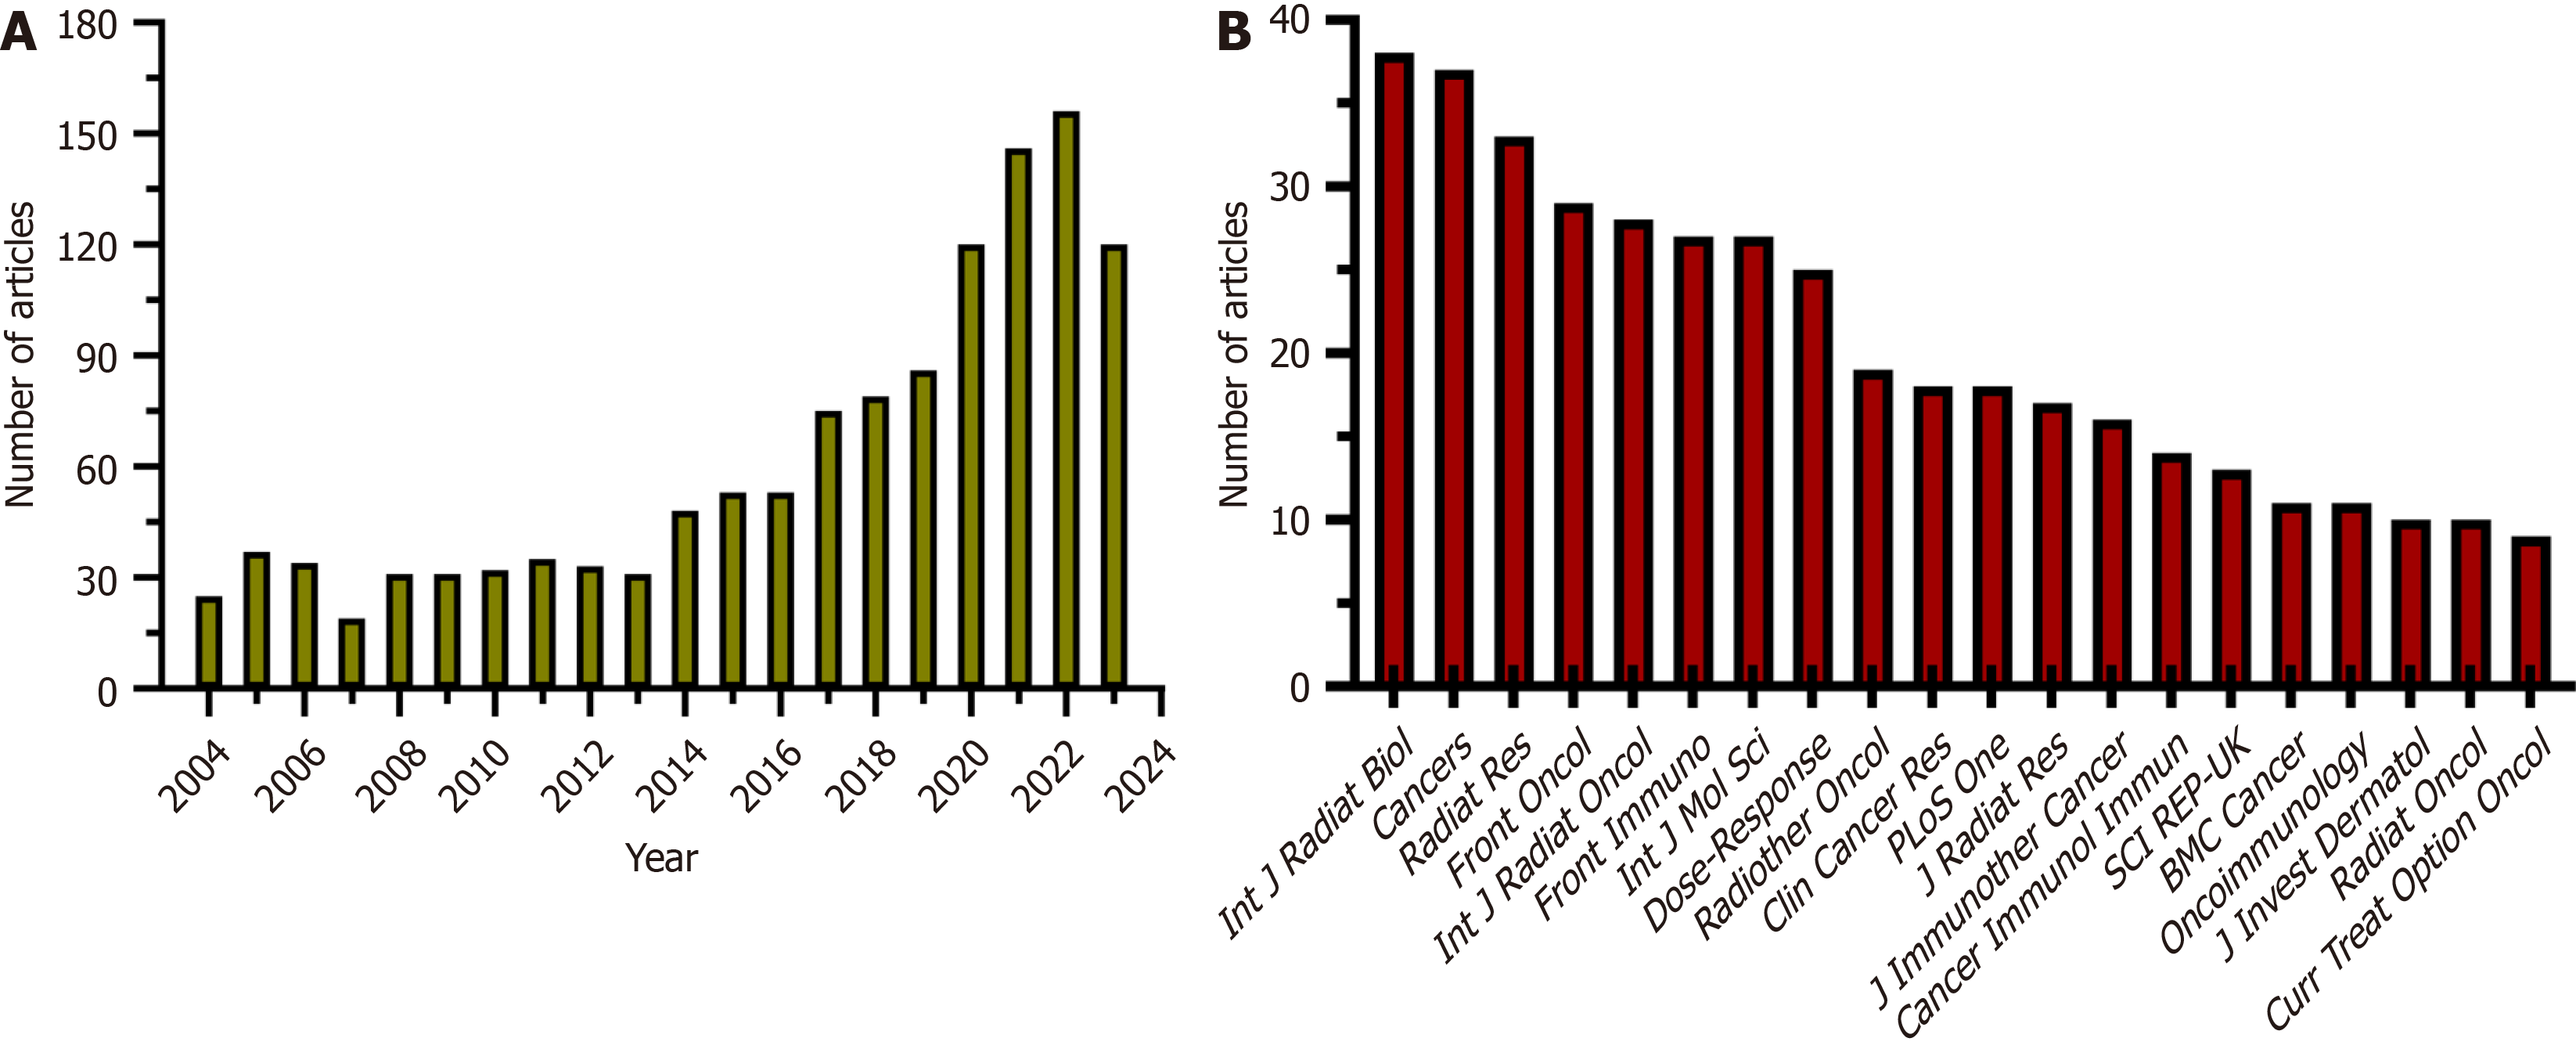
Figure 1 Distribution of publications.
A: The annual distribution of publications; B: The number of articles from the top 20 journals.
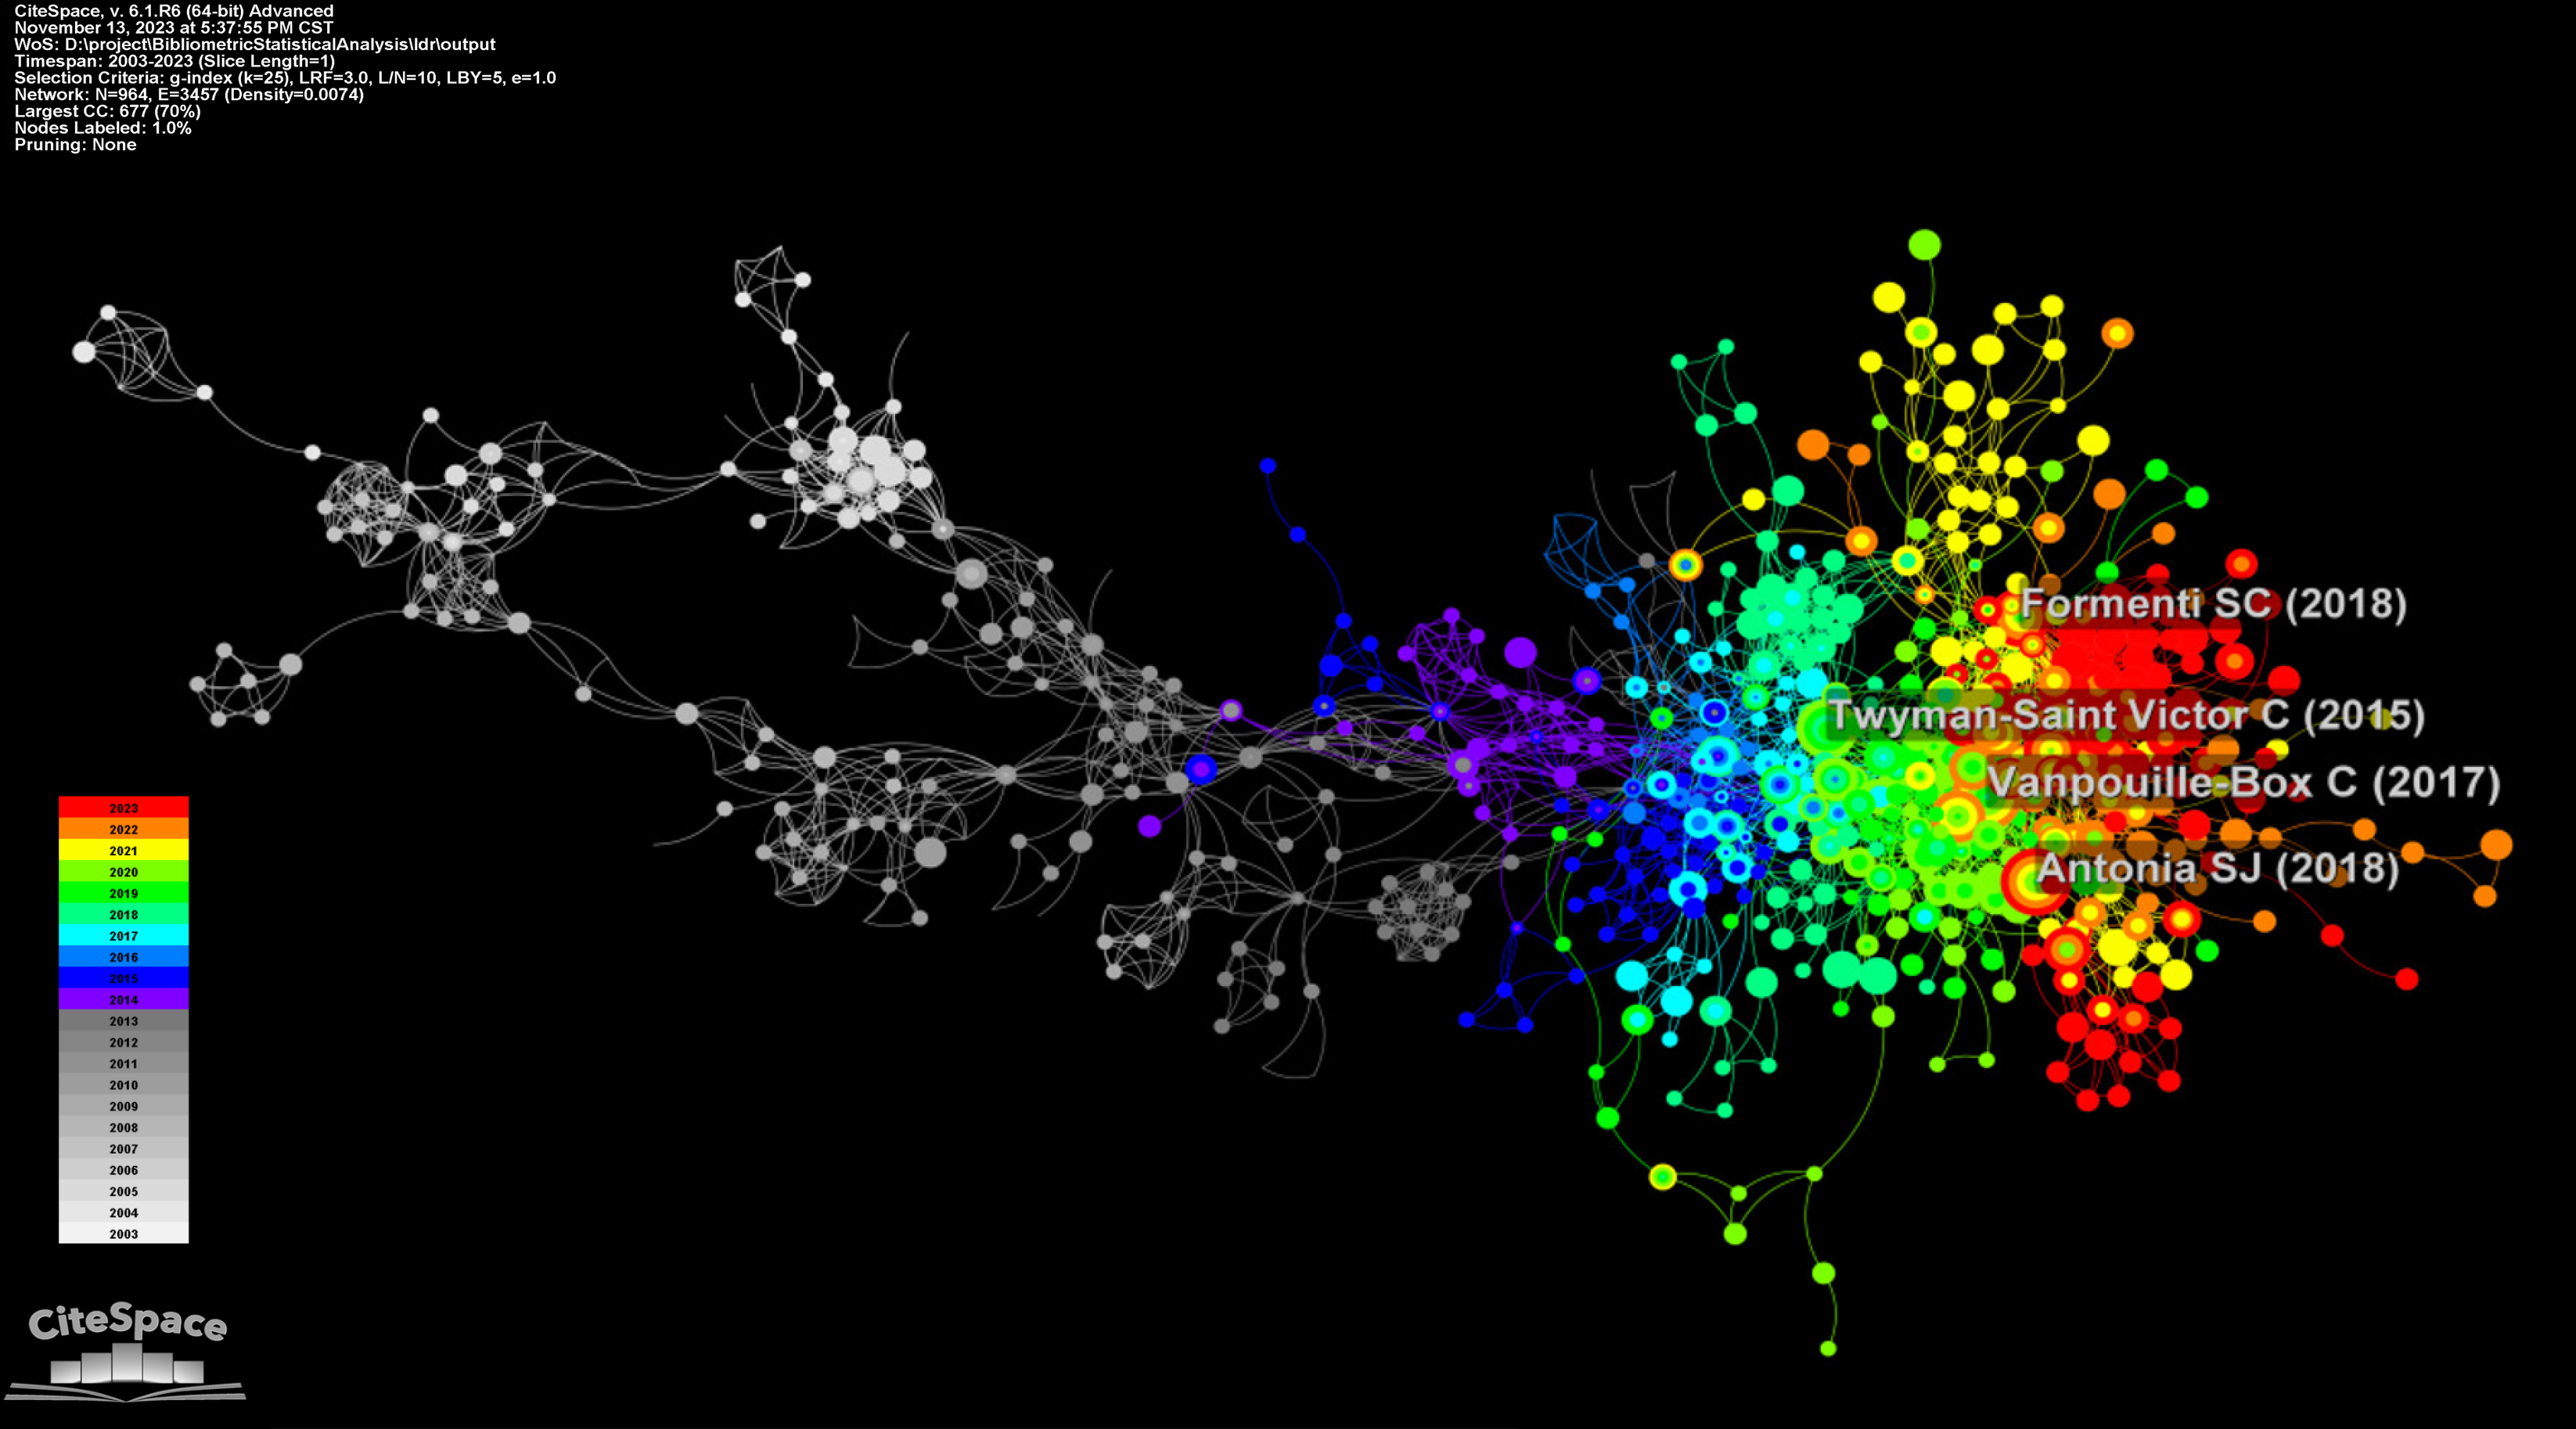
Figure 2 Citation co-occurrence network.
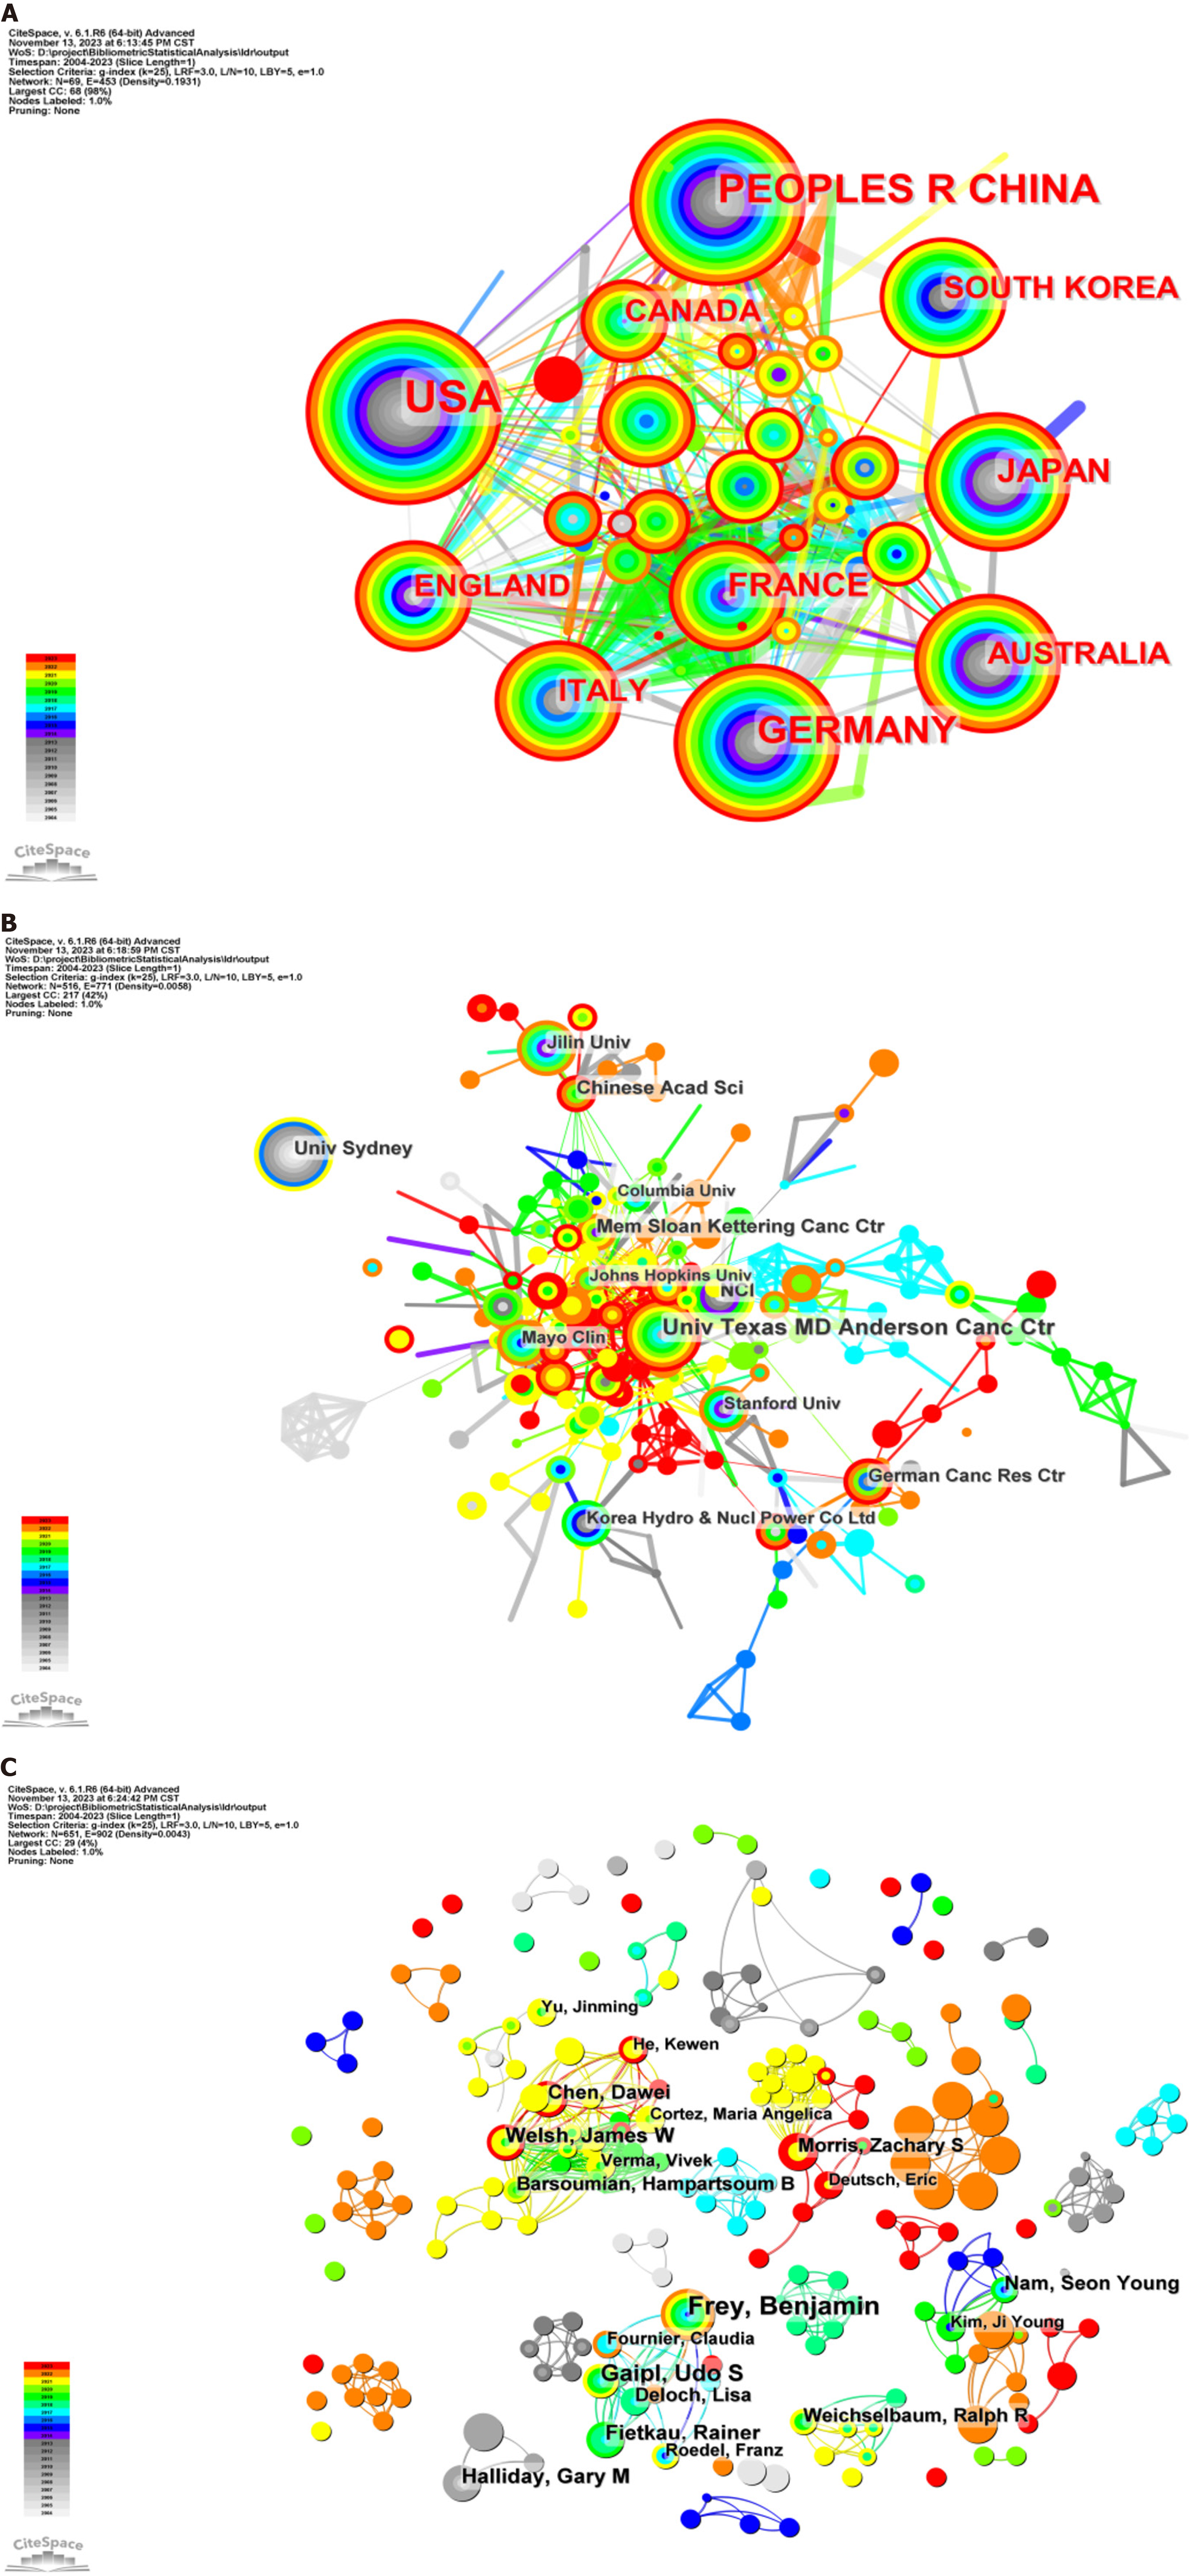
Figure 3 The scientific cooperation networks.
A: Country collaboration; B: Institutional collaboration; C: Author collaboration.
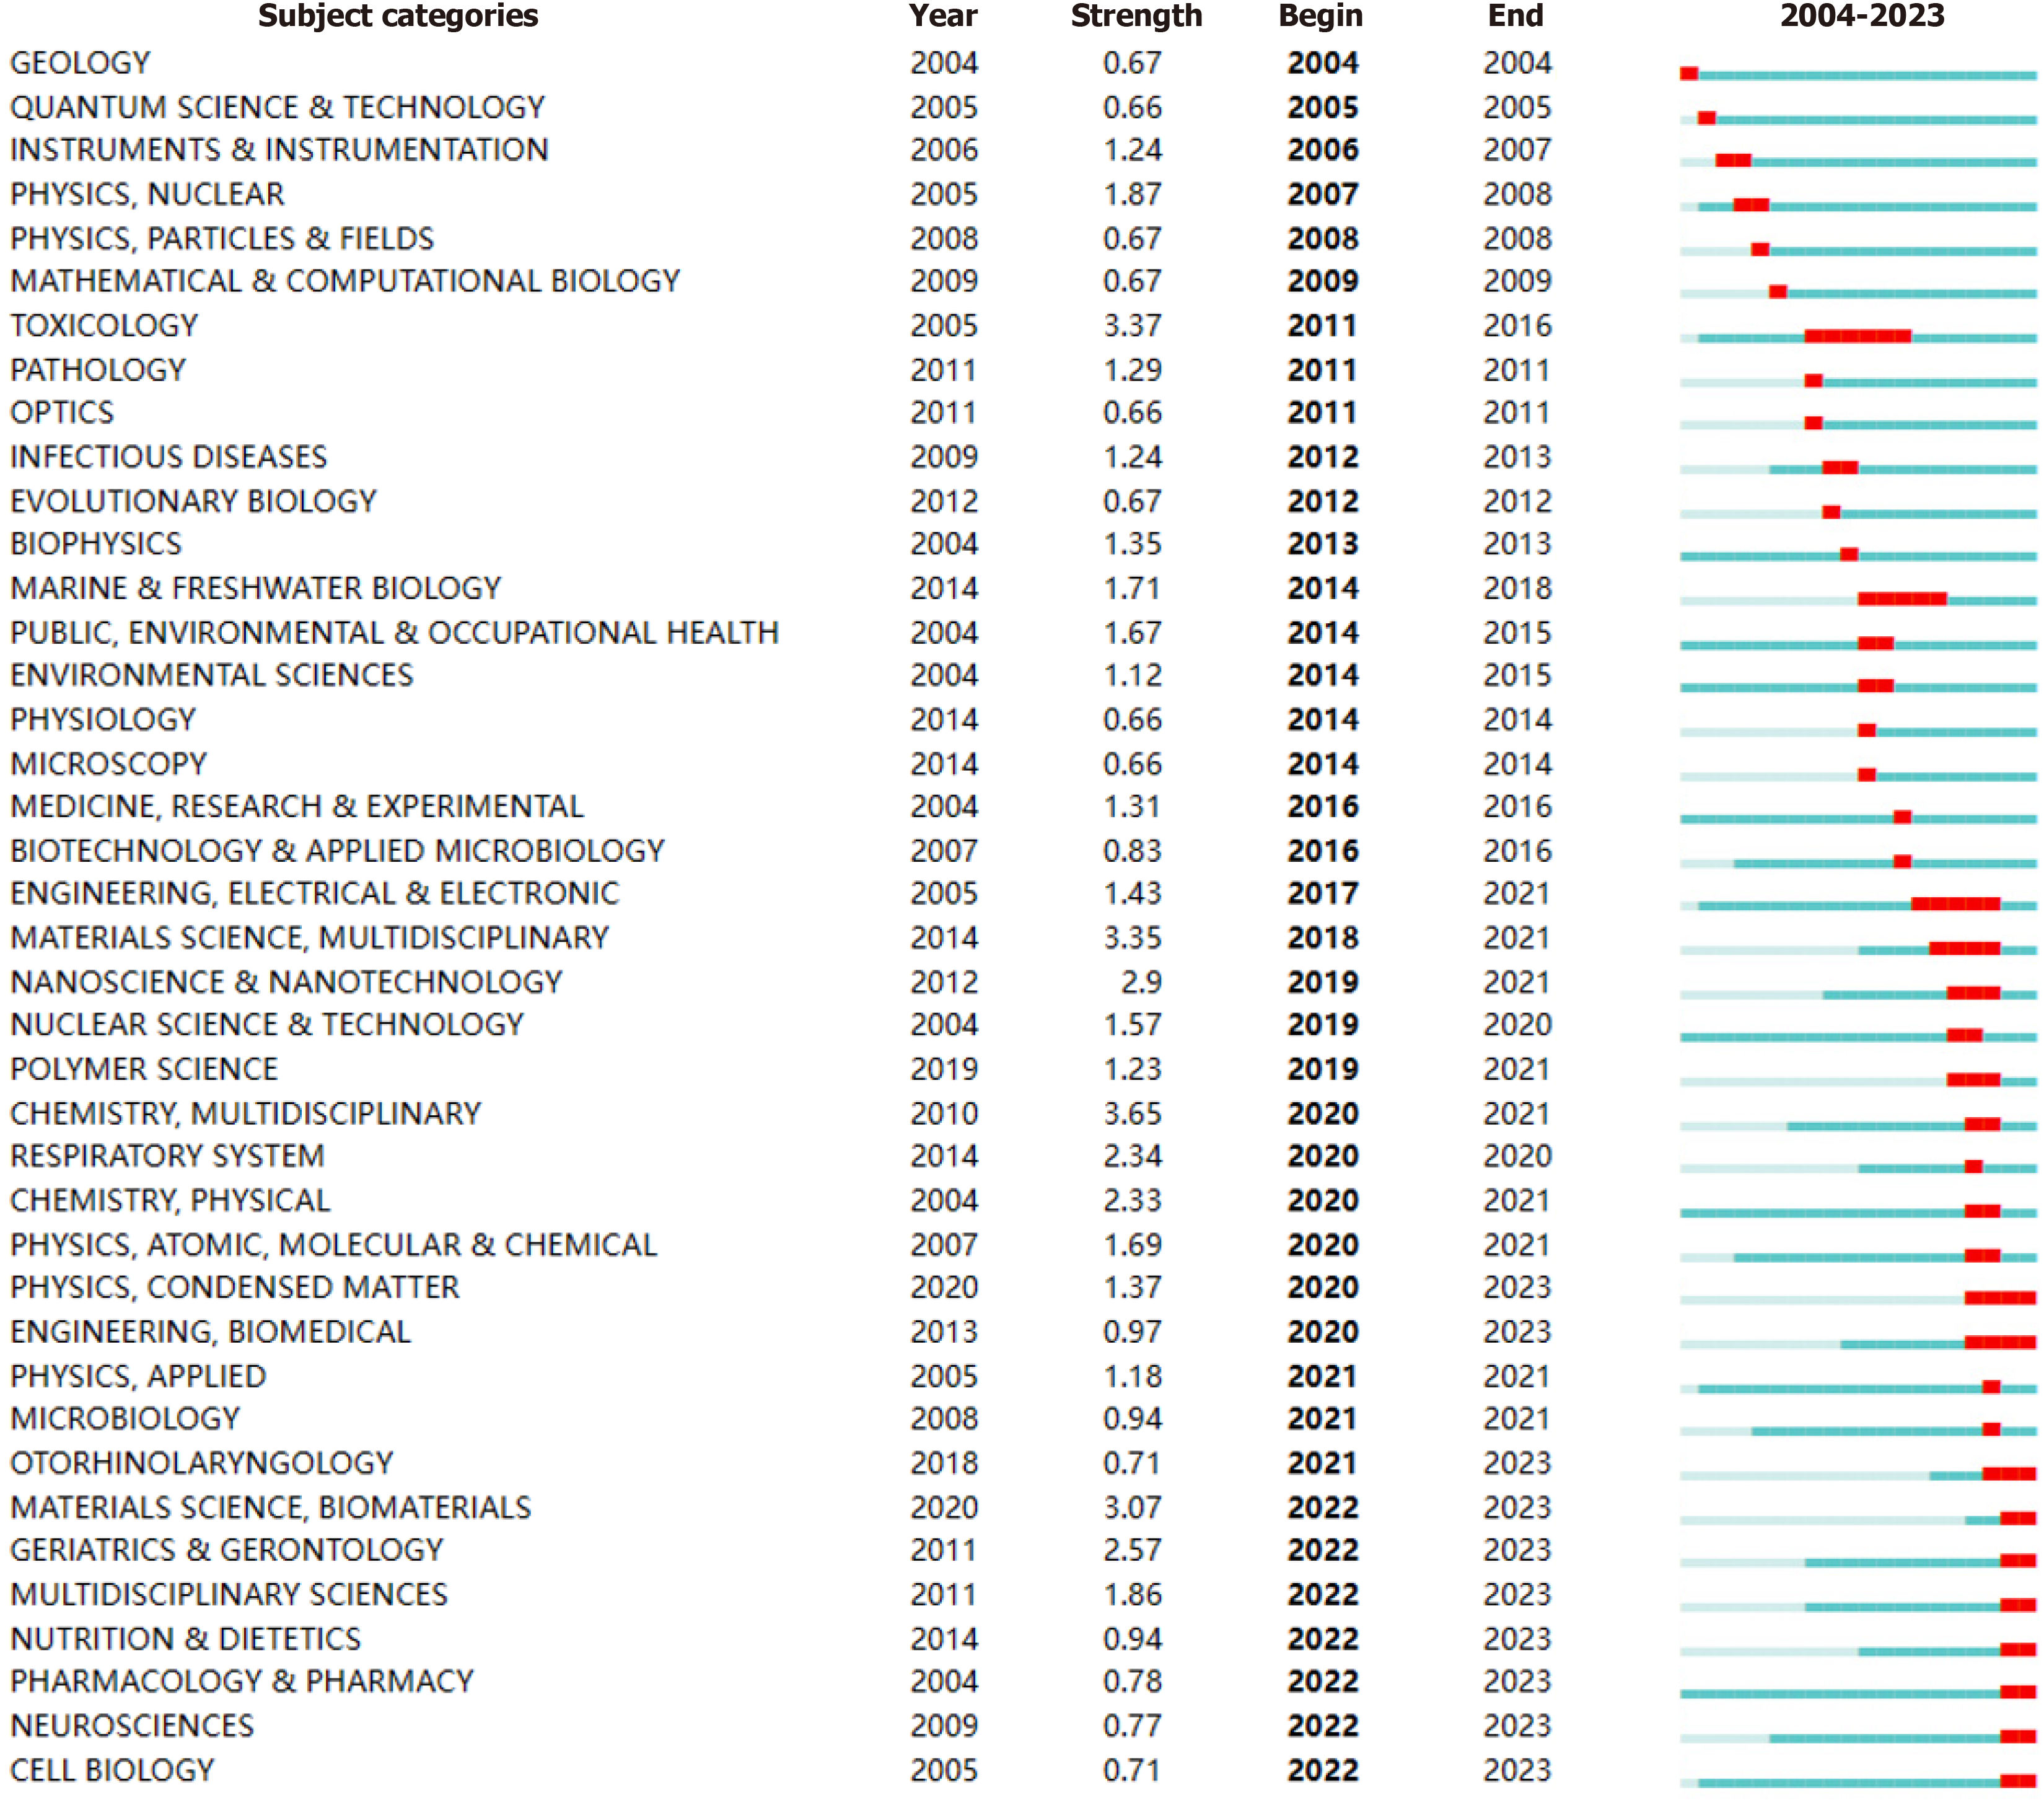
Figure 4 Top 40 subject categories with the strongest citation bursts.
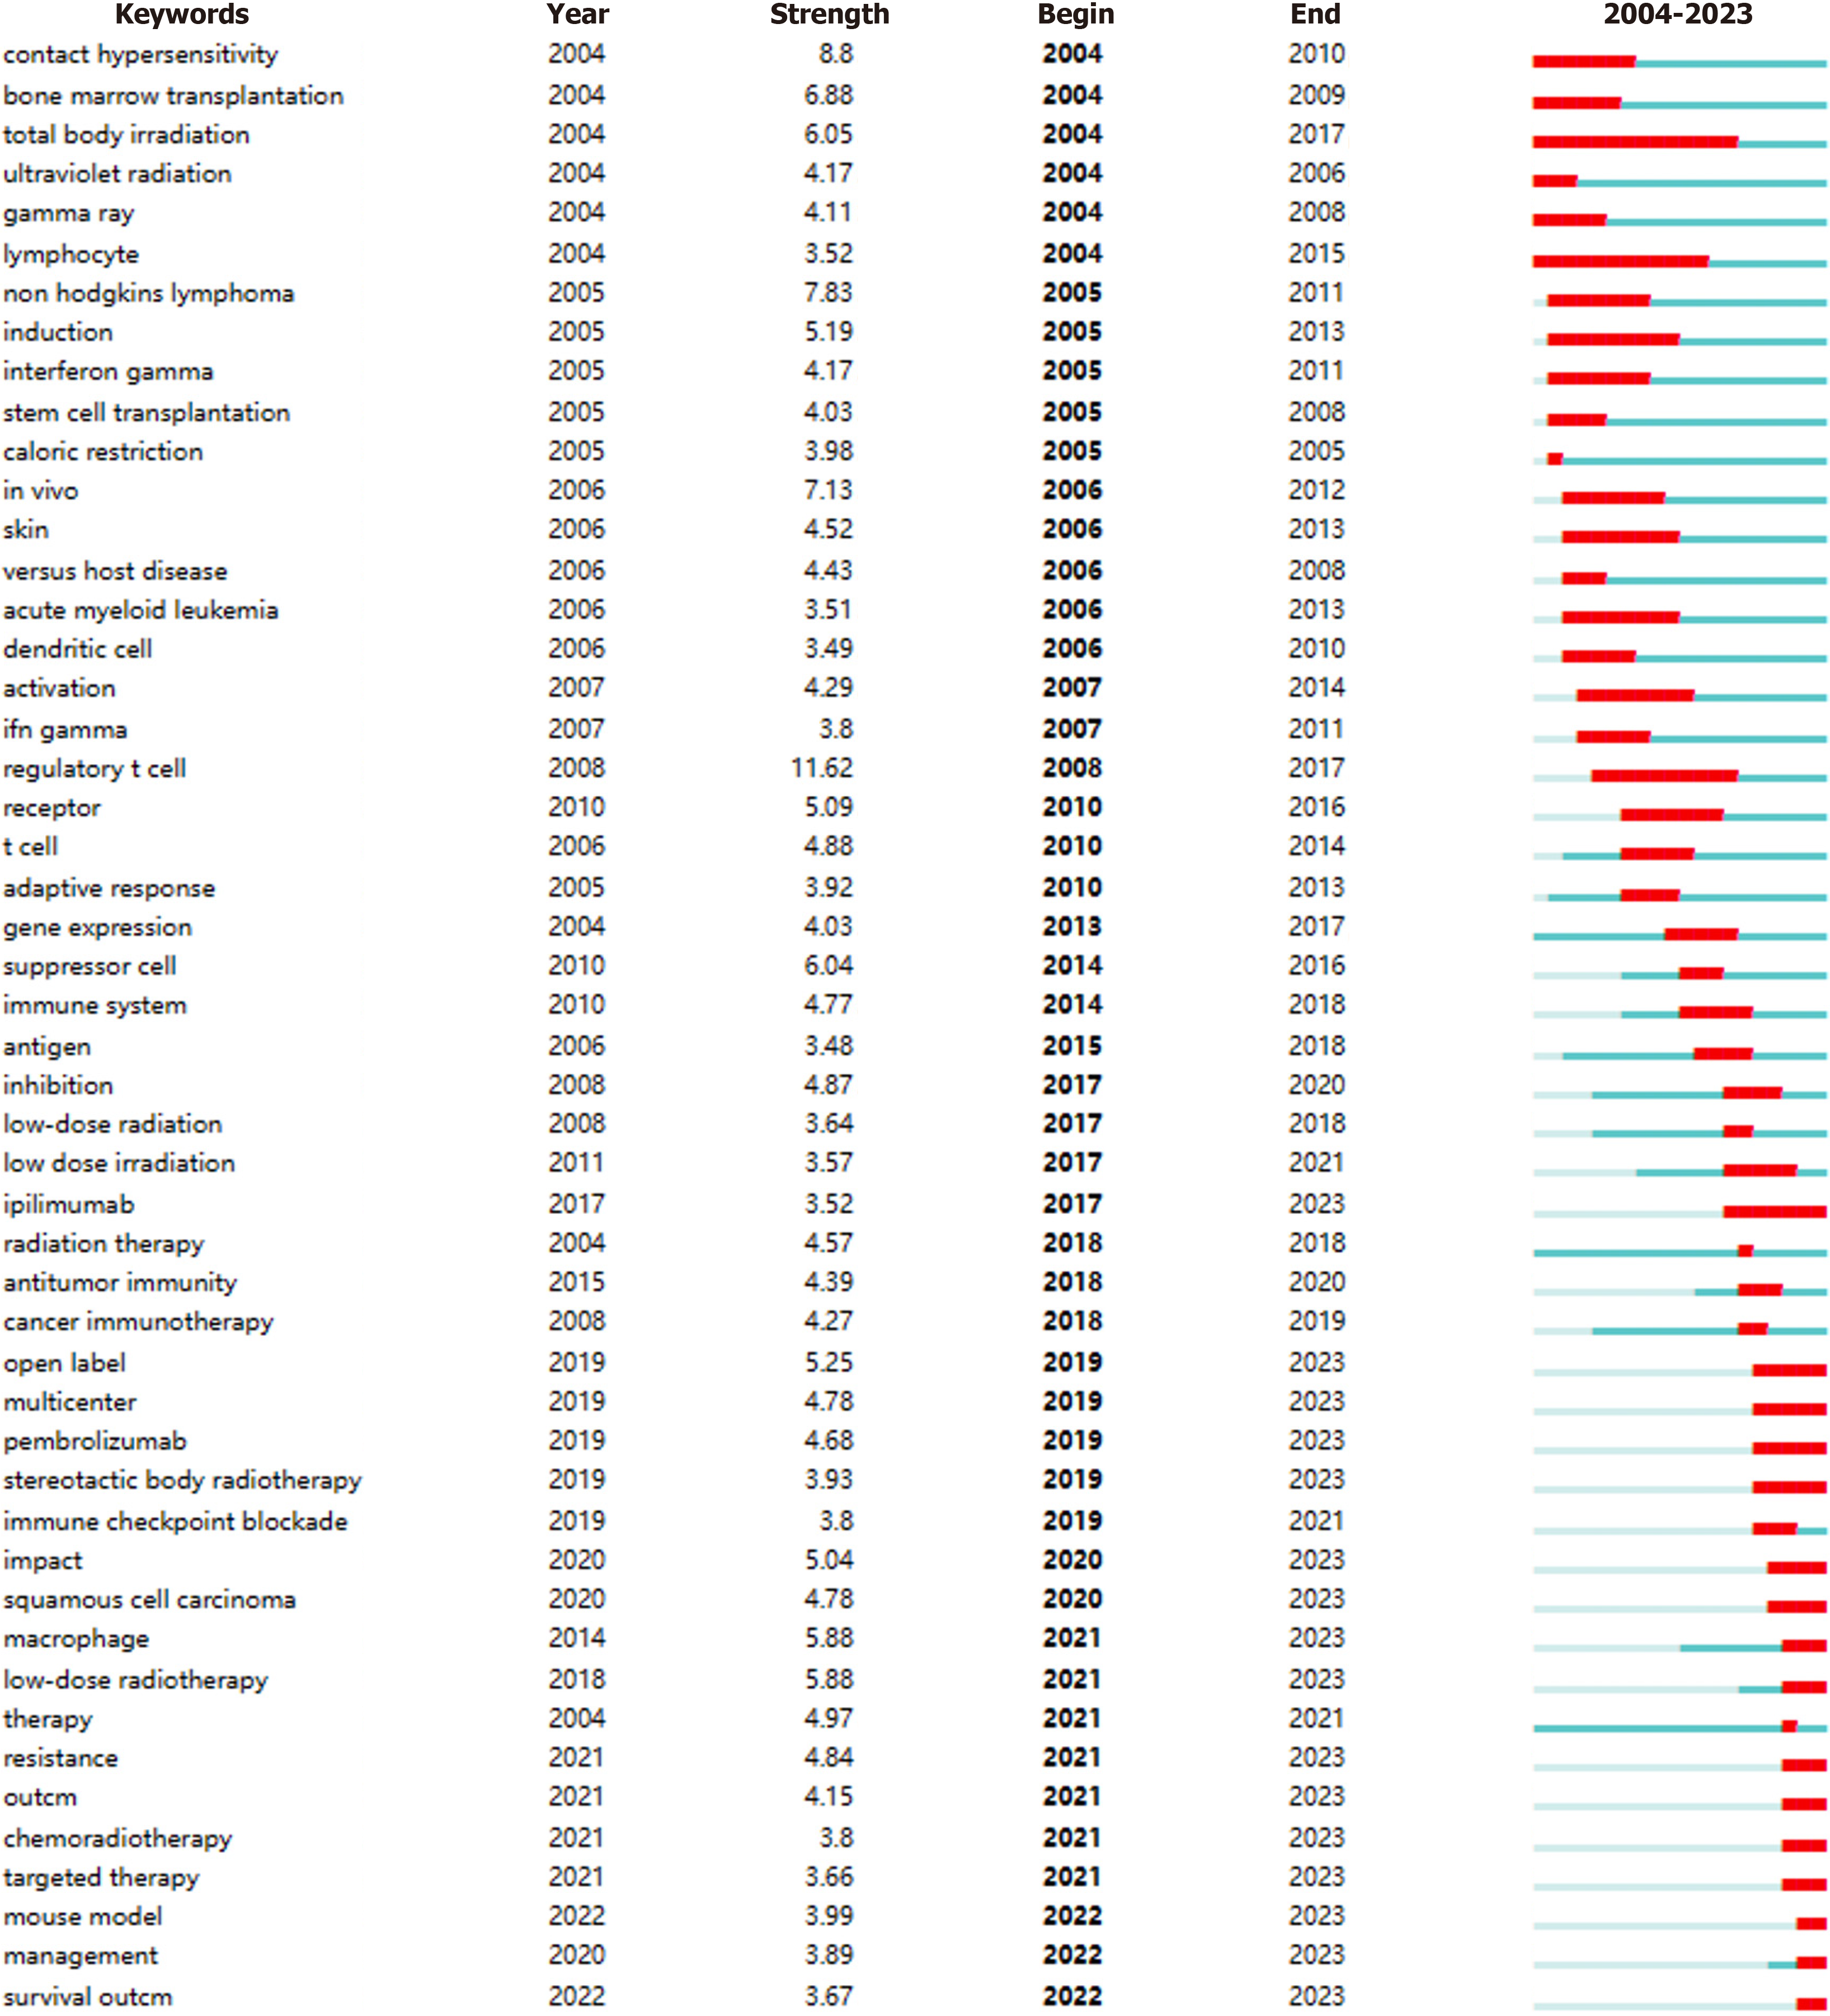
Figure 5 Top 30 keywords with the strongest citation bursts.
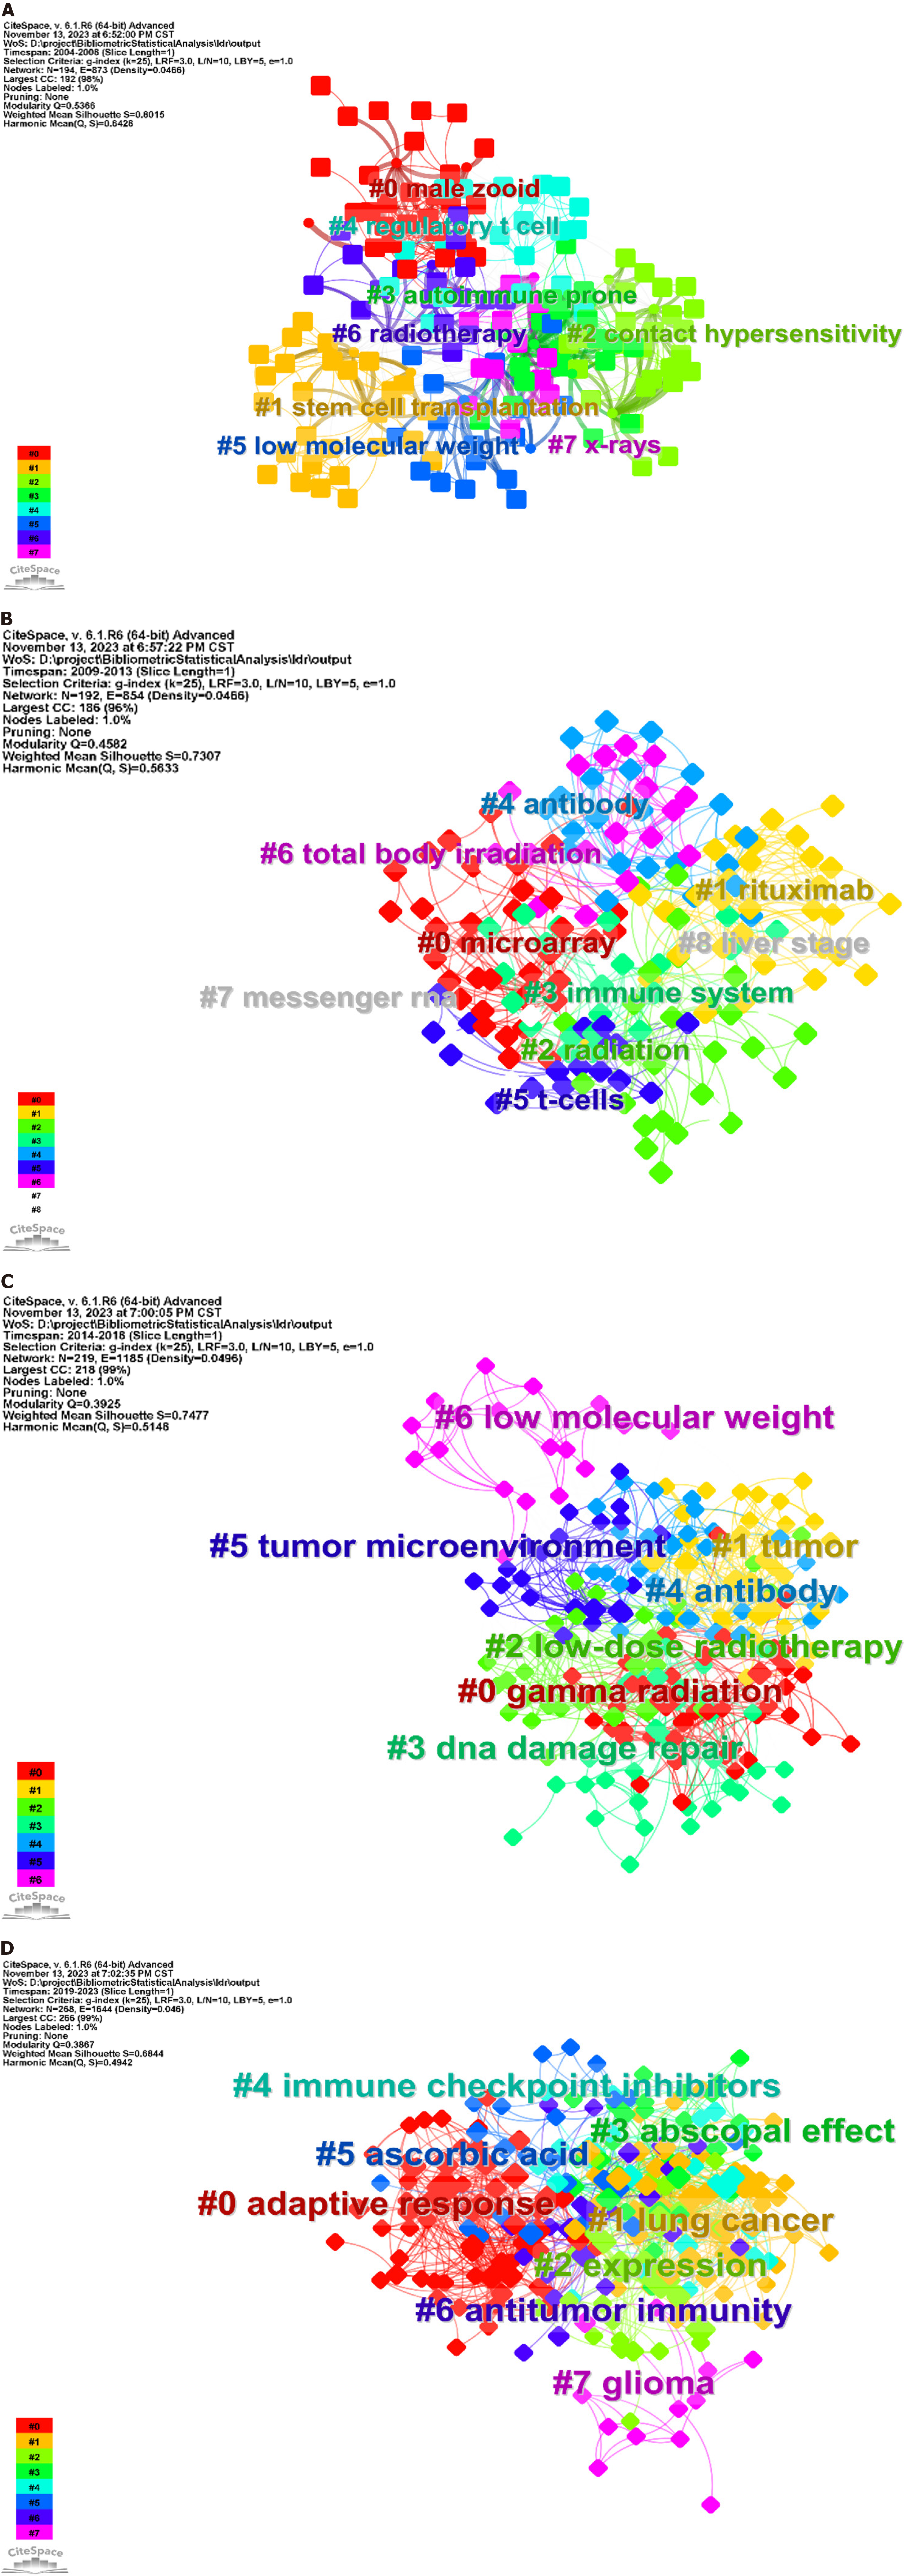
Figure 6 Keyword clusters snapshots across four periods.
A: 2003–2007; B: 2008-2012; C: 2013-2017; D: 2018-2023.
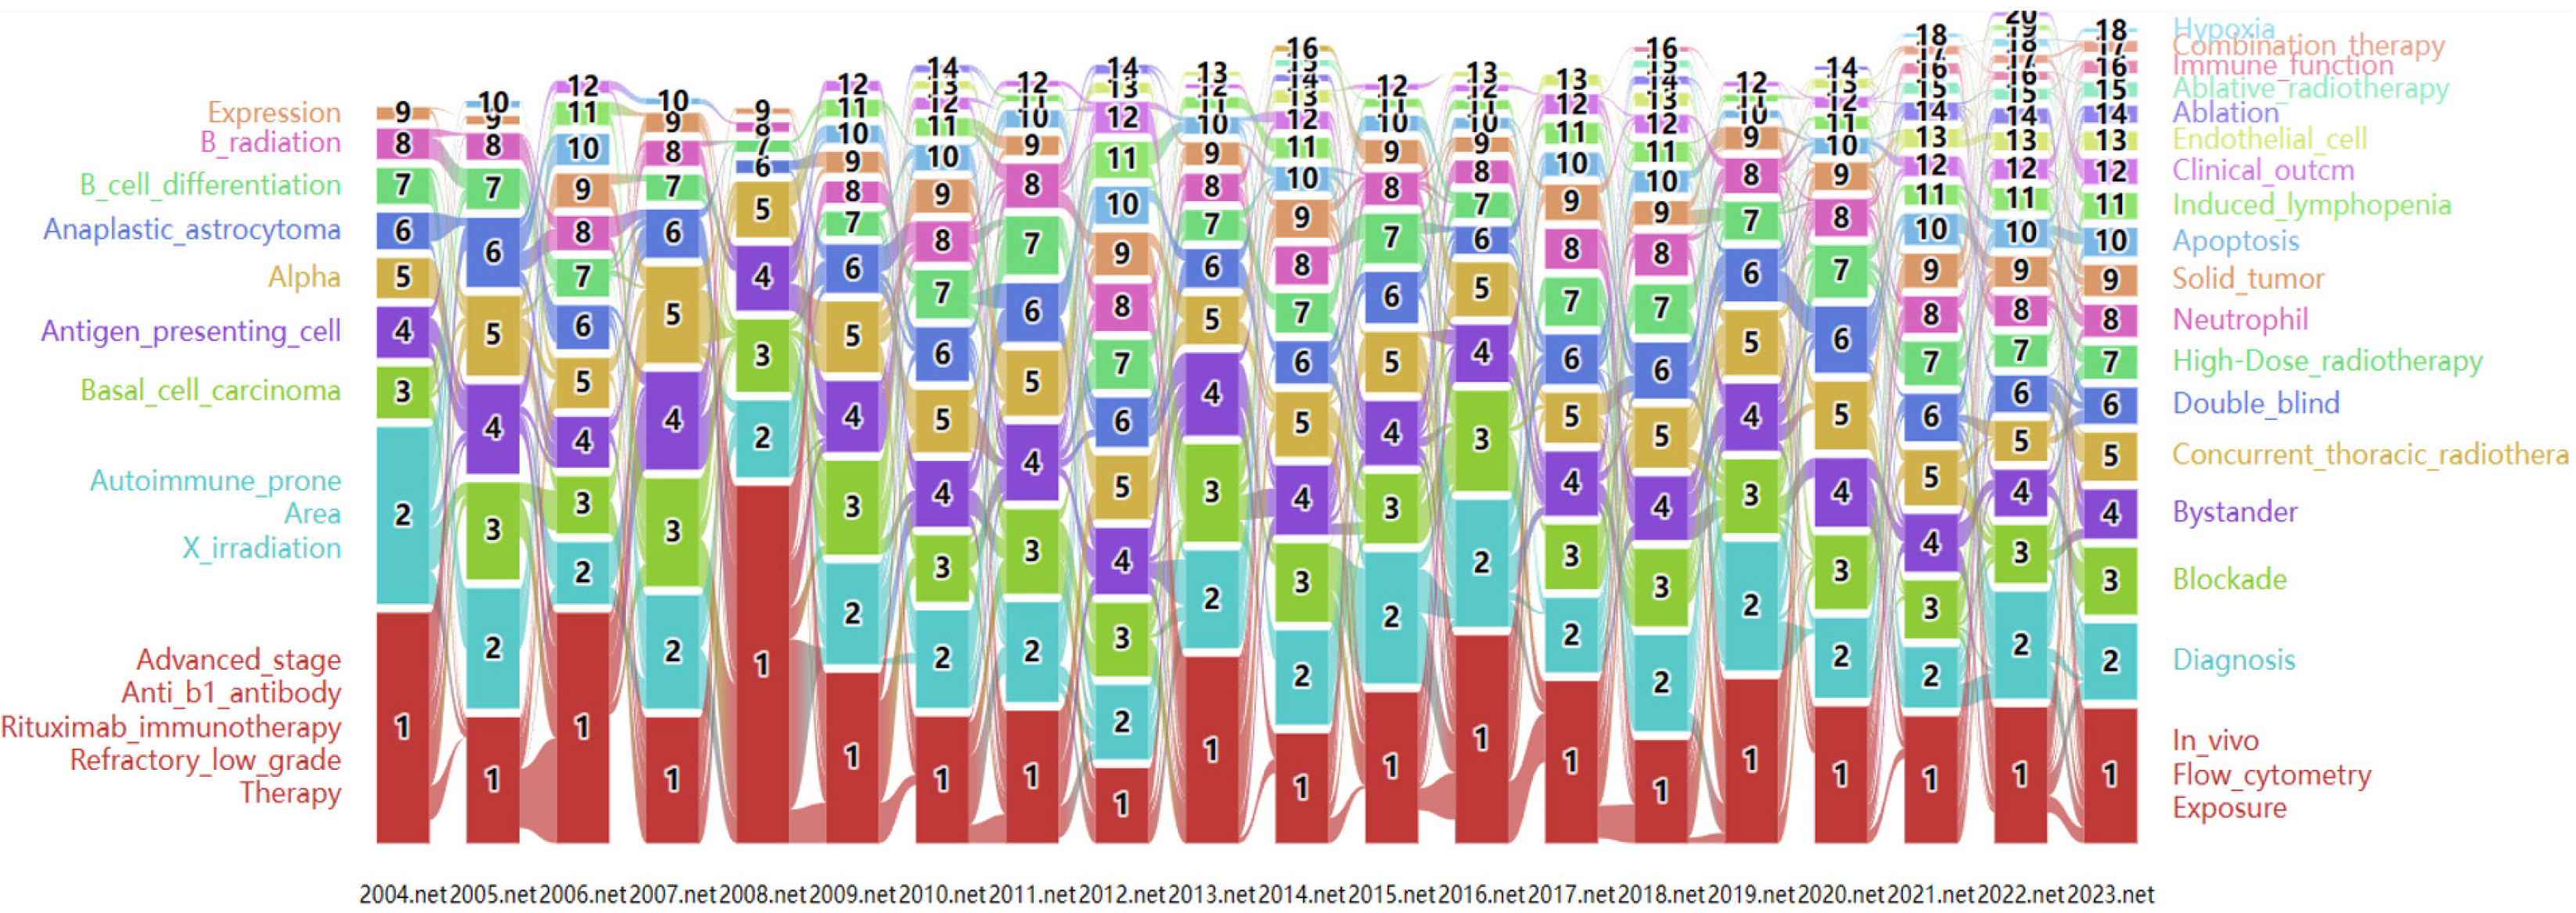
Figure 7 Keywords alluvial map (2004-2023).
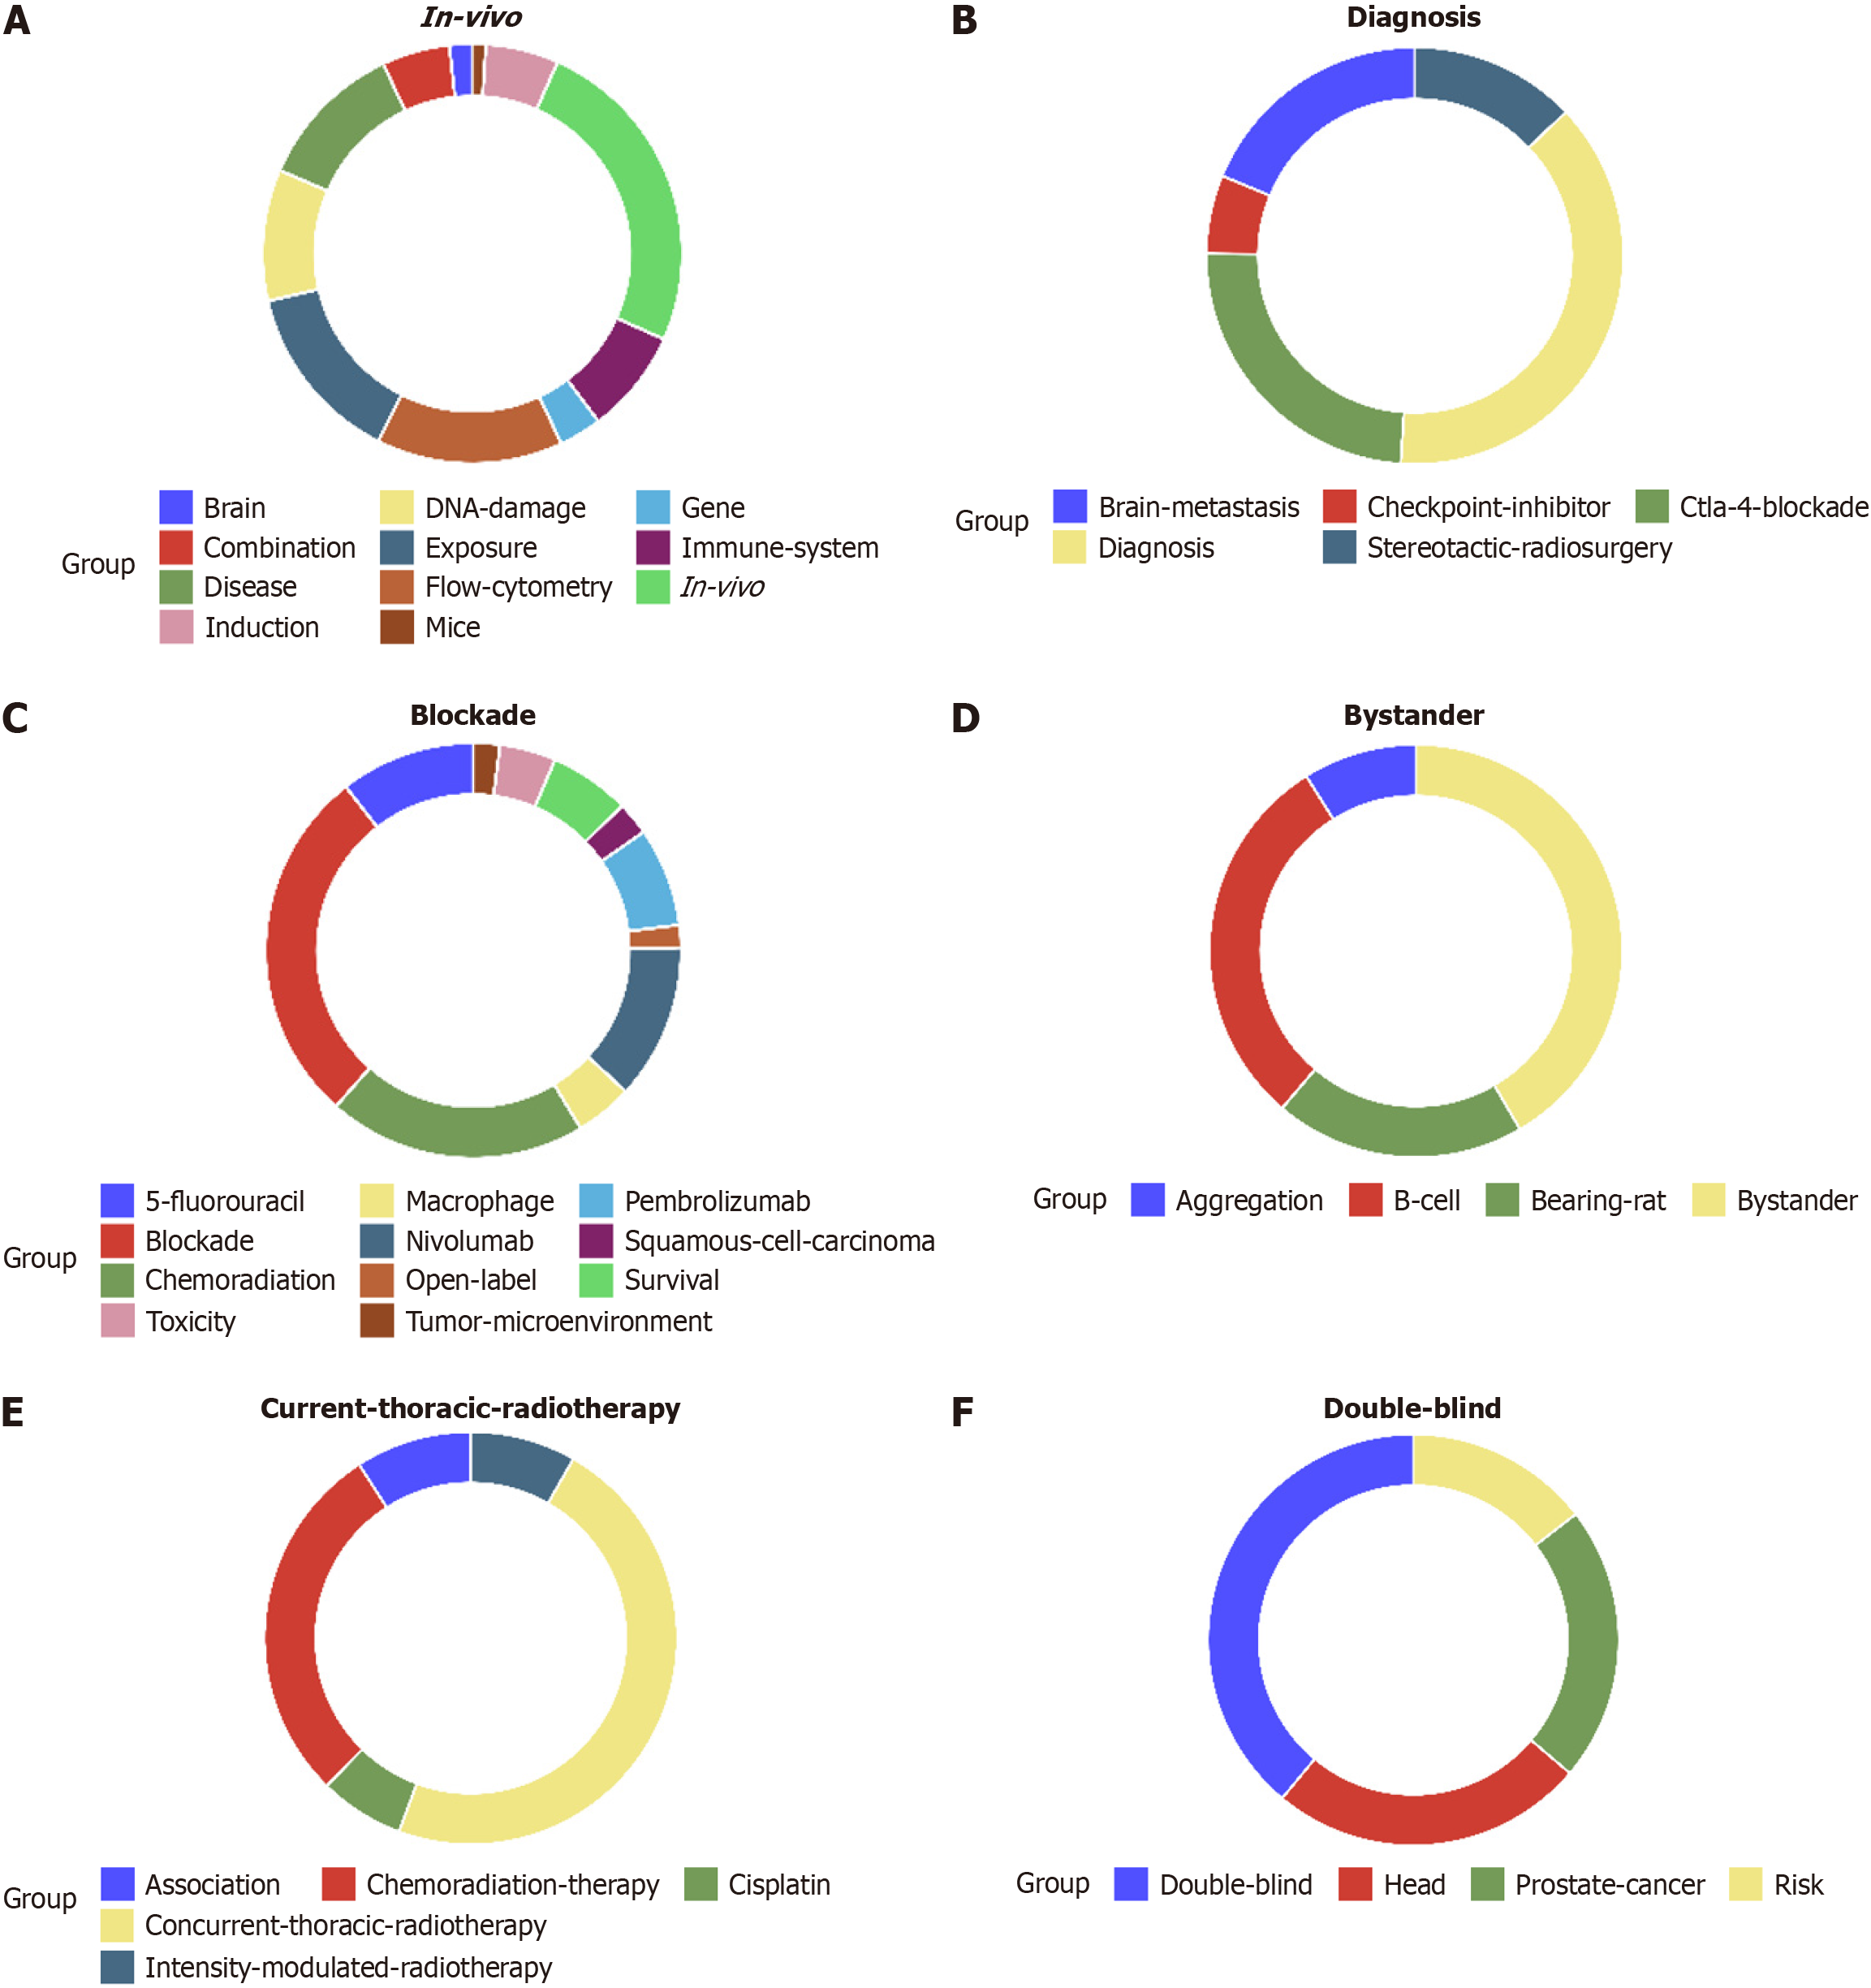
Figure 8 Top 6 modules in 2023.
A: Module 1; B: Module 2; C: Module 3; D: Module 4; E: Module 5; F: Module 6.
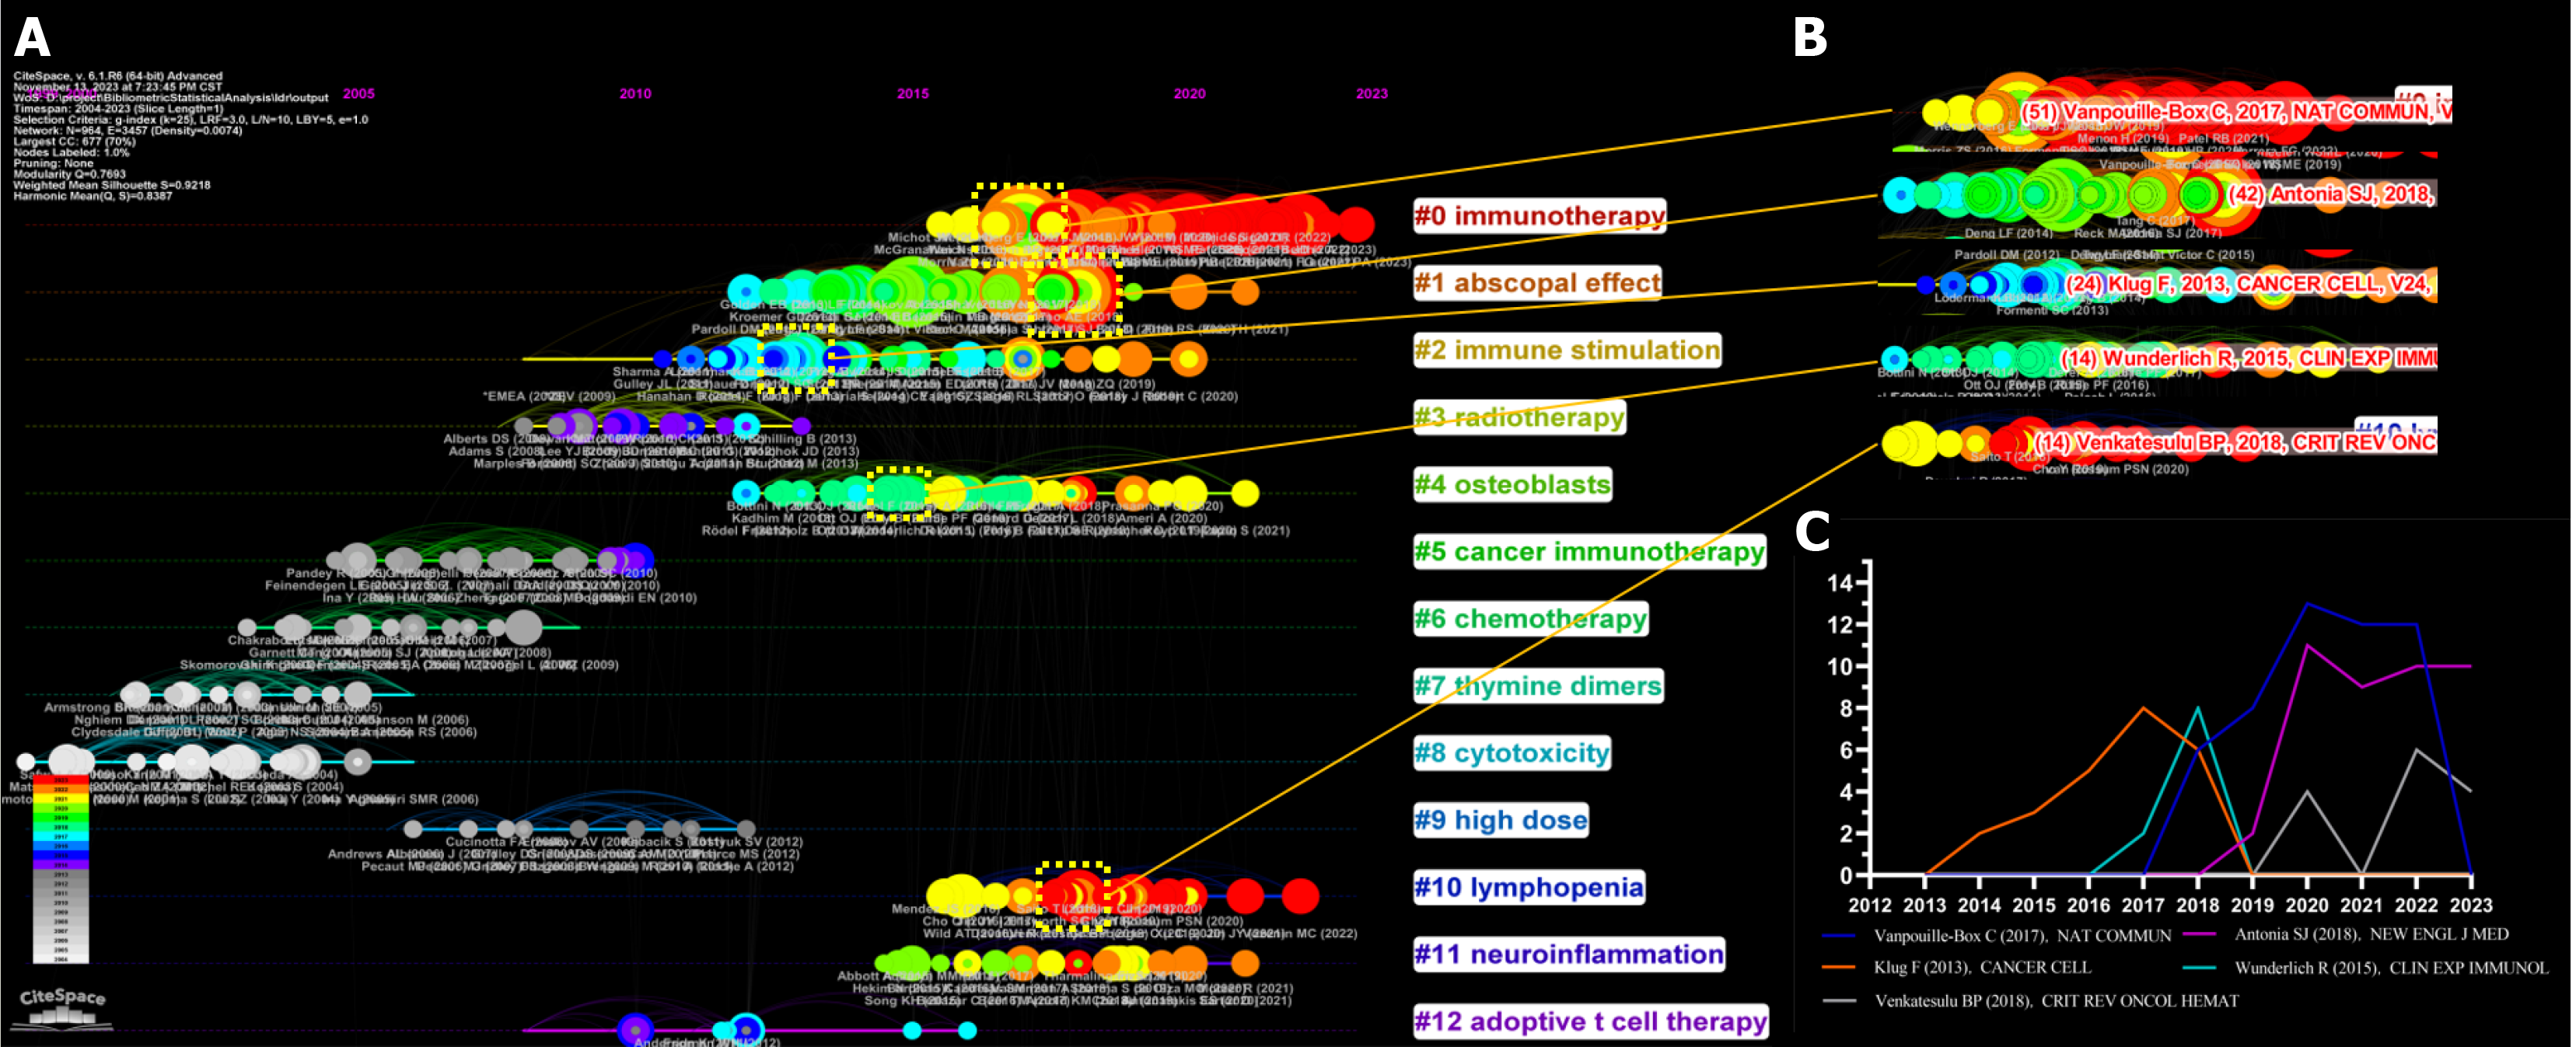
Figure 9 Reference clusters map.
A: Citation timeline visualization; B: Burst citations in clusters 0, 1, 2, 4, and 10; C: Citation frequency distribution of the burst citations.
- Citation: Wang SY, Wu JX, An X, Yuan Z, Ren YF, Yu XF, Tian XD, Wei W. Structural and temporal dynamics analysis on immune response in low-dose radiation: History, research hotspots and emerging trends. World J Radiol 2025; 17(4): 101636
- URL: https://www.wjgnet.com/1949-8470/full/v17/i4/101636.htm
- DOI: https://dx.doi.org/10.4329/wjr.v17.i4.101636


