Copyright
©The Author(s) 2025.
World J Radiol. Feb 28, 2025; 17(2): 104518
Published online Feb 28, 2025. doi: 10.4329/wjr.v17.i2.104518
Published online Feb 28, 2025. doi: 10.4329/wjr.v17.i2.104518
Figure 1 Contrast-enhanced computed tomography.
A: Plain computed tomography revealed a low-density tumor with a diameter of 30 mm located in segment 7; B: In the arterial phase, the tumor showed an oval shape with predominant peripheral enhancement; C: In the portal phase, the enhancement observed in the arterial phase was diminished; D: In the delayed phase, the peripheral area of the tumor became indistinguishable from the surrounding liver parenchyma, while the central area showed progressive enhancement.
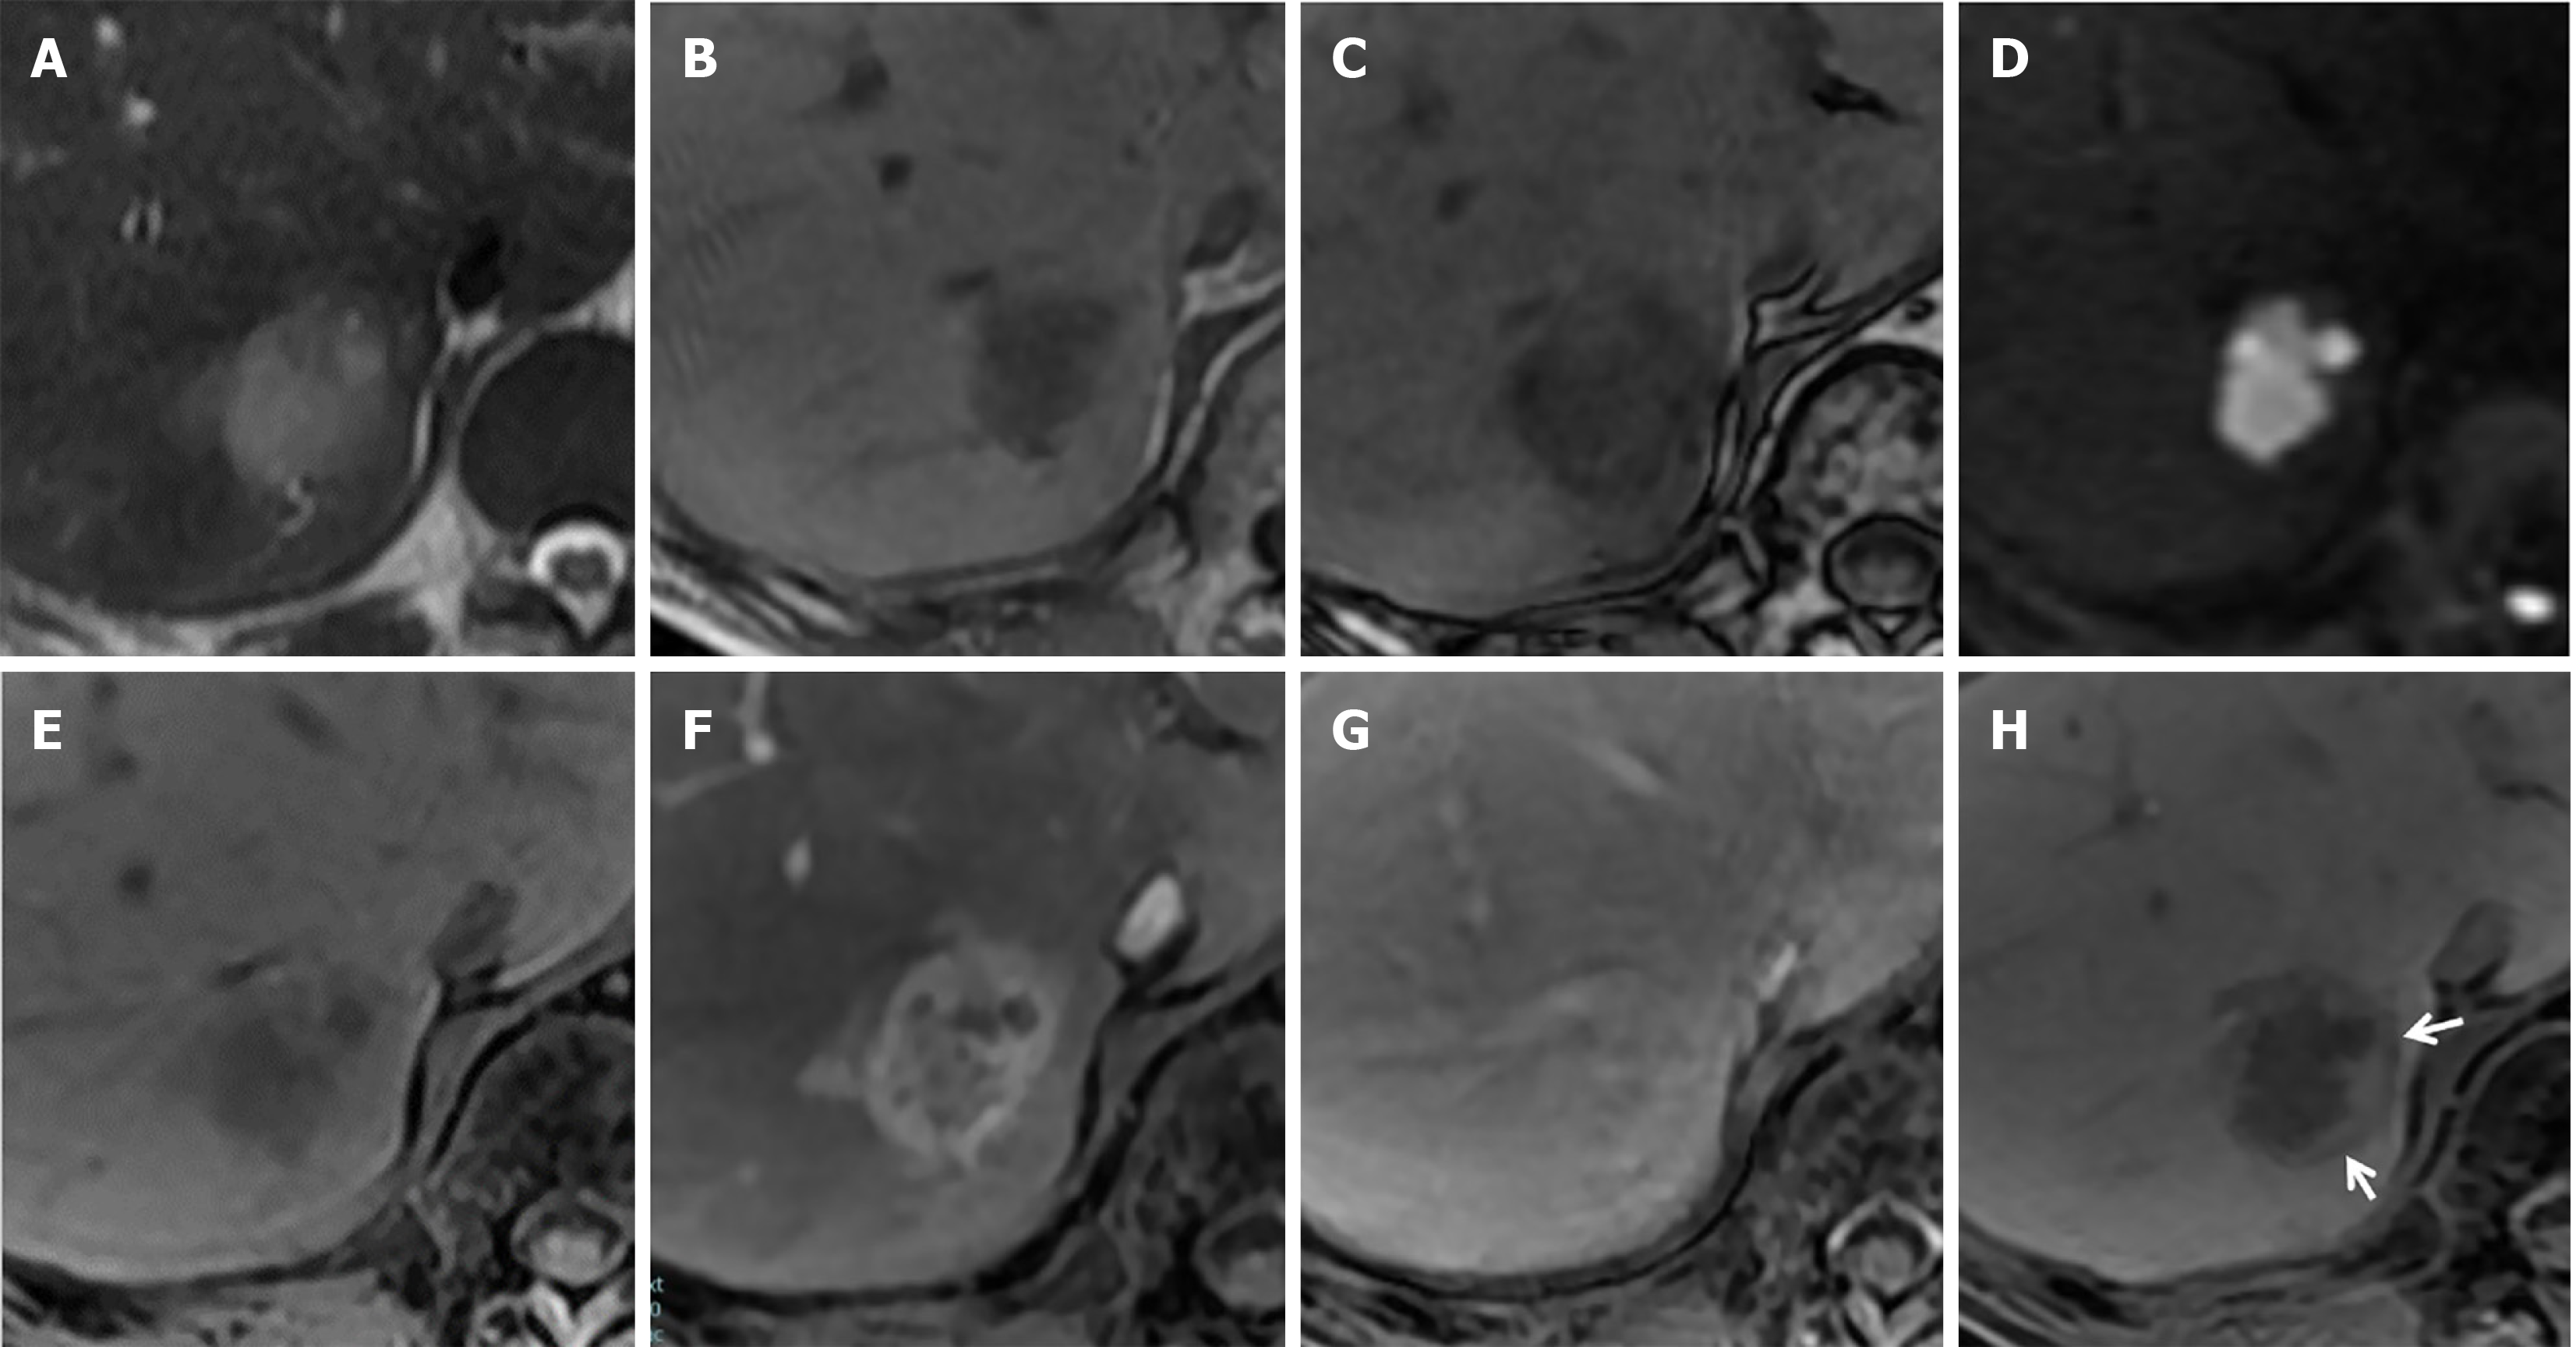
Figure 2 Gadolinium ethoxybenzyl diethylenetriamine penta-acetic acid-enhanced magnetic resonance imaging.
A: The tumor exhibited slight hyperintensity with indistinct borders on the T2-weighted image; B: The tumor showed hypointensity on the T1-weighted in-phase image; C: A signal drop at the tumor margin was observed on the T1-weighted out-phase image; D: The tumor showed hyperintensity on the diffusion-weighted image; E: The tumor showed hypointensity on the fat-saturated T1-weighted image; F: In the arterial phase, the tumor showed well-defined, peripheral-dominant enhancement; G: In the delayed phase, progressive enhancement was observed in the central area of the tumor; H: In the hepatobiliary phase, the peripheral area of the tumor showed hyperintensity, with a surrounding rim-like hypointensity detected around it (arrows).
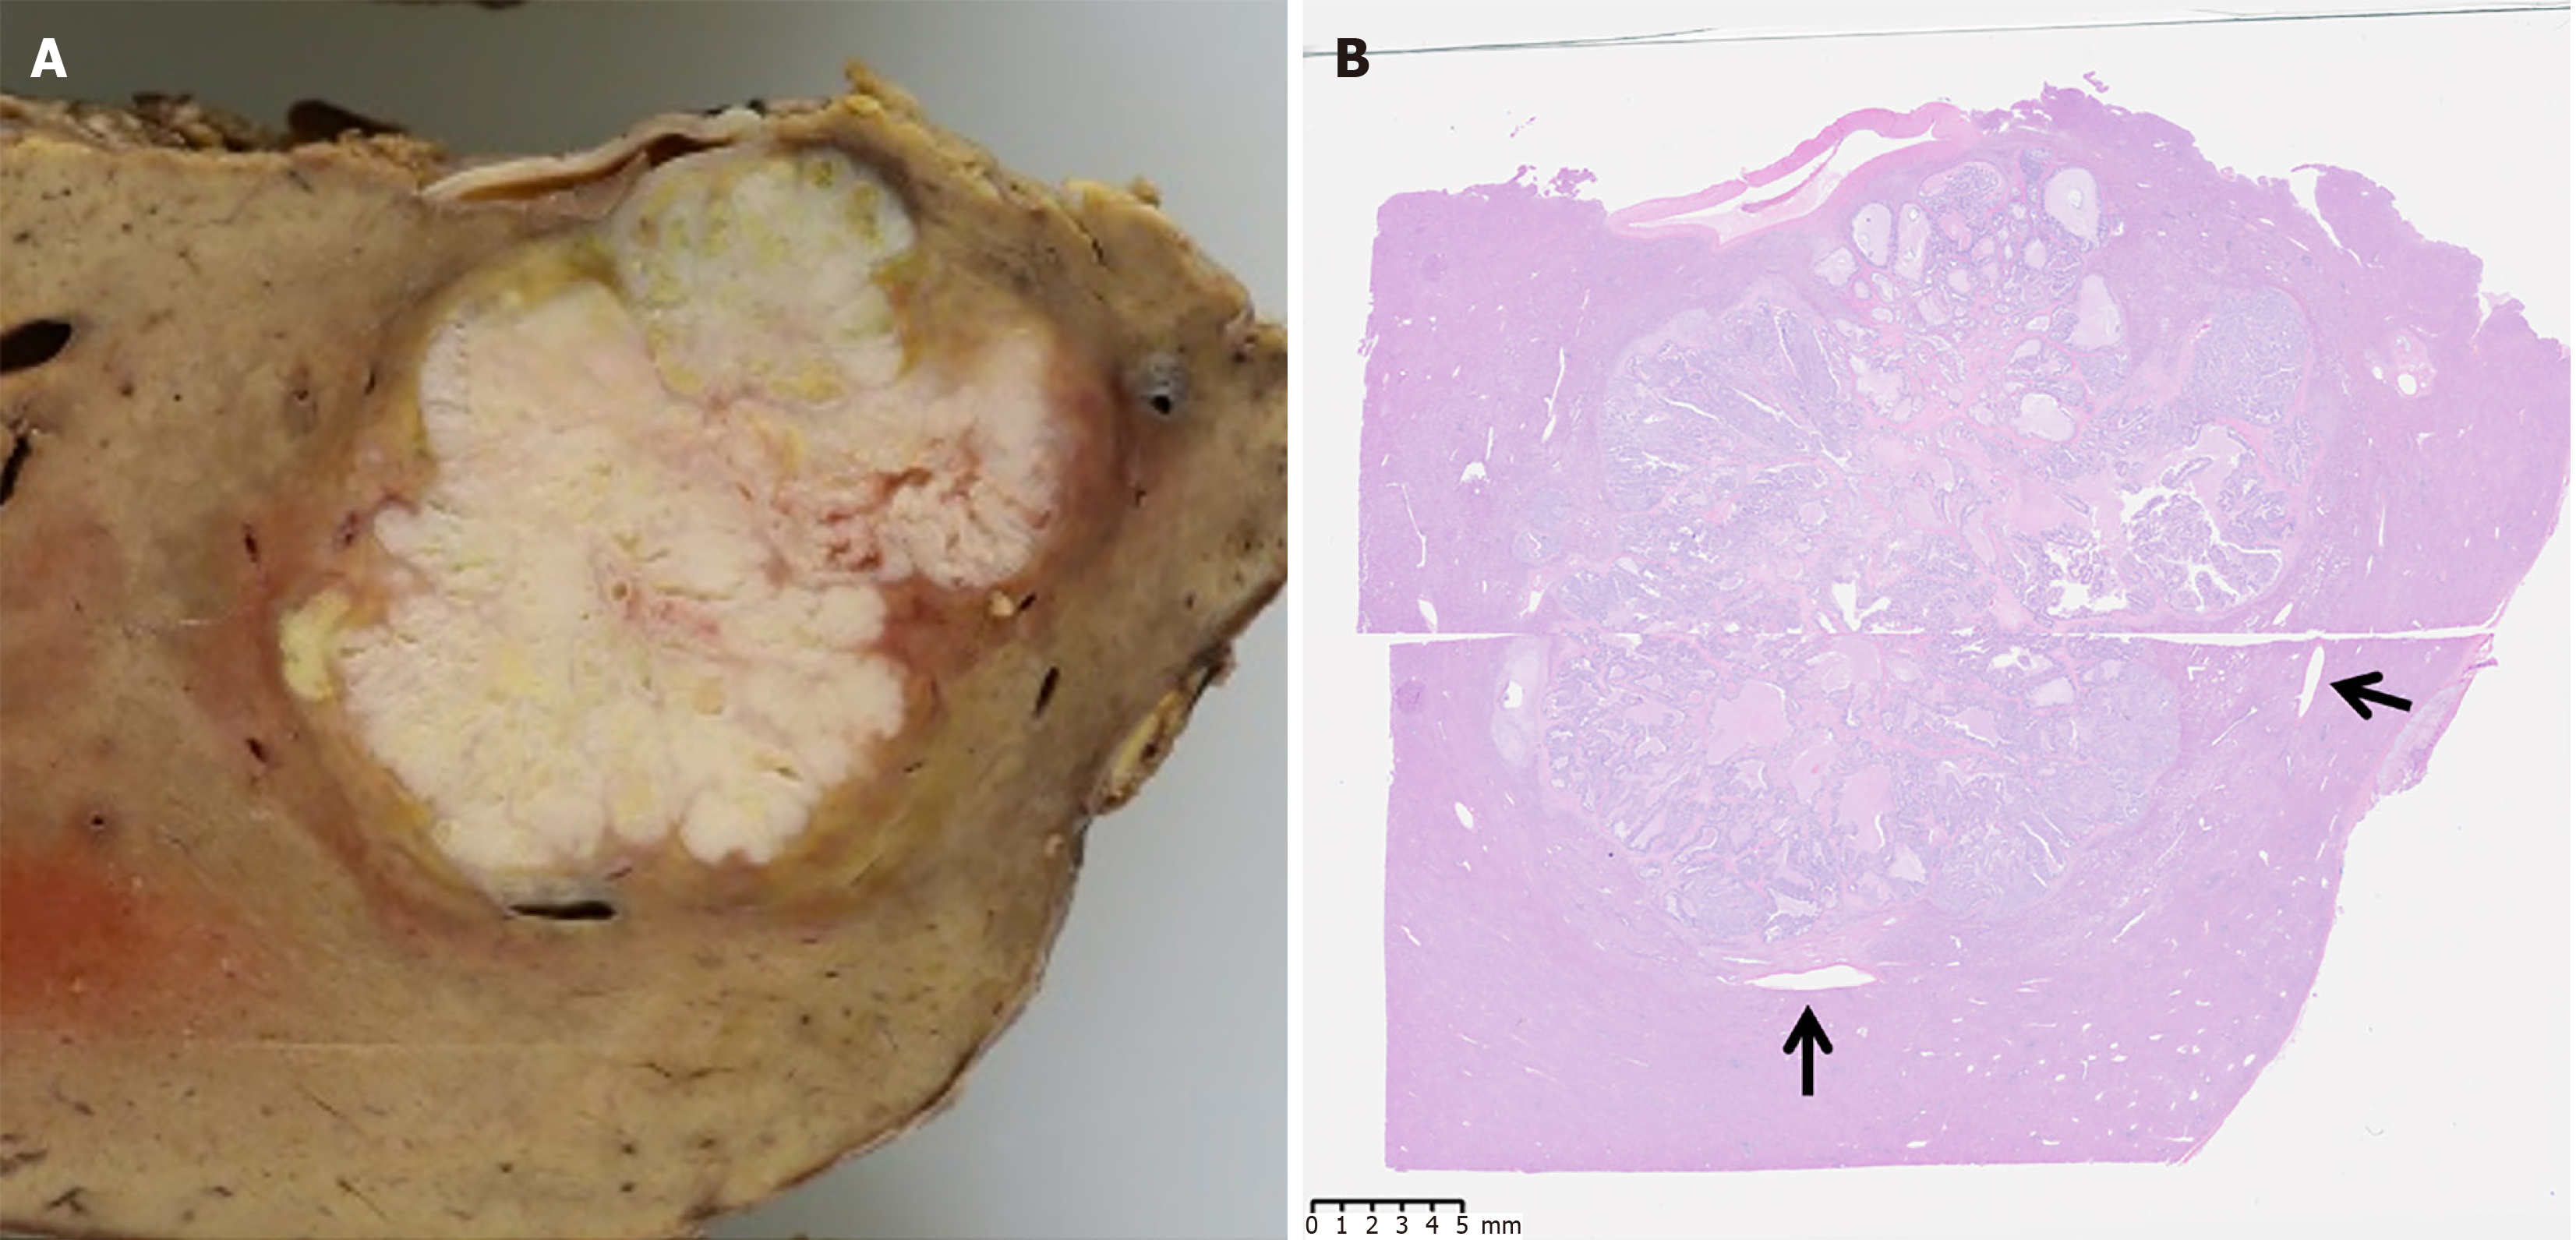
Figure 3 Gross image of the surgical specimen.
A: Macroscopically, a lobulated yellowish-white mass is observed; B: The dilated portal veins were observed surrounding the tumor (arrows).
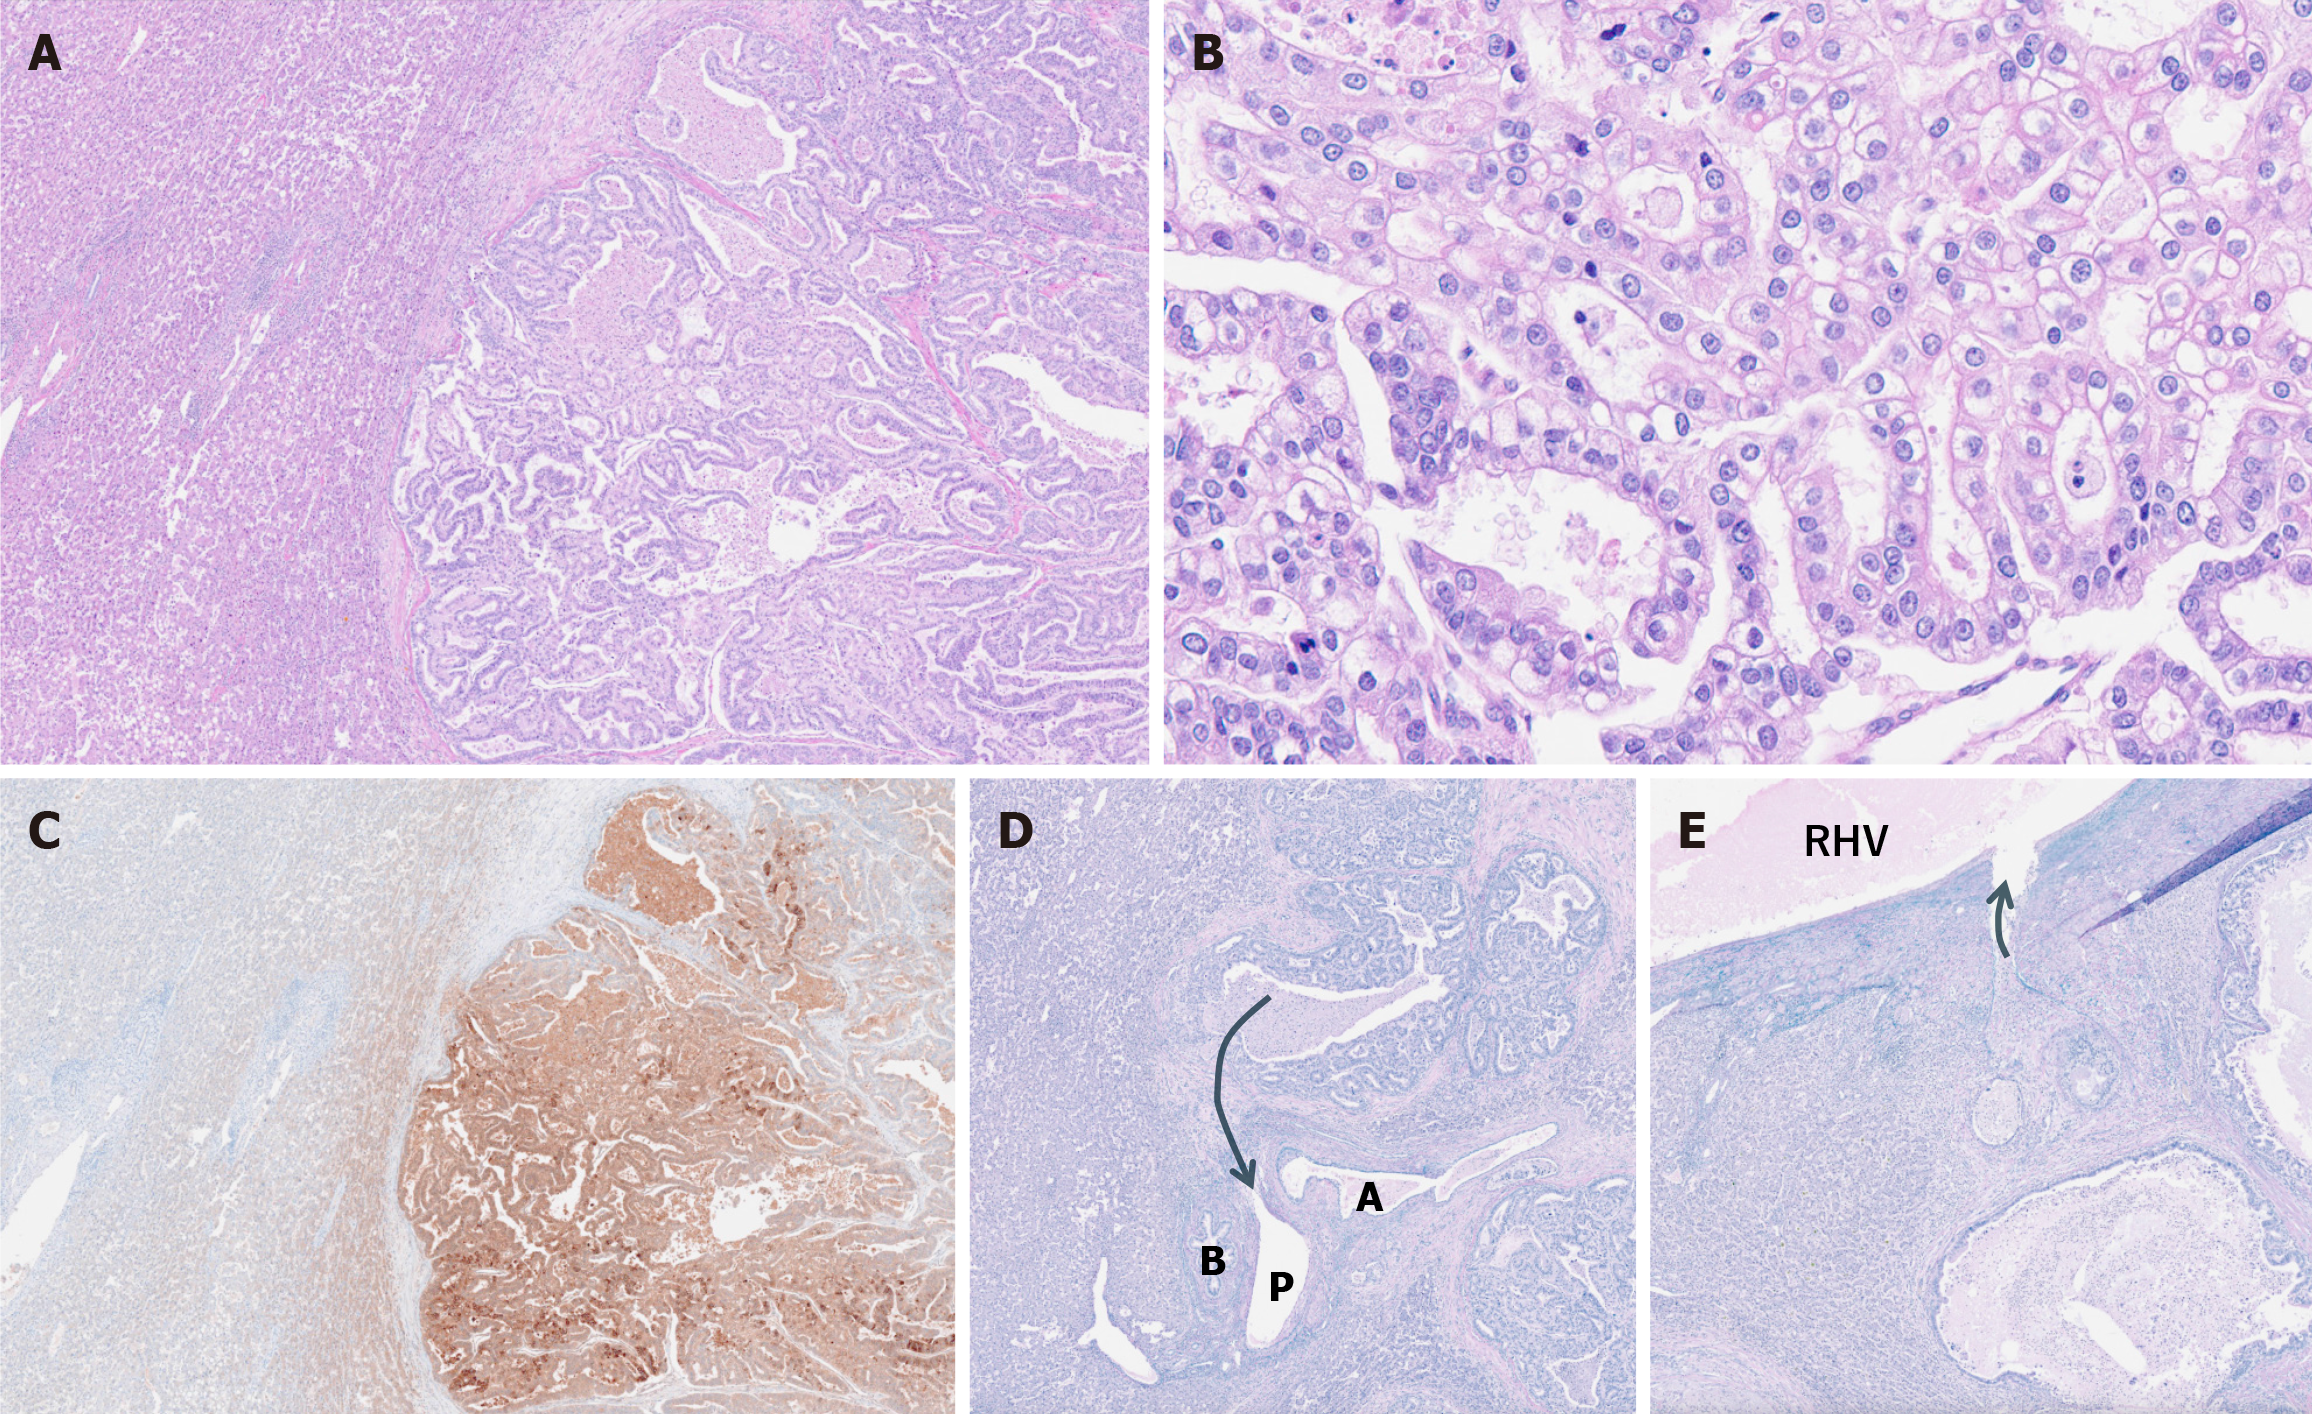
Figure 4 Histopathological images of the surgical specimen.
A: Atypical cells with clear cytoplasm were observed, proliferating in a tubular to papillary pattern (hematoxylin and eosin staining, magnification × 25); B: Higher magnification of the same area as in Figure 4A (hematoxylin and eosin staining, magnification × 200); C: Immunohistochemistry demonstrated that the tumor cells were positive for alpha-fetoprotein; D: Elastica Van Gieson staining revealed invasion of the portal vein (arrow); E: Elastica Van Gieson staining also revealed invasion of the right hepatic vein of the liver parenchyma surrounding the tumor (arrow). RHV: Right hepatic vein.
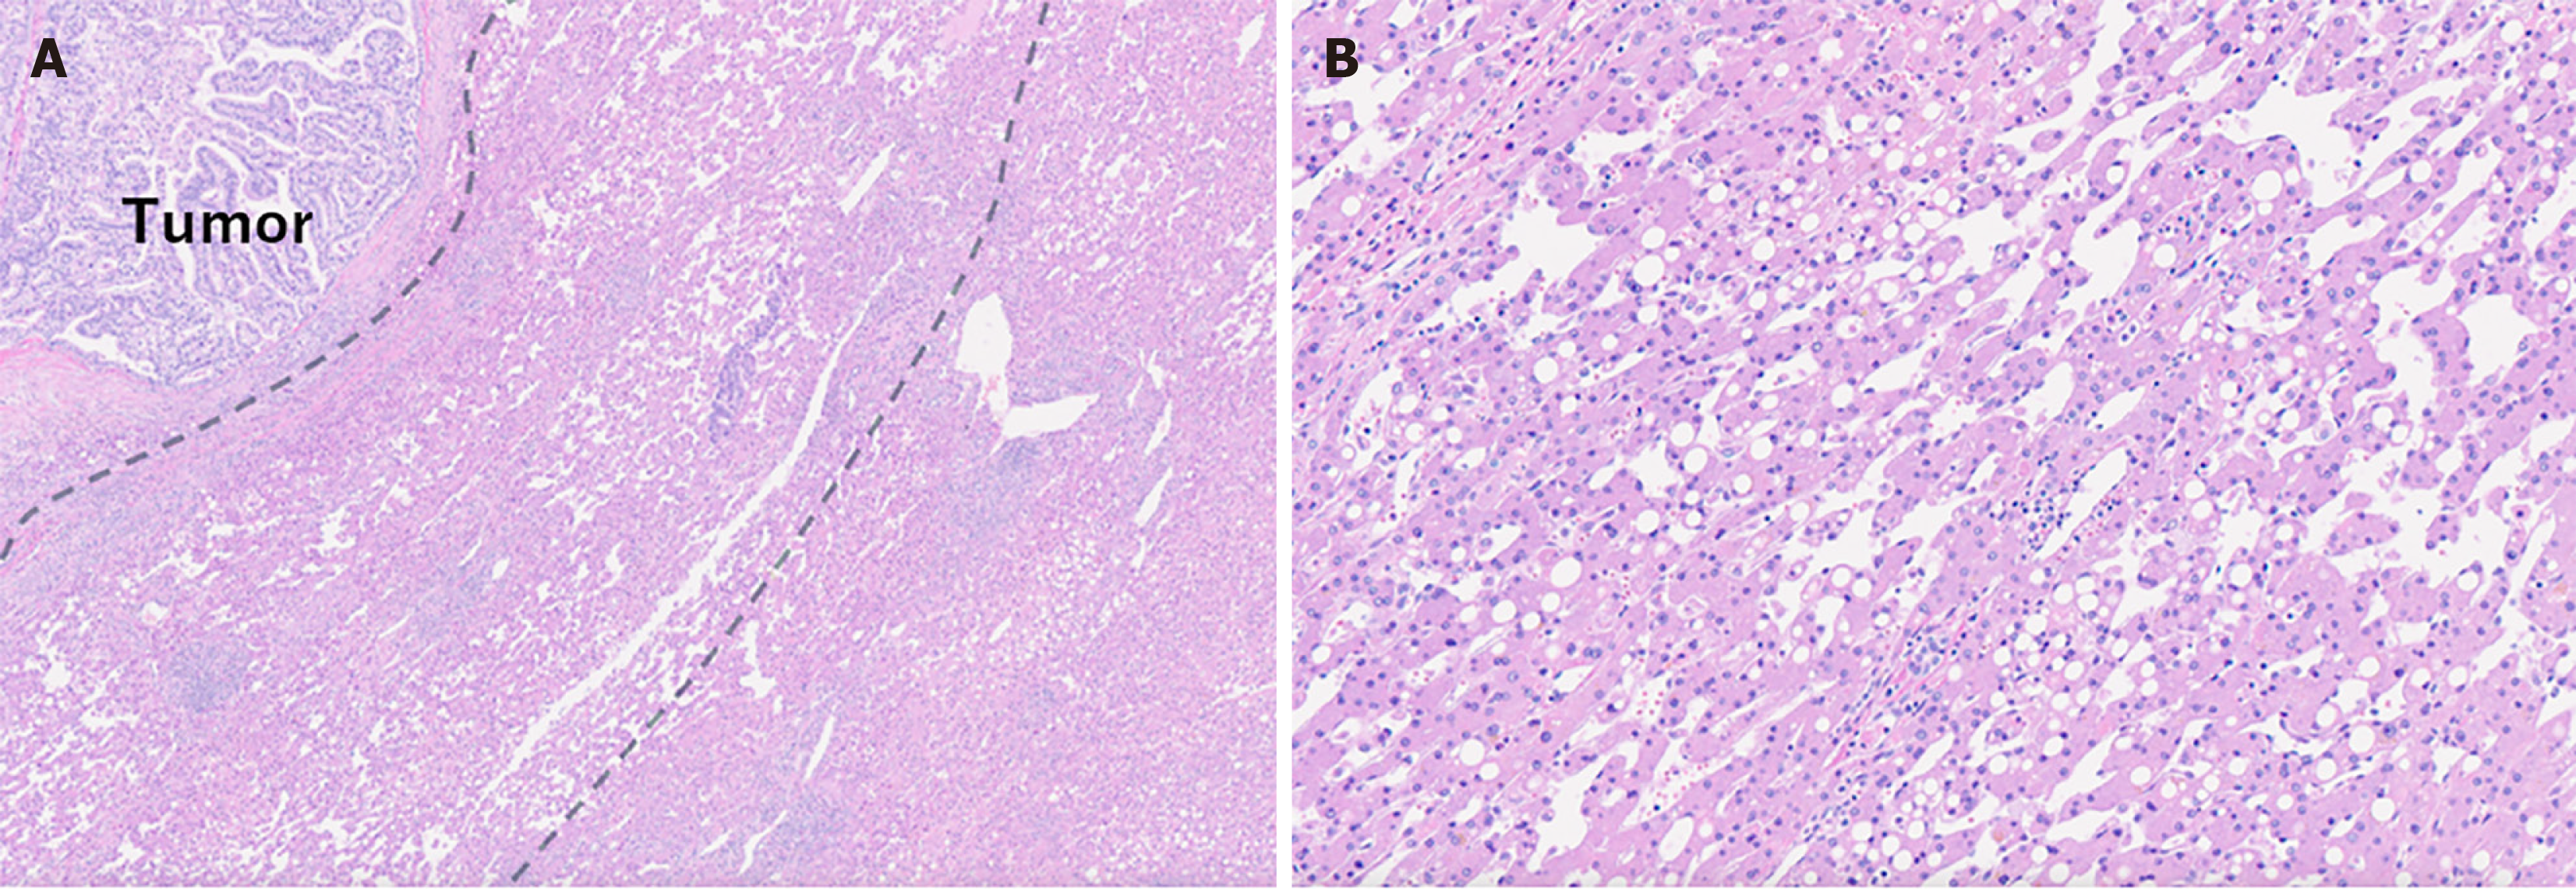
Figure 5 Histopathological image of the tumor margins.
A: Sinusoids of the liver parenchyma in the tumor margin (area surrounded by dotted lines) were dilatated, which was thought to reflect congestion due to vascular invasion (hematoxylin and eosin staining, magnification, × 10); B: Magnification of the area surrounded by the dotted lines showing fatty degeneration of hepatocytes (hematoxylin and eosin staining, magnification, × 100).
- Citation: Irizato M, Minamiguchi K, Fujita Y, Yamaura H, Onaya H, Taiji R, Tanaka T, Inaba Y. Distinctive imaging features of liver metastasis from gastric adenocarcinoma with enteroblastic differentiation: A case report. World J Radiol 2025; 17(2): 104518
- URL: https://www.wjgnet.com/1949-8470/full/v17/i2/104518.htm
- DOI: https://dx.doi.org/10.4329/wjr.v17.i2.104518


