Copyright
©The Author(s) 2024.
World J Radiol. Sep 28, 2024; 16(9): 489-496
Published online Sep 28, 2024. doi: 10.4329/wjr.v16.i9.489
Published online Sep 28, 2024. doi: 10.4329/wjr.v16.i9.489
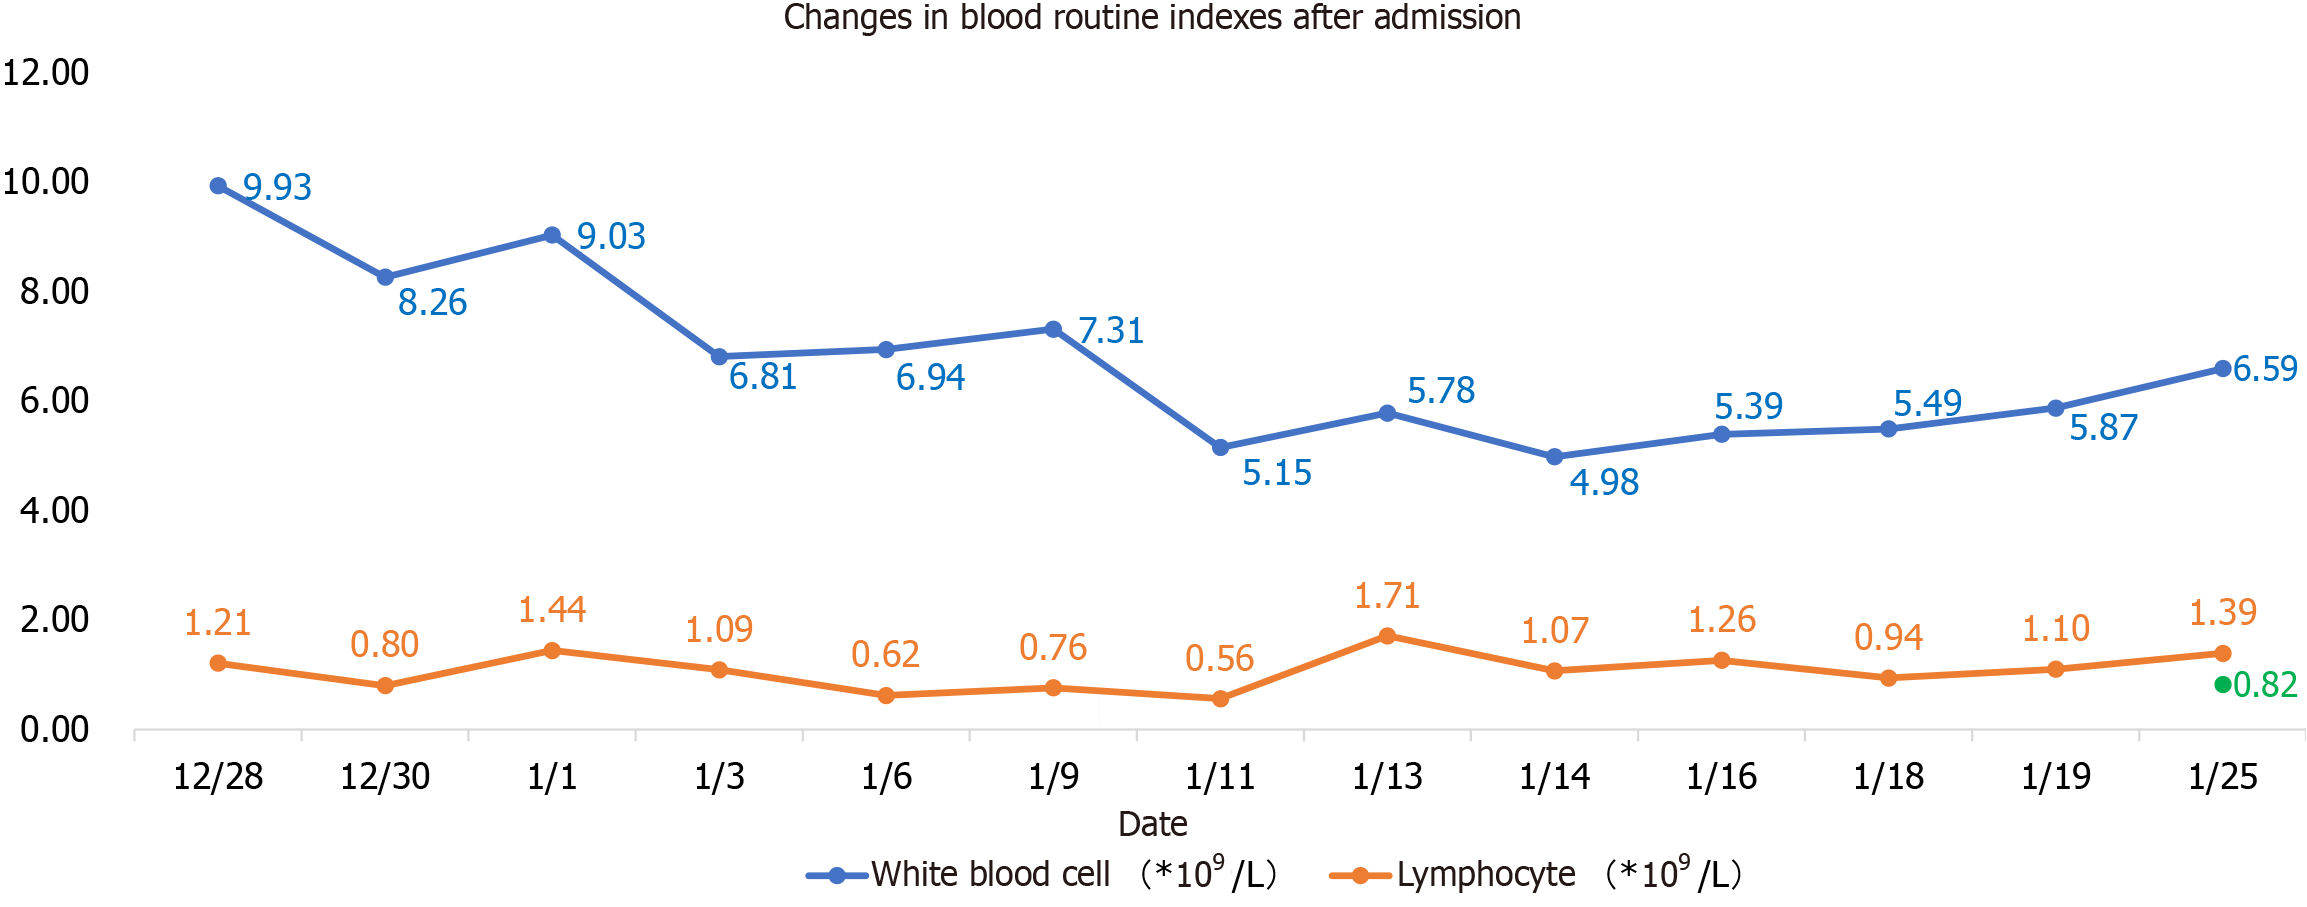
Figure 1
Changes in blood routine indexes after admission: High white blood cells in the early stage of admission, and basically normal in the later stage.
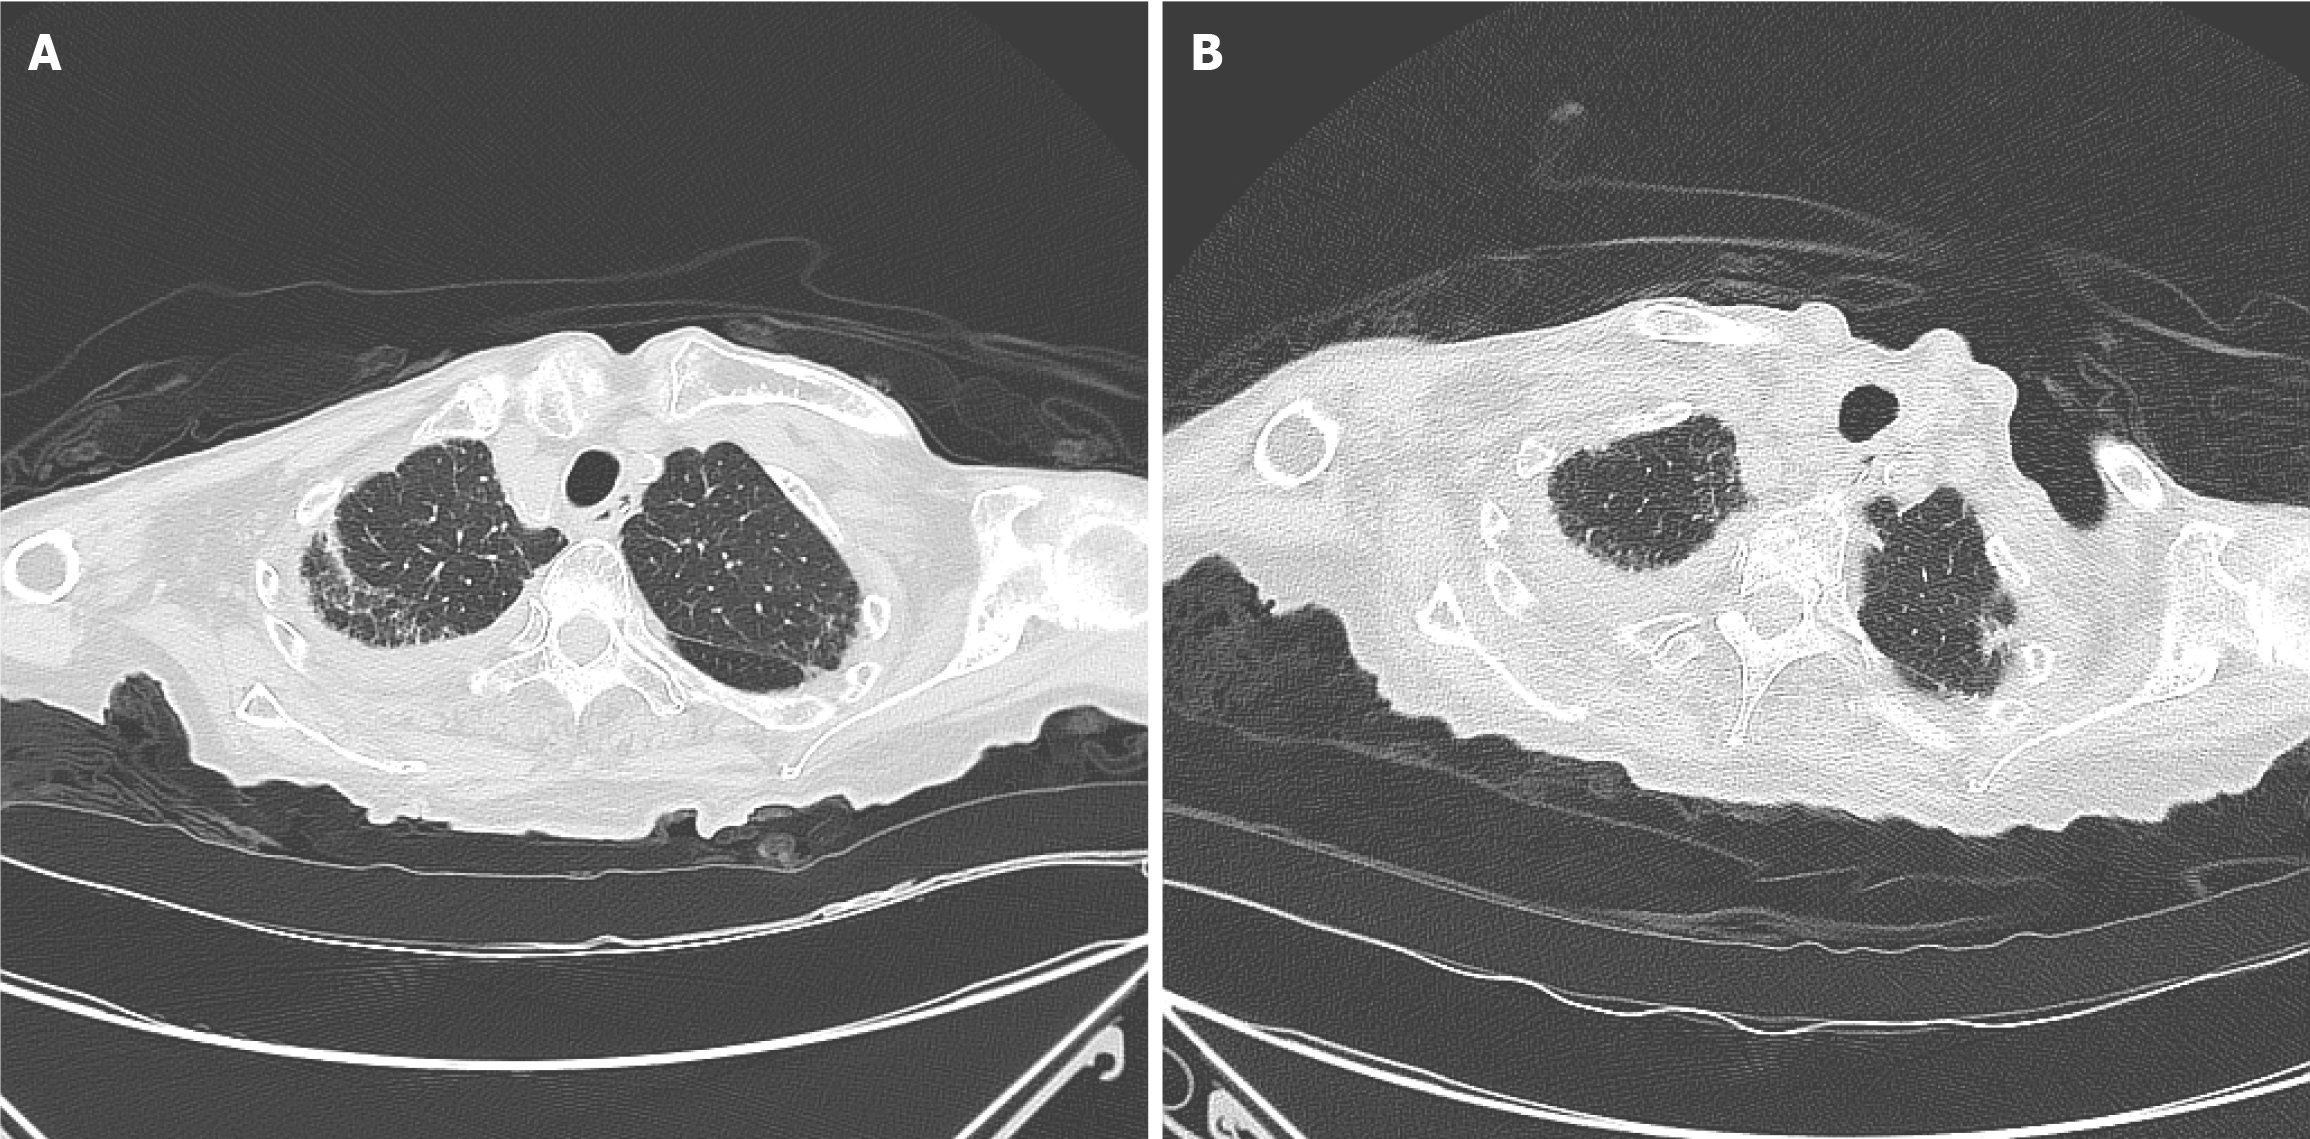
Figure 2 Comparison of lung computed tomography findings.
A: Chest computed tomography (CT) findings upon admission on December 29, 2022: Infectious lesions were present in both lungs with a small amount of fluid on both sides, mainly on the right side; B: Chest CT findings before the patient was discharged on January 6, 2023.
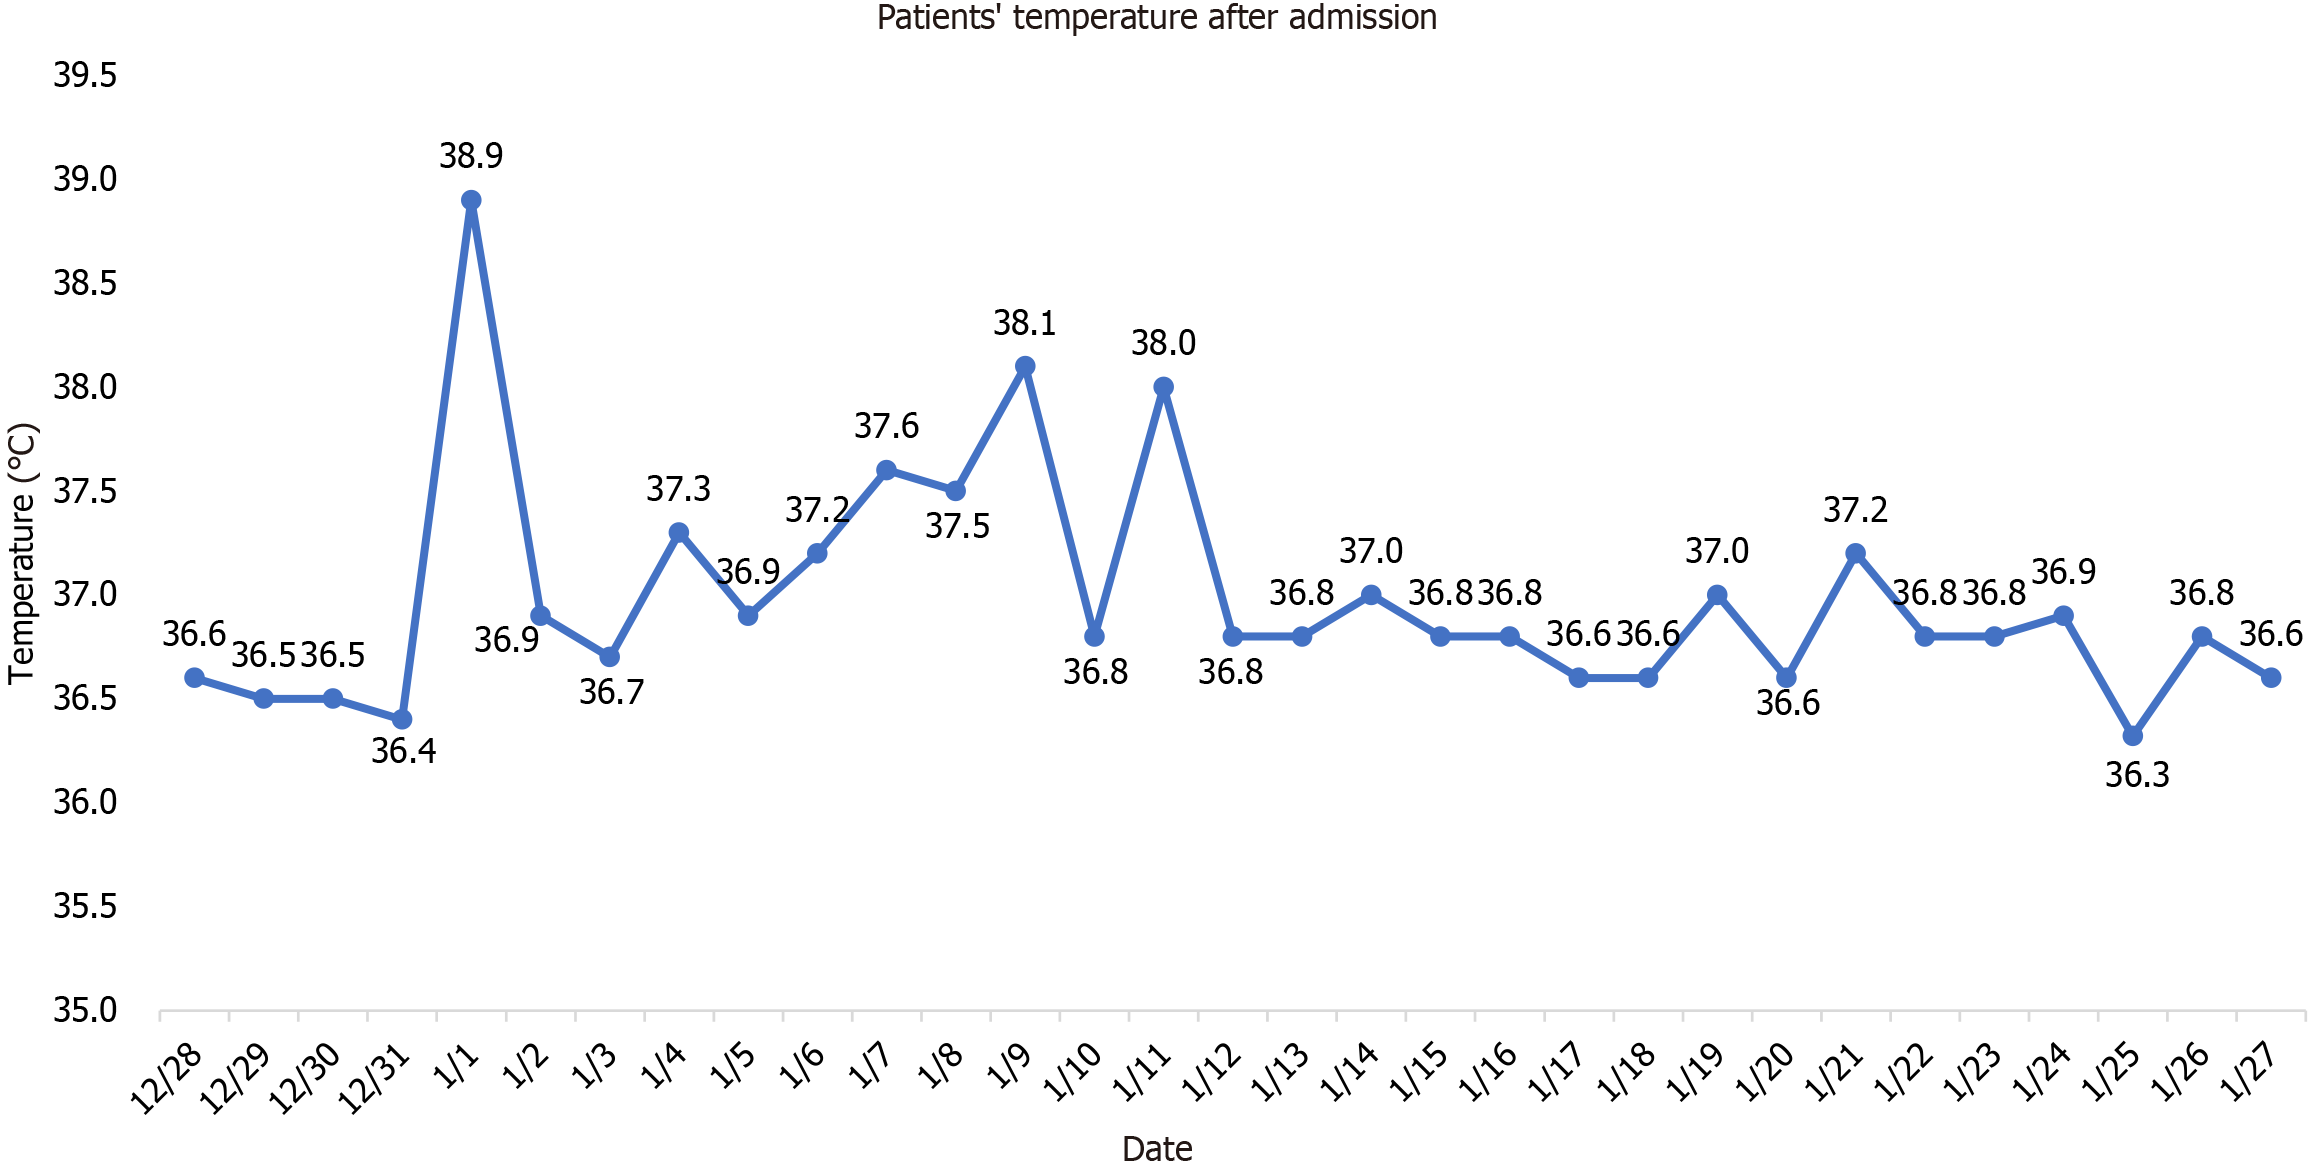
Figure 3
Changes in the patient's body temperature after admission: The patient's body temperature reached the highest 38.
9 °C on January 1, 2023, and returned to normal after January 12.
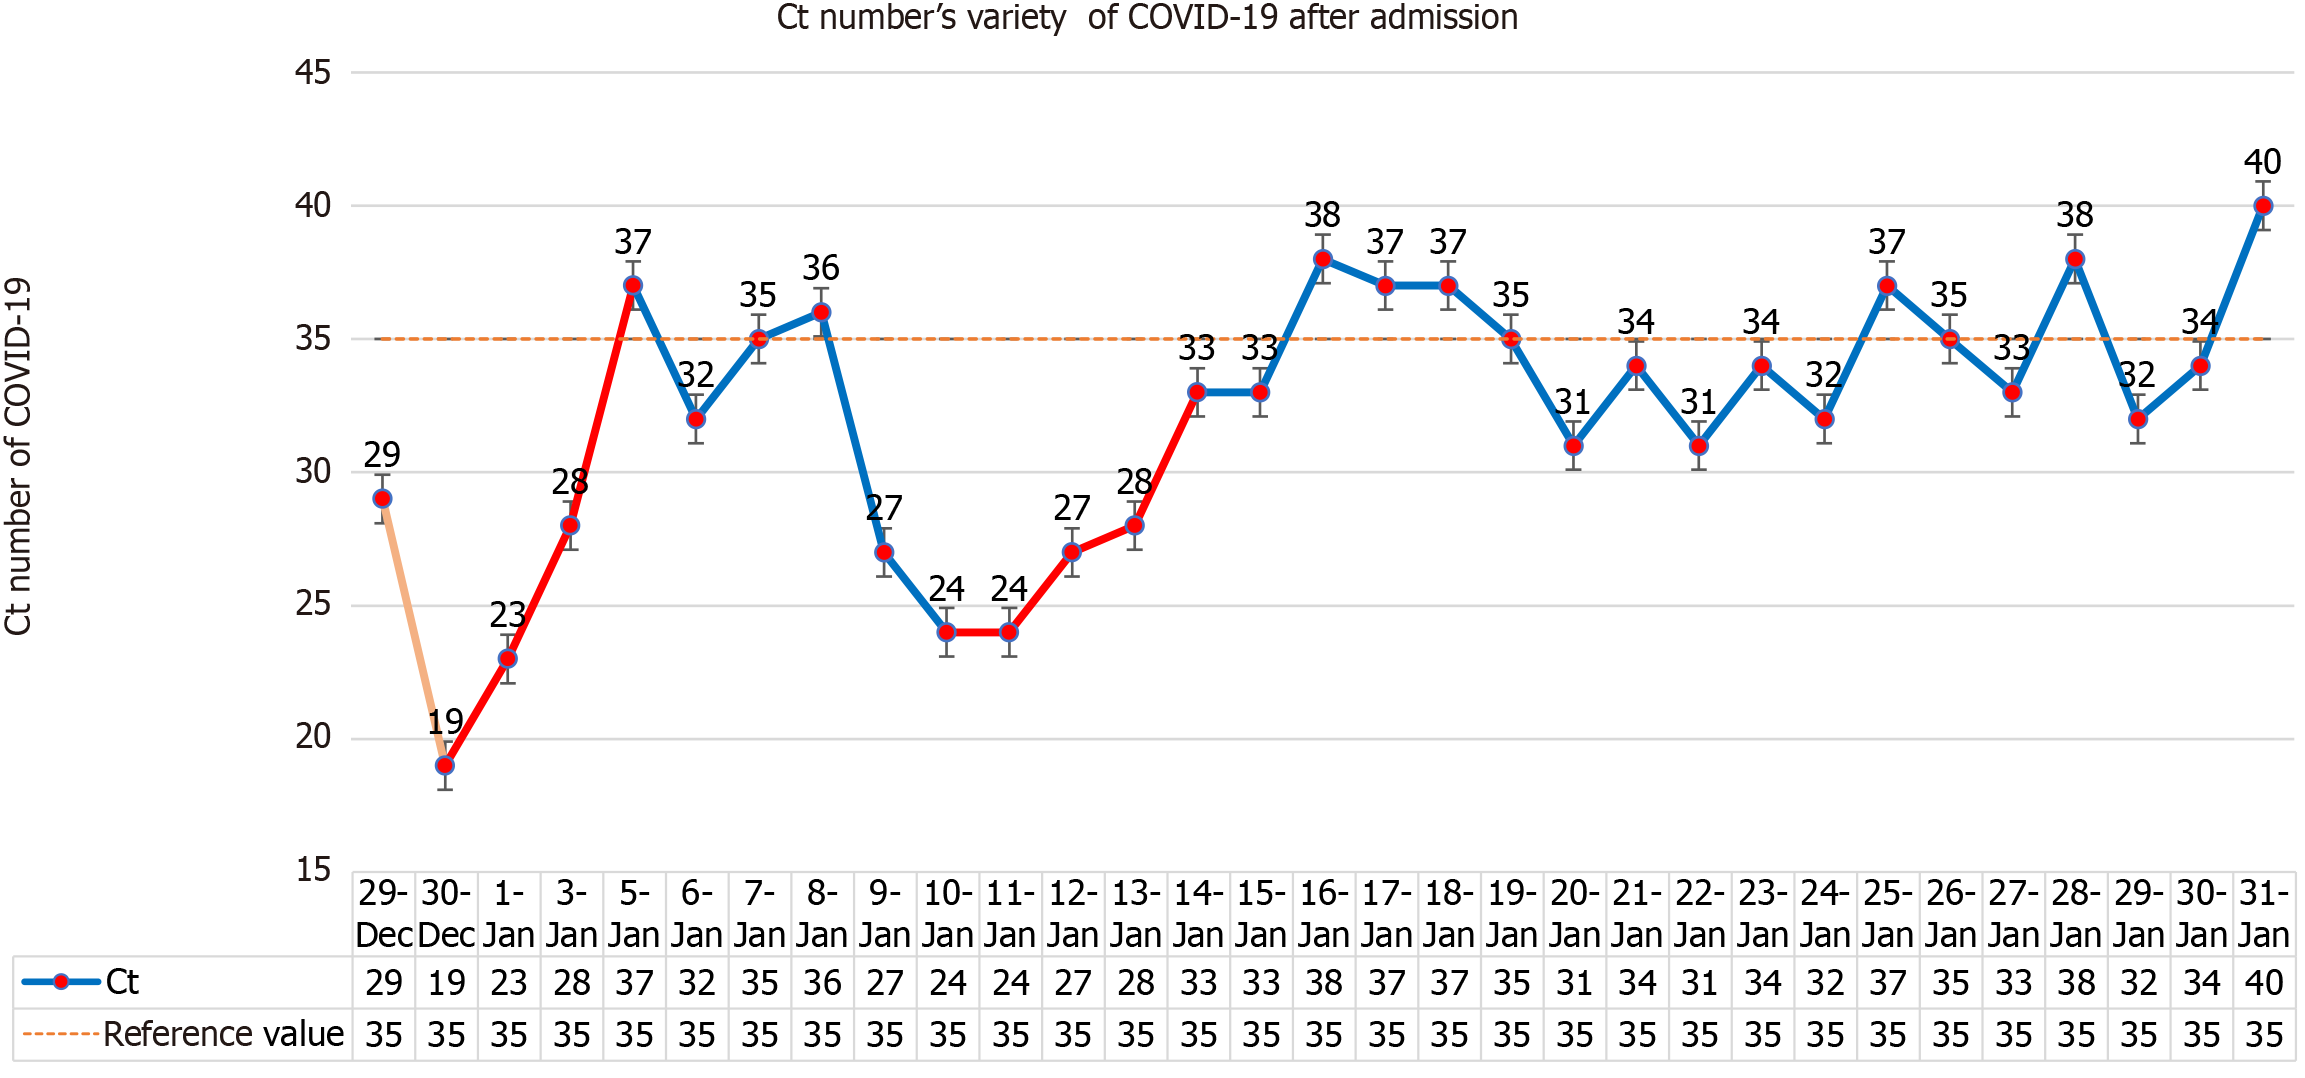
Figure 4 Ct values in this coronavirus disease 2019 patient during hospitalization.
COVID-19: Coronavirus disease 2019.
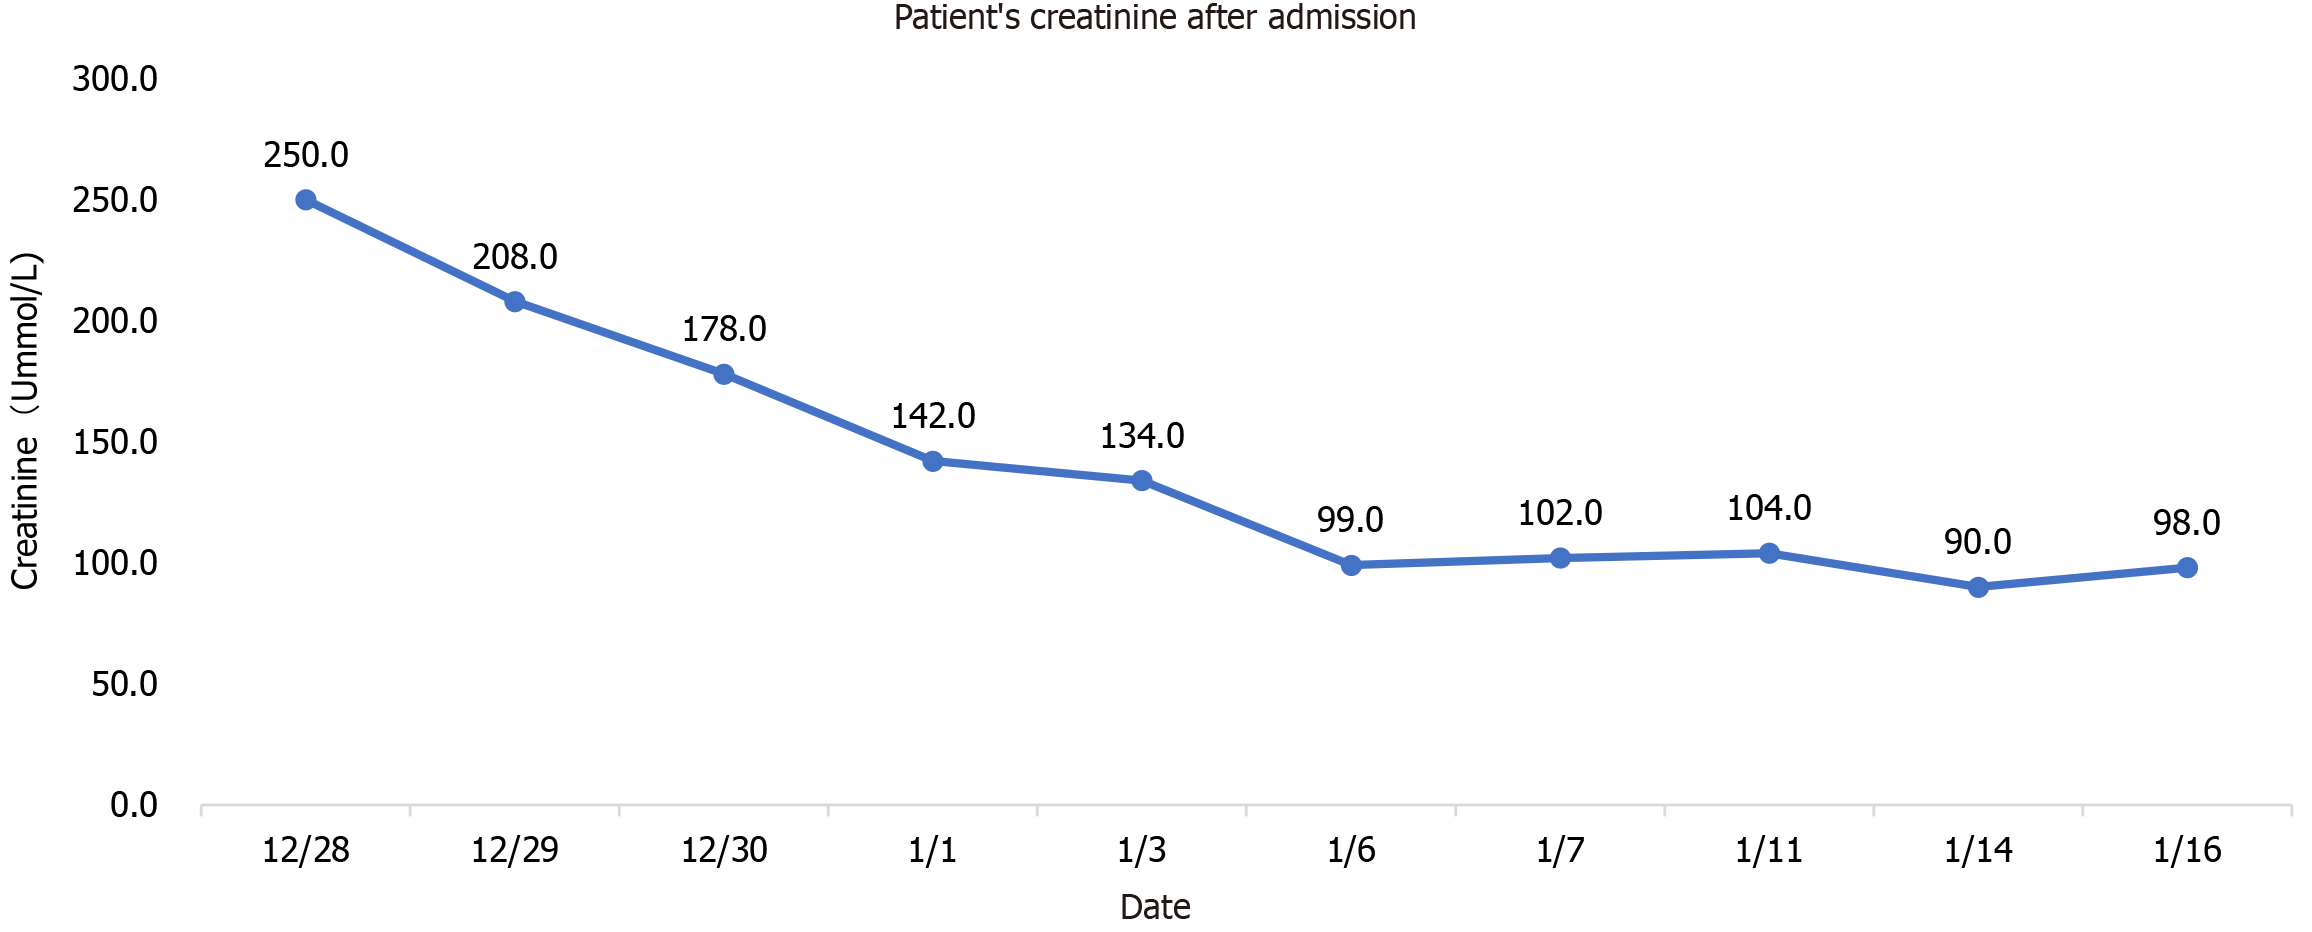
Figure 5 Creatinine changes after admission.
The patient's creatinine reached the highest value of 250 μmol/L on December 28, 2022, then gradually decreased, and basically recovered to normal value on January 14, 2023.
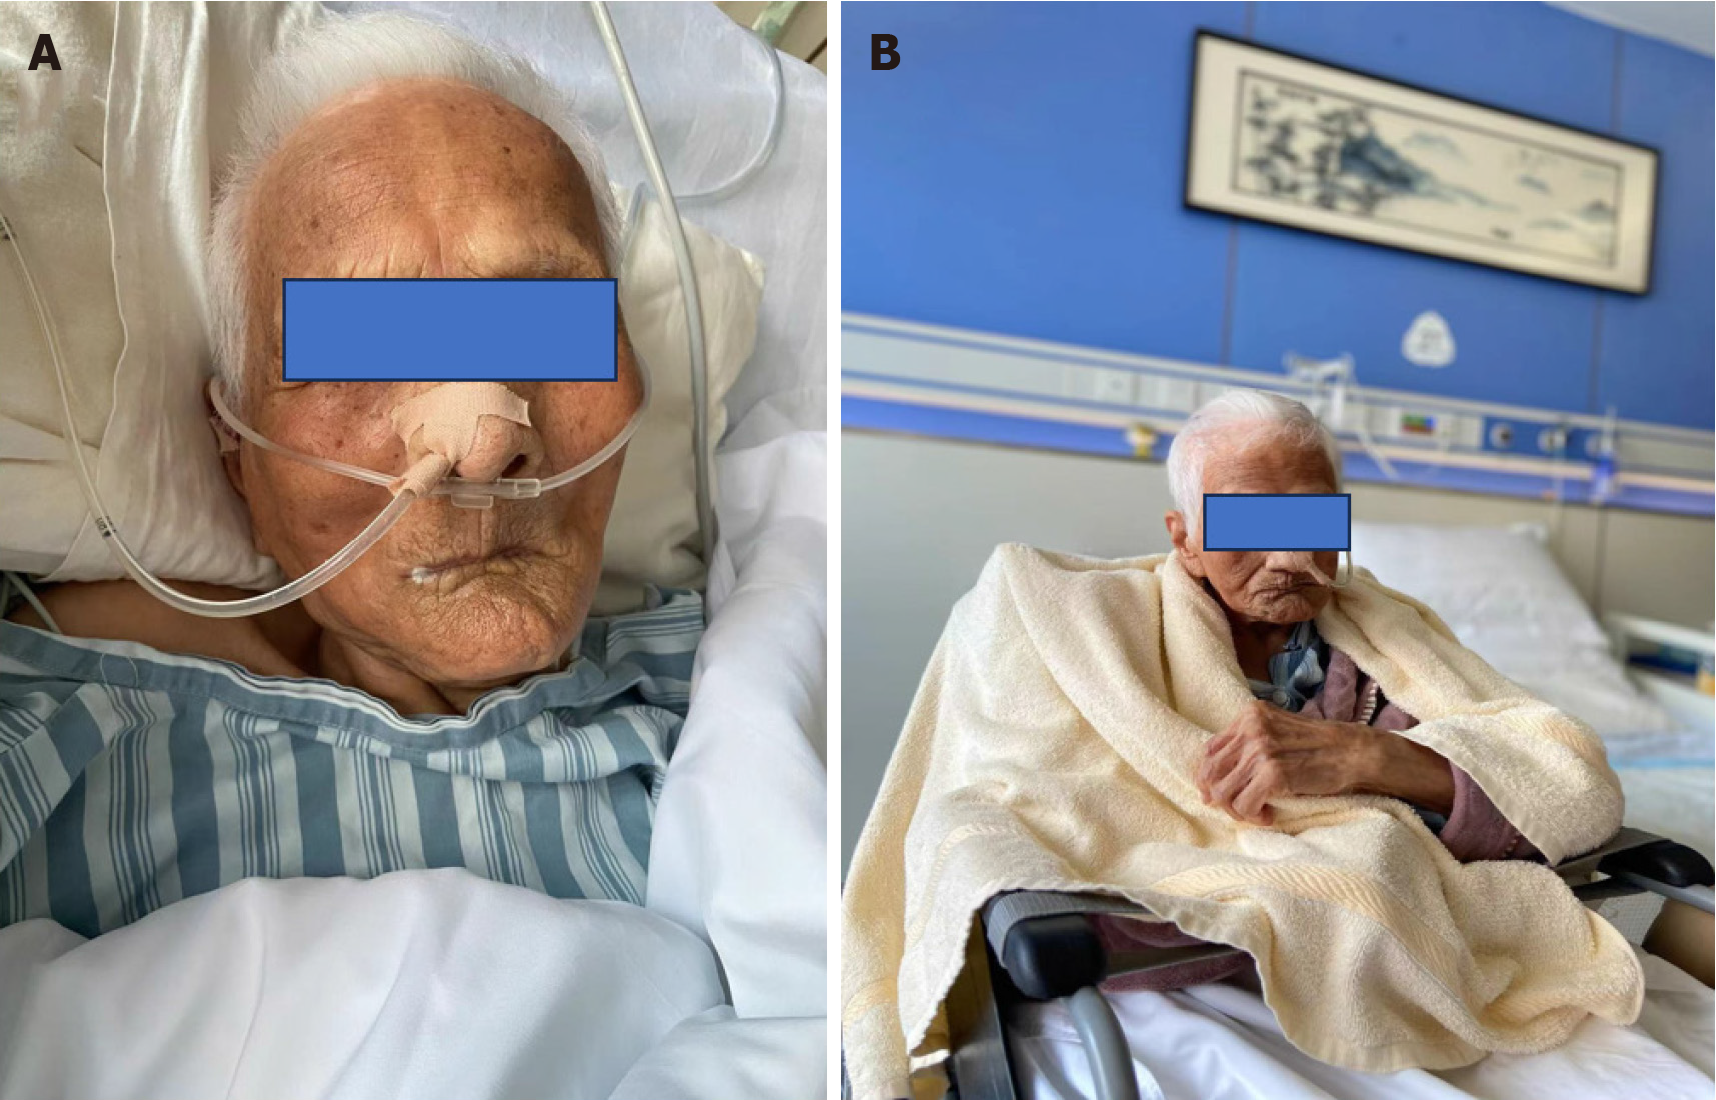
Figure 6 Comparison of the status of the patient during hospitalization and after discharge.
A: Indicates the state of the patient at admission: Mental fatigue; B: Is the state of the patient before discharge: Mental fitness, able to sit and stand for half a day.
- Citation: Zhang YX, Tang J, Zhu D, Wu CY, Liang ML, Huang YT. Prolonged course of Paxlovid administration in a centenarian with COVID-19: A case report. World J Radiol 2024; 16(9): 489-496
- URL: https://www.wjgnet.com/1949-8470/full/v16/i9/489.htm
- DOI: https://dx.doi.org/10.4329/wjr.v16.i9.489


